Why Picking the Wrong Subscription Analytics Platform Will Cost You
Subscription analytics is the practice of tracking and analyzing data from your recurring revenue business — things like who subscribed, who cancelled, how much they paid, and how long they stayed.
If you're a RevOps or finance lead at a SaaS company, here's a quick answer to what you actually need to know:
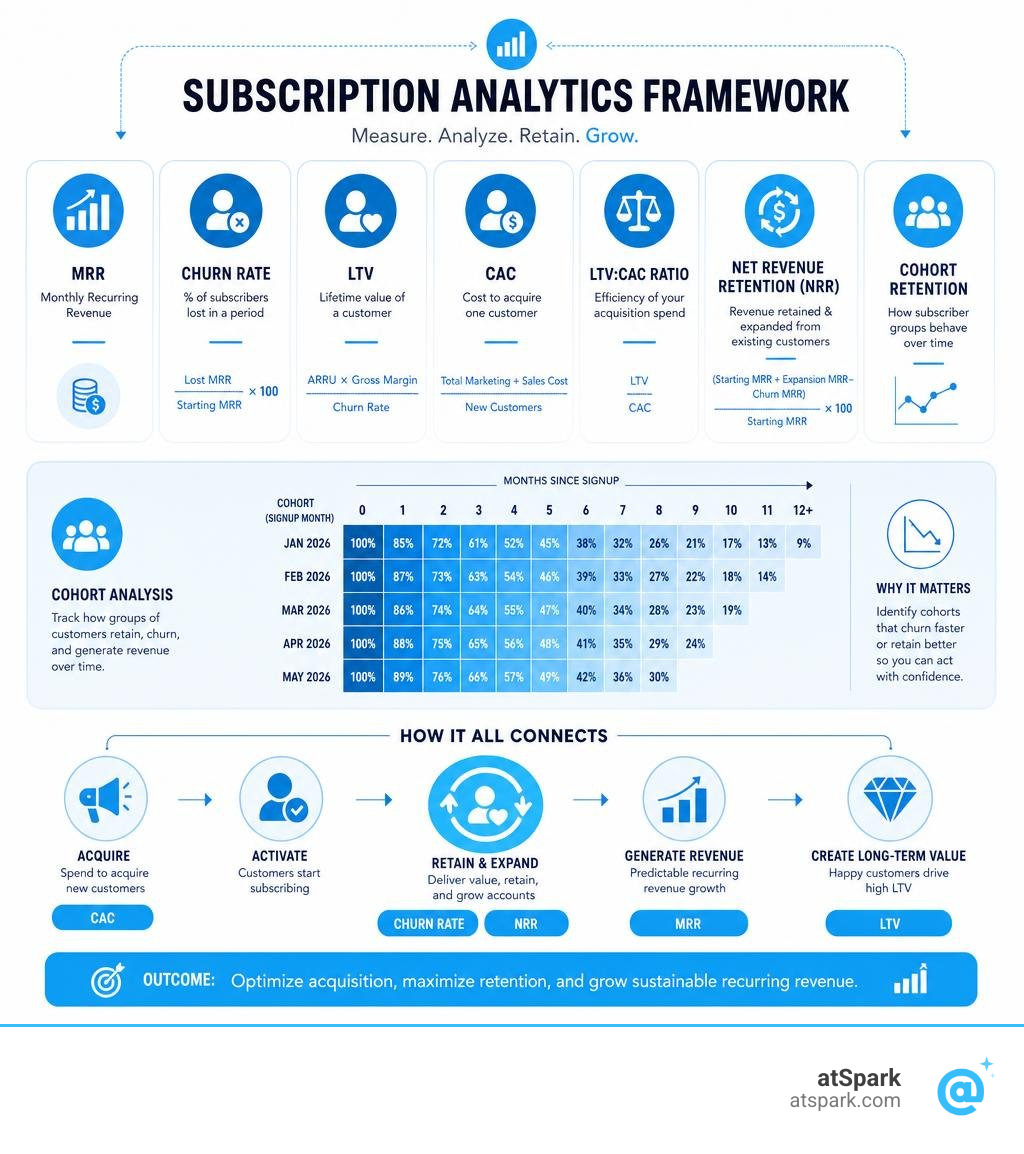
The most important subscription analytics metrics at a glance:
| Metric | What It Measures |
|---|---|
| MRR / ARR | Total predictable recurring revenue per month or year |
| Churn Rate | Percentage of subscribers lost in a given period |
| LTV (Lifetime Value) | Total revenue expected from a single customer |
| CAC (Customer Acquisition Cost) | Total cost to acquire one new customer |
| LTV:CAC Ratio | Whether your acquisition spend is actually profitable |
| Net Revenue Retention (NRR) | Revenue retained and expanded from existing customers |
| Cohort Retention | How groups of subscribers behave over time |
Here's the problem most growth-stage SaaS companies run into: the tools they're using weren't built for the questions they're actually asking.
You need to know why a cohort from Q3 is churning faster than Q1. You need to know which acquisition channel is producing the highest-LTV customers. You need that answer today, not after a three-day data request.
A $100/month subscriber isn't worth $100. Over their lifetime, they could be worth anywhere from $1,200 to $3,600 or more. That gap — between what you think a customer is worth and what they're actually worth — is exactly where the right analytics platform pays for itself.
The challenge is that not all platforms are built equally. Some lock your data inside their own system. Others can't handle custom calculations across multiple data sources. And almost none of them connect billing data, CRM data, and marketing data in one place without engineering help.
This guide compares the leading subscription analytics platforms so you can find the one that actually fits how your business works.
Why Modern Growth Demands Dedicated Subscription Analytics
In a traditional e-commerce or transactional business, a sale is a one-time event. A customer buys a product, you record the revenue, and the transaction is complete. In a subscription business, however, the transaction is just the beginning of the customer relationship. Because subscription businesses rely on recurring revenue, customer acquisition cost (CAC) sustainability is critical. Your financial health depends entirely on customer retention, which directly impacts your long-term recurring revenue.
Without dedicated subscription analytics, you are flying blind. Traditional web analytics or standard transactional databases cannot easily calculate the nuances of recurring revenue streams. They struggle with normalizing annual plans into monthly figures, tracking active subscriptions, handling mid-cycle upgrades or downgrades, and accounting for paused accounts.
To build a sustainable growth engine, you must align your cross-functional teams around a single source of truth. This means looking beyond basic sales figures and monitoring comprehensive SaaS Business Metrics that reflect the health of your customer base. When you understand these dynamics, you can confidently invest in marketing channels that yield high-value subscribers and accelerate your SaaS Growth Metrics.
Core KPIs to Track in Your Subscription Analytics Dashboard
To monitor your recurring revenue health effectively, your dashboard must display more than just your bank balance. It needs to showcase operational, financial, and behavioral metrics in real time.
Here are the essential SaaS Performance Metrics you should monitor:
- Monthly Recurring Revenue (MRR) & Annual Recurring Revenue (ARR): The lifeblood of your business. MRR normalizes your recurring revenue into a monthly number. For example, a $600 annual contract is normalized to $50/month MRR.
- Customer Lifetime Value (LTV): The total net revenue you expect to generate from a customer over the entire duration of their relationship with your business.
- Customer Acquisition Cost (CAC): The total marketing and sales cost required to win a single customer.
- Churn Rate (Logo & Revenue): The percentage of customers (or revenue) lost in a given period.
- Net Revenue Retention (NRR): This measures your ability to retain and expand revenue from existing customers, accounting for upgrades, downgrades, and cancellations.
By organizing these SaaS KPI Examples into a unified SaaS KPI Dashboard, your leadership team can quickly identify whether growth is driven by healthy customer retention or temporary acquisition spikes.
The LTV:CAC Ratio: Measuring Acquisition Sustainability
The LTV:CAC ratio is the ultimate measure of your business's unit economics. It tells you whether the money you spend to acquire a customer is generating a healthy return over their lifetime.
To calculate this, you divide your Customer Lifetime Value by your Customer Acquisition Cost:
$$\text{LTV:CAC Ratio} = \frac{\text{Customer Lifetime Value}}{\text{Customer Acquisition Cost}}$$
A high LTV:CAC ratio indicates that your business is acquiring customers at a low cost relative to the value they generate. In the SaaS industry, a 3:1 ratio is generally considered the baseline for a healthy, sustainable business. If your ratio is 1:1 or lower, you are spending more to acquire customers than they will ever pay you back. If your ratio is 10:1 or higher, you might actually be under-investing in marketing and leaving growth on the table.
Understanding this ratio by acquisition channel is incredibly eye-opening. For instance, organic SEO customers often achieve a 30:1 LTV:CAC ratio, while paid advertising channels might only achieve an 8:1 ratio due to rising ad costs. To forecast these dynamics accurately, you need robust Customer Lifetime Value Forecasting Models and Heuristics That Actually Work. By analyzing How ARPU Compares to CLV and Other Crucial Revenue Metrics, you can allocate your marketing budget to the highest-performing channels.
Cohort Analysis: Unlocking Retention and Product Affinity
A cohort is a group of customers who share a common characteristic over a specific time period — most commonly, the month they signed up. Cohort analysis tracks these groups over time to see how their behavior changes.
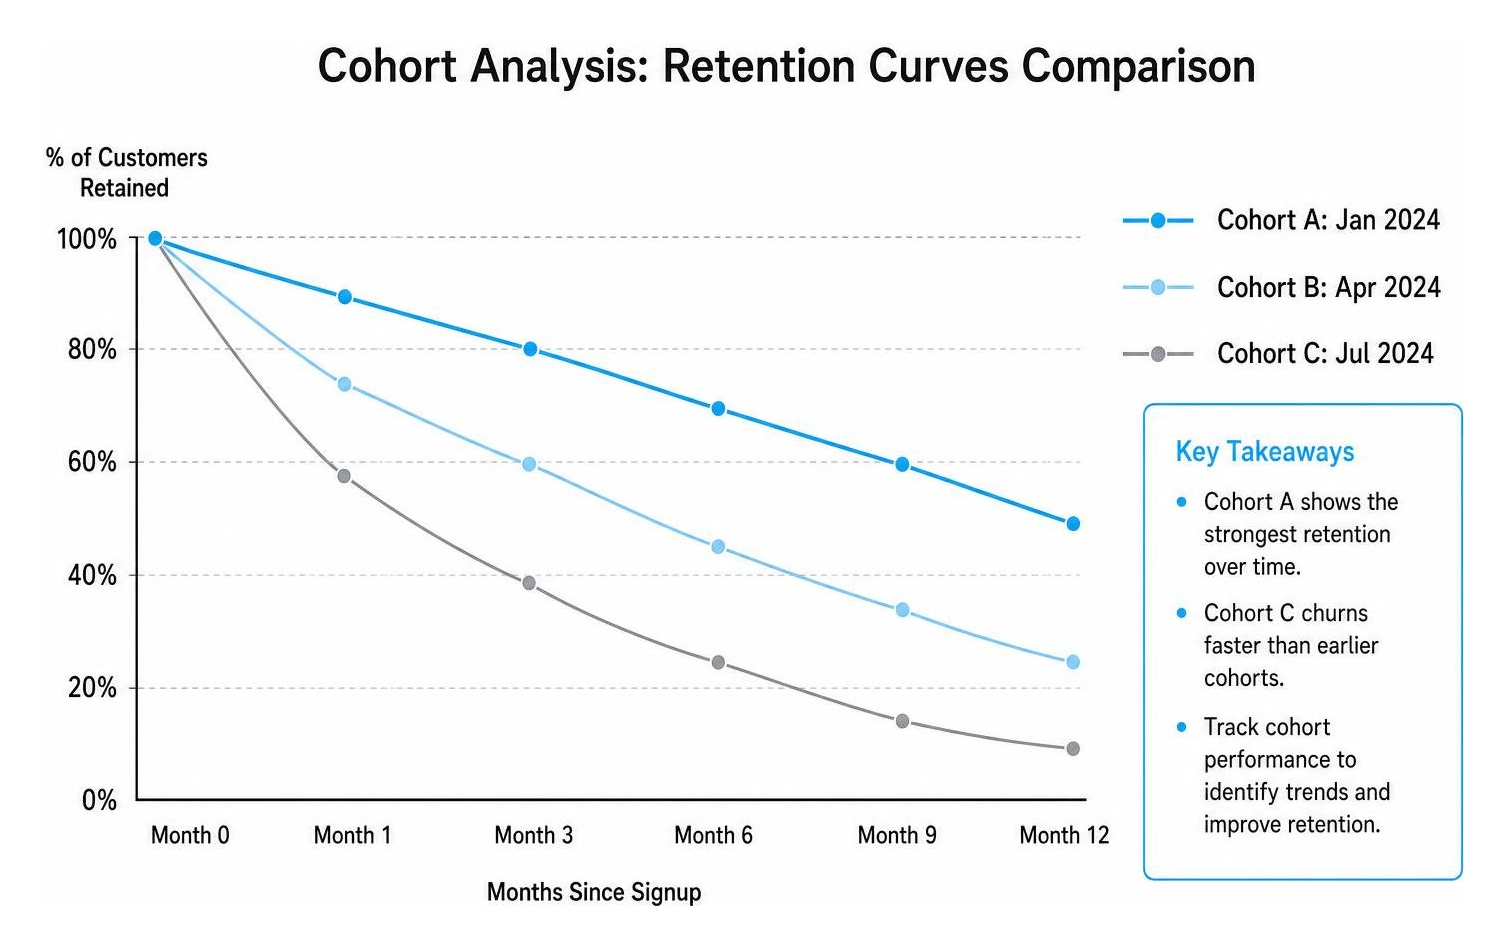
By grouping subscribers into cohorts, you can answer critical questions:
- Are customers who signed up during our holiday promotion churning faster than those who signed up in the spring?
- Does a product update released in June improve retention for subsequent cohorts?
- Which initial product purchase or coupon code leads to the highest long-term customer loyalty?
Cohort analysis also helps you identify product affinity — which features or products are frequently used or purchased together. This intelligence allows you to design targeted cross-sell and upsell campaigns. To get started, you can use our MRR Cohort Analysis Complete Guide to map out your retention curves. Tracking these trends is vital because improving your SaaS Customer Retention Metrics has a compounding positive effect on your bottom line over time.
Build vs. Buy: Choosing Your Subscription Data Strategy
When implementing subscription analytics, every growing brand eventually faces a classic dilemma: should you build a custom data infrastructure or buy an out-of-the-box analytics platform?
Building a custom solution involves setting up your own data lake or data warehouse (like Snowflake or BigQuery) and using ETL pipelines to sync data from your billing gateways, CRMs, and marketing tools. The primary benefit of this approach is complete data ownership and unlimited customizability. You can write custom SQL queries to build any metric imaginable. However, building and maintaining this infrastructure requires significant engineering resources, time, and ongoing maintenance.
Buying an out-of-the-box platform offers a much faster time-to-value. Many platforms integrate directly with popular payment gateways like Stripe, Chargebee, or Recurly, populating a dashboard with standard metrics in minutes. Some tools even offer free tiers for early-stage startups (for example, entry-level SaaS analytics tools are often free for companies with less than $10,000 USD MRR).
The right choice depends on your business's maturity and resource availability. Early-stage startups usually buy to save time, while enterprise brands often build to maintain control. However, as we will explore, there is a modern third way that offers the best of both worlds. Regardless of your path, your goal is to seamlessly connect operational SaaS Customer Success Metrics with behavioral SaaS Product Usage Metrics.
Overcoming the Limitations of Out-of-the-Box Subscription Analytics Tools
While out-of-the-box subscription analytics tools are convenient, they come with severe limitations that can restrict your growth as your business scales:
- Lack of True Data Ownership: Your calculated metrics and historical timelines are locked inside a third-party vendor's ecosystem.
- Rigid Pre-Built Schemas: You cannot easily create complex, custom-calculated metrics that span multiple disparate data sources (like combining CRM activity with billing history).
- Integration Limits: Most out-of-the-box tools only integrate with standard payment gateways. If you use a hybrid billing model, accept manual wire transfers, or run multi-currency setups, these platforms often break.
- No Granular Drill-Down: You can see that churn spiked last month, but you cannot easily query the underlying raw data to find out why without exporting massive CSV files.
These limitations make it difficult to get an accurate picture of your customer health. For example, if a customer changes their billing method, a rigid tool might report it as a cancellation followed by a reactivation, creating false churn spikes. To make sense of your retention without getting bogged down by platform limitations, check out our guide on How to Calculate SaaS Churn Rate and Logo Retention Without Losing Your Mind. Having clean, customizable data is the only way to design proactive strategies and learn How to Stop Your SaaS Customers from Slipping Away.
Solving Common Subscription Data Challenges
Subscription data is notoriously messy. To ensure your analytics are reliable, you must actively address several common challenges:
- Data Accuracy and Discrepancies: It is common to see different revenue figures in your payment gateway, your accounting software, and your analytics platform. These discrepancies usually stem from differing definitions of when revenue is recognized versus when cash is collected.
- Billing and CRM Integration: Your billing gateway knows what the customer paid, but your CRM knows who the customer is and how they behave. Unifying these two data sources is essential to segment your financial metrics by customer attributes (like industry, geography, or company size).
- Duplicate Profiles and False Churn: If a customer signs up for a trial with one email and upgrades with another, or if they update their payment method mid-cycle, standard systems may create duplicate records. This distorts your customer count and artificially inflates your churn metrics.
- Subscription Data Reconciliation: Establishing clear data governance policies and automated data-cleaning pipelines is crucial to ensure that every department is looking at the exact same numbers.
How to Use Subscription Data to Optimize Pricing and Expansion
Once your data is clean and unified, you can use subscription analytics as a strategic weapon to optimize your pricing and drive expansion revenue.

Pricing is one of the most powerful levers for growth, yet it is often the most under-optimized. By analyzing your customer segments, you can identify which plans are highly profitable and where you have opportunities to adjust pricing.
Subscription data also reveals key expansion opportunities through upsells (upgrading customers to higher tiers) and cross-sells (selling complementary features or products). To measure the success of these strategies, you must monitor Average Revenue Per User (ARPU). Understanding your ARPU helps you see if your existing customers are spending more with you over time.
To master this, read our articles on Mastering the Average Revenue Per User Calculation for Your Business and A Comprehensive Guide to ARPU Meaning. Armed with these insights, you can confidently Impress Your Board with These Crucial ARPU Metrics at your next meeting.
Reducing Churn and Recovering Failed Payments
Churn is the silent killer of subscription businesses. To combat it, you must split your churn into two distinct categories:
- Voluntary Churn: When a customer actively chooses to cancel their subscription. This is usually driven by product dissatisfaction, pricing issues, or a lack of perceived value. You can reduce this by analyzing cancellation reasons from your cancel flows and offering targeted save offers or down-grades.
- Involuntary Churn: When a subscription ends due to payment failures, such as expired credit cards, insufficient funds, or bank declines.
Involuntary churn is entirely preventable. By implementing automated dunning campaigns (retry logic, card update prompts, and grace periods), you can recover significant revenue. In fact, many SaaS brands recover over $10,000 in failed payments in just a few months by optimizing their payment recovery workflows. To learn more about maximizing your retention, explore our guide on How to Supercharge Your SaaS Customer Revenue Growth This Year.
Forecasting Future Recurring Revenue
Predictable revenue is what makes the subscription business model so attractive to founders and investors alike. However, forecasting that revenue requires sophisticated modeling.
Simple linear projections often fail because they don't account for historical churn rates, seasonal trends, or pipeline conversion rates. To build reliable forecasts, you must combine your historical subscription metrics with your active sales pipeline.
By applying a weighted forecasting model, you can project future revenue based on the probability of closing open deals. To build an accurate forecasting engine, check out The Ultimate Guide to Weighted Pipeline Sales Forecasting and Analytics and study The Ultimate Guide to Sales Projection Examples for Startups to set realistic growth milestones.
Frequently Asked Questions about Subscription Analytics
To help you choose the right platform and strategy, we've compiled answers to the most common questions we hear from finance and growth leaders.
What is the difference between voluntary and involuntary churn?
Voluntary churn occurs when a user explicitly decides to cancel their subscription (e.g., clicking "Cancel Subscription" in their settings). Involuntary churn occurs when a subscription is cancelled automatically by the billing system due to payment failures (e.g., expired cards or bank declines) after the dunning retry window closes.
How do you calculate the LTV:CAC ratio?
First, calculate LTV by multiplying your Average Revenue Per User (ARPU) by your customer lifetime (1 / Churn Rate). Next, calculate CAC by dividing your total sales and marketing spend by the number of new customers acquired in that same period. Finally, divide LTV by CAC to get your ratio. A healthy target for SaaS companies is 3:1 or higher.
Why do out-of-the-box platforms limit custom metrics?
Out-of-the-box platforms rely on pre-built data schemas and rigid integration pipelines. Because they store your data in proprietary, standardized structures, they cannot easily accommodate custom calculations, external data sources, or complex business logic without breaking their default dashboard layouts.
Conclusion
Choosing the right subscription analytics strategy is not just about choosing a tool — it is about deciding how your team will interact with data.
Traditional approaches force you to choose between rigid, out-of-the-box dashboards that limit your visibility, or complex custom builds that drain your engineering resources. But in 2026, there is a better way.
At atSpark, we believe you shouldn't need a degree in software engineering or SQL to understand your business's growth. Our AI-powered revenue analytics platform unifies your billing, CRM, and subscription data into a single, secure source of truth. Instead of waiting days for custom reports, atSpark allows your team to ask plain-English questions and receive instant, beautiful charts, tables, and insights.
Ready to experience conversational, governed analytics without the engineering headache? Learn more about What is AI Revenue Analytics? and let us help you unlock the true potential of your subscription data today.