What Is the Average Revenue Per User Calculation (and How Do You Do It)?
The average revenue per user calculation is simpler than most finance teams expect:
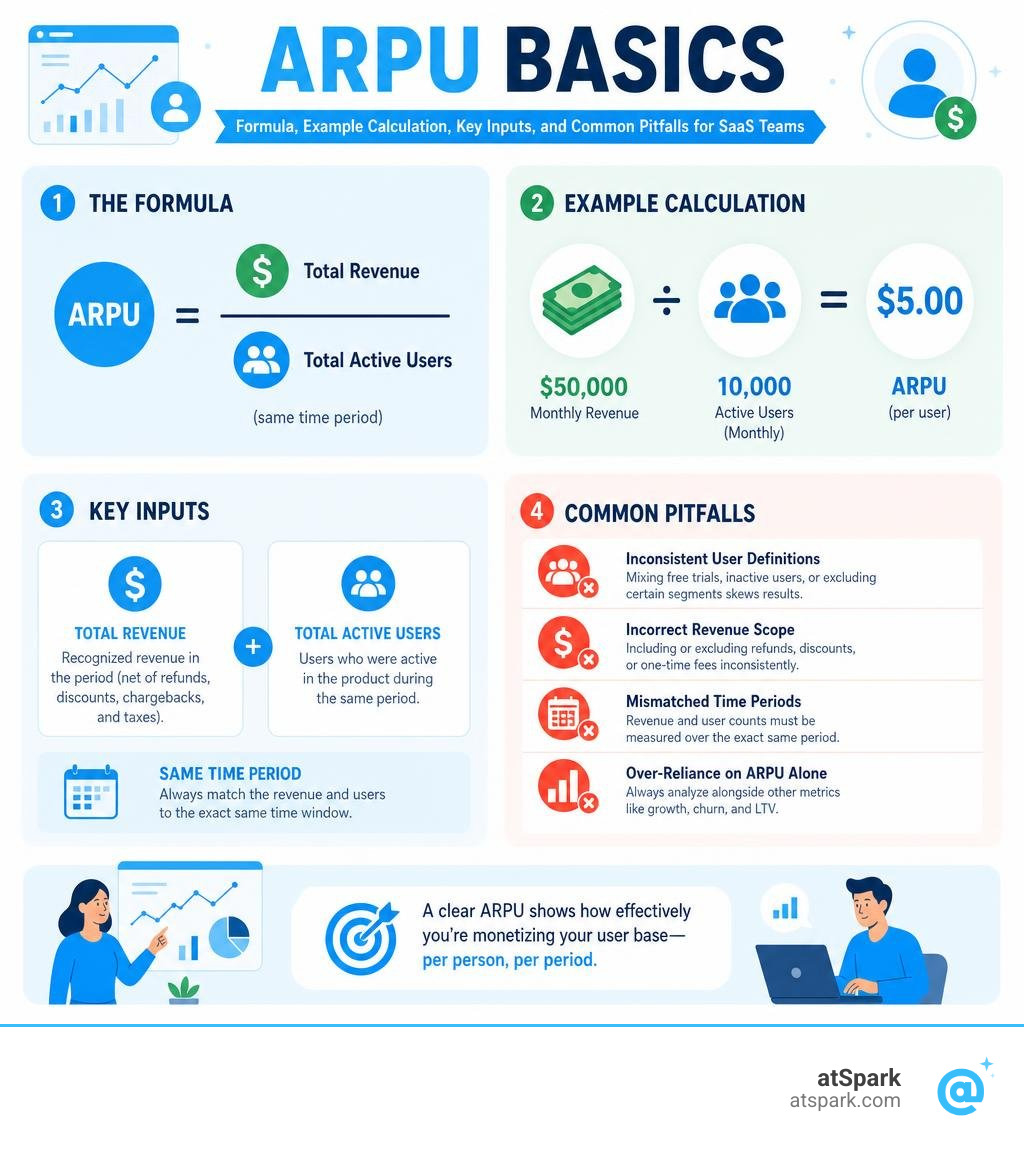
ARPU = Total Revenue ÷ Total Active Users (for the same time period)
For example: $50,000 in monthly revenue ÷ 10,000 active users = $5.00 ARPU
That's the core formula. But getting it right — with a clean numerator, a consistently defined denominator, and a time period that actually means something — is where most teams run into trouble.
If you're a Finance or RevOps lead, you've probably seen this play out: leadership wants to know how monetization is trending, and someone pulls a number from a spreadsheet that doesn't match the figure from last quarter. Different definitions of "active user." Revenue that includes or excludes refunds depending on who ran the report. Free trial users mixed in with paying customers.
The result? A metric that looks straightforward but quietly erodes trust in your data.
ARPU is one of the most important unit economics signals a SaaS business has. It tells you how effectively you're monetizing your user base right now — not over a lifetime, not in aggregate, but per person, per period. A rising ARPU signals that pricing and upsell strategies are working. A stagnant or falling ARPU is an early warning sign, often visible before total revenue charts show any concern.
This guide walks you through exactly how to calculate it, what to watch out for, and how to use it to make faster, better decisions.
Understanding ARPU and How It Compares to Other Metrics
To truly master the average revenue per user calculation, we must first understand what this metric represents in the grander scheme of business health.
At its core, ARPU is a direct measure of your monetization efficiency. It is the ultimate antidote to vanity metrics. It is easy to celebrate getting a million free app downloads, but if those users do not generate revenue, your business cannot survive. As the saying goes, you can either acquire a hundred elephants or 100,000 mice. ARPU helps you understand exactly which species is currently populating your customer base.
In B2B SaaS, mobile gaming, and subscription-driven industries, tracking ARPU prevents us from falling into the trap of pursuing growth for growth's sake. If our customer base expands by 50% but our ARPU drops by half, we are working twice as hard to support users who generate pennies.
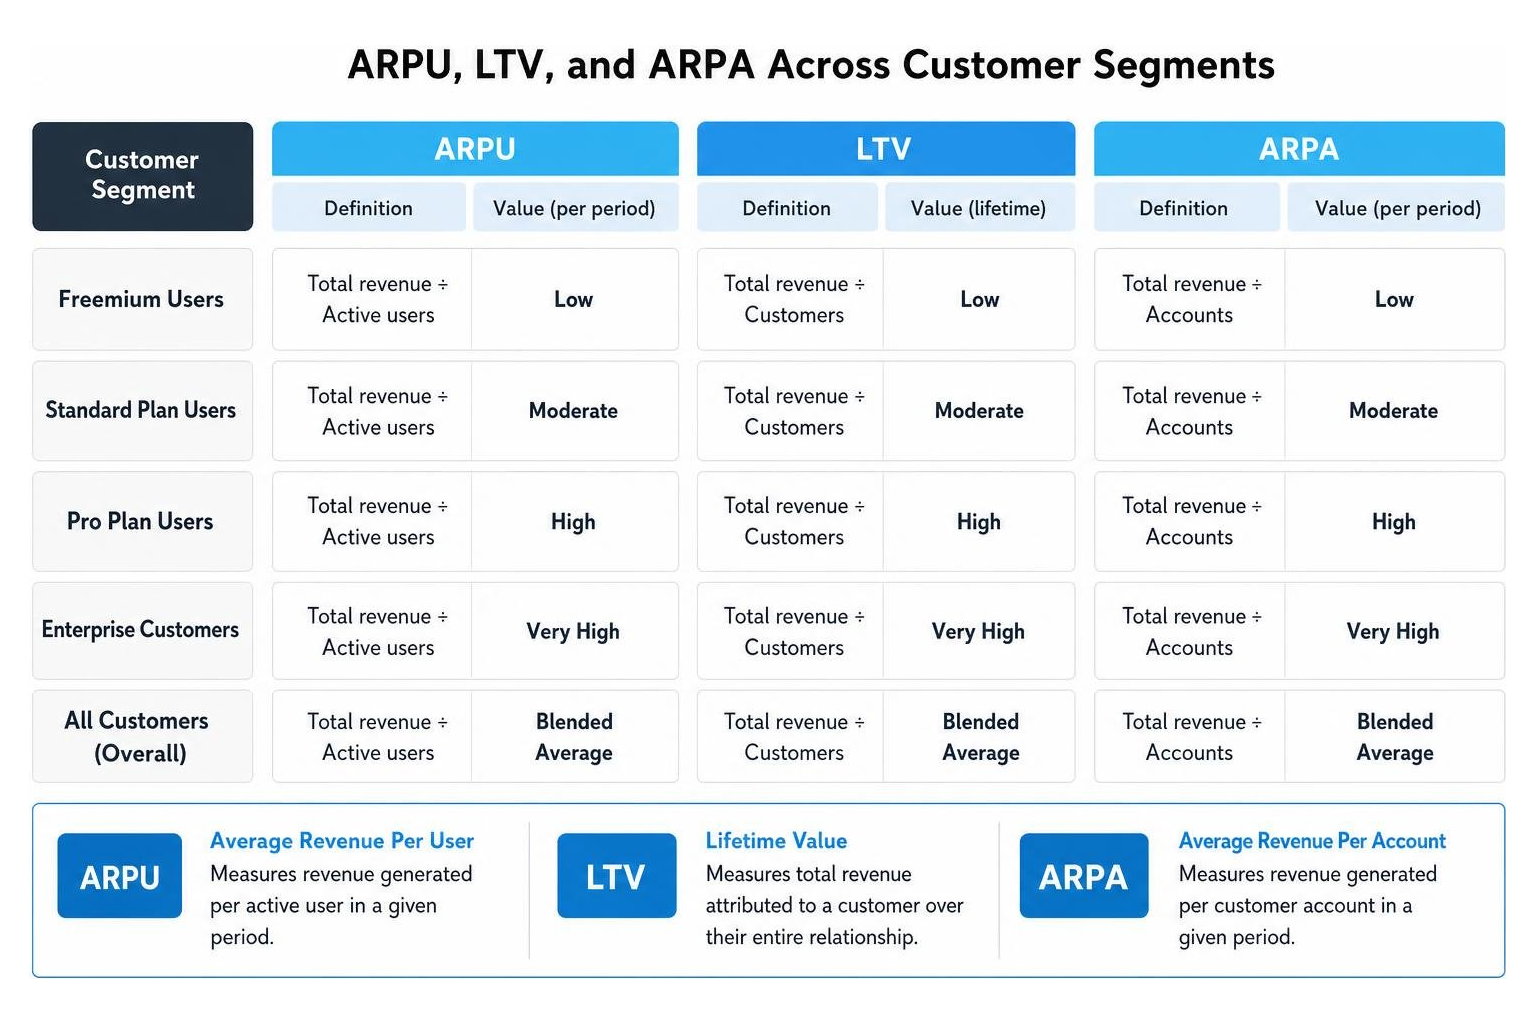
To visualize how these metrics interact across different customer segments, consider this breakdown:
To build a sustainable business model, we must compare our ARPU against our Customer Acquisition Cost (CAC). If the average revenue we generate from a user over a standard period is lower than what it costs to acquire them, we are fighting a losing battle. By analyzing this relationship, we can determine the exact ceiling on how much capital we can safely spend to fund our growth and expansion plans.
For a deeper strategic look at how this metric shapes your business model, you can read Shopify's guide on ARPU meaning and calculations.
Why Your Business Needs an Average Revenue Per User Calculation
If you are not actively tracking your ARPU, you are steering your business with a foggy windshield. This calculation is vital for several foundational reasons:
- Revenue Tracking and Health Checks: It provides a granular, unit-level view of how effectively your product-led growth and pricing strategies are performing.
- Investor Perspectives: Venture capitalists and private equity firms look closely at ARPU trends. For example, in 2026, seed-round investors expect to see strong early traction, while Series A and Series B investors look for rising ARPU as a clear signal of upmarket motion or successful expansion.
- Strategic Decision-Making: ARPU tells us whether our marketing campaigns are bringing in high-value users or low-value bargain hunters. It ensures we allocate our engineering and support resources to the customer segments that actually drive our top-line growth.
To understand how ARPU fits into your broader financial reporting, check out our comprehensive guide on SaaS Business Metrics.
ARPU vs. ARPPU: Paying vs. Free Users
One of the most common mistakes teams make is using ARPU and Average Revenue Per Paying User (ARPPU) interchangeably. They are fundamentally different, and confusing them will skew your unit economics.
- ARPU (Average Revenue Per User) divides your total revenue by all active users, including those on free or freemium tiers.
- ARPPU (Average Revenue Per Paying User) divides your total revenue strictly by the paying subset of your user base.
This distinction is massive for freemium business models. For context, industry benchmarks show that typically only around 5% of users actually make in-app purchases (IAP) in mobile apps. Furthermore, Statista reports that around 97% of apps in the Google Play Store and just over 95% of apps in the Apple App Store are completely free to download.
If a streaming service has 1 million total active users but only 400,000 are paying subscribers, calculating ARPU across the entire 1 million will yield a much lower figure than calculating ARPPU for the 400,000 paying users. Tracking the gap between these two metrics tells us exactly how well our freemium-to-paid conversion funnel is working. For more details on this distinction, you can read Stripe's resource on ARPU and ARPPU.
ARPU vs. ARPA and LTV
How does ARPU differ from other acronyms like ARPA and LTV?
- ARPA (Average Revenue Per Account): While ARPU is calculated at the individual user level, ARPA is calculated at the account or company level. For B2B SaaS enterprises selling multi-seat team plans, ARPA is often the more meaningful metric because billing, contracts, and retention are tied to the corporate account rather than individual employees. You can read more about this in HiBob's financial metrics guide.
- LTV (Customer Lifetime Value): ARPU is a snapshot of revenue generated within a specific, set timeframe (usually a month or a year). LTV, on the other hand, incorporates your churn rate to estimate the total revenue an individual customer will generate across their entire relationship with your business.
LTV models typically combine ARPU (or ARPA), gross margin, and retention rates to help us understand long-term customer value. This directly impacts your LTV:CAC Ratio, which is a primary indicator of SaaS scalability.
To see how these metrics work together to build a complete dashboard, explore our breakdown of Important SaaS Metrics.
Step-by-Step Average Revenue Per User Calculation
To get a highly accurate average revenue per user calculation, you must align your timeframes and clean your data. Let's look at how monthly and annual calculations compare:
| Metric Component | Monthly ARPU | Annual ARPU |
|---|---|---|
| Primary Revenue Input | Monthly Recurring Revenue | Annual Recurring Revenue |
| Denominator (Users) | Average active users during the month | Average active users during the year |
| Best Used For | Fast-paced SaaS, B2C subscription apps, mobile games | Enterprise B2B SaaS, annual contract value tracking |
| Data Noise Level | Low (smoothed out by monthly recurring billings) | Medium (can be skewed by seasonal renewals or churn) |
If you want to run quick scenarios without building a spreadsheet from scratch, you can use the FoundStep ARPU Calculator.
To calculate your ARPU manually, follow these three steps:
- Choose your timeframe: Decide whether you are measuring monthly, quarterly, or annual performance, and stick to it.
- Sum your revenue (The Numerator): Gather all revenue generated specifically from your users during that timeframe.
- Count your active users (The Denominator): Determine the number of active users during that exact same timeframe.
- Divide: Divide the total revenue by the user count to get your ARPU.
Defining the Numerator: Total Revenue
The numerator of your calculation should include all revenue streams generated directly by your user base during the specified period. This includes:
- Recurring subscription billings
- Upgrades and expansion revenue (e.g., Expansion MRR)
- Modular add-ons and "a la carte" features
- In-app purchases and transactional fees
- Ad revenue generated from displaying ads to your users
However, to keep your ARPU clean, you must exclude non-recurring revenue like one-time setup fees, custom development services, and migration costs. You must also subtract refunds, chargebacks, and Contraction MRR to avoid artificially inflating your monetization performance.
Defining the Denominator: Active Users
The denominator is where most data discrepancies occur. To keep your calculations consistent, you must establish a strict definition of what constitutes an "active user."
Does a user count as active if they simply log in once? Or must they perform a key action within your app? Whichever definition you choose, apply it consistently across all reporting periods.
Another common pitfall is using only the user count from the final day of the month. This ignores daily user fluctuations and customer churn. Instead, calculate the average number of active users for the period using this formula:
Average Active Users = (Active Users at Start of Period + Active Users at End of Period) ÷ 2
When tracking these changes, it is also helpful to monitor how your user base shifts alongside your Net New MRR to ensure you are adding high-value customers rather than low-tier users.
Actionable Strategies to Increase Your ARPU
If your ARPU is stagnant, you are fighting an uphill battle to scale. Fortunately, you do not always need to acquire thousands of new customers to grow your bottom line. Often, optimizing how you monetize your existing user base is the fastest way to drive growth.

By structuring your offerings and focusing on customer success, you can naturally lift your average user spend. To see how tracking these changes impacts your overall growth trajectory, review our guide on SaaS Growth Metrics and see which SaaS Metrics to Track for long-term health.
Optimizing Pricing and Packaging
Small packaging and pricing changes often move the needle on ARPU much faster than pure customer acquisition. Consider these techniques:
- Introduce Tiered and Value-Based Pricing: Align your pricing tiers with the value your customers receive. As their usage or business scales, they should naturally migrate to higher-priced tiers.
- Highlight Your Preferred Tier: Use visual cues like bright colors, badges, or "Most Popular" tags on your pricing page to create a bandwagon effect, steering prospects toward your higher-value plans.
- Offer Modular Add-Ons: Instead of raising your core subscription prices, introduce optional, modular add-ons or "a la carte" features. This lets power users pay for advanced functionality while keeping your entry-level plans accessible.
- Audit Freemium and Trial Plans: If too many users are happy on your free tier, you might be giving away too much value for free. Tighten your freemium limitations to give users a clear incentive to upgrade.
For more details on how to structure your pricing for maximum yield, check out our guide on SaaS Performance Metrics.
Improving Customer Retention and Reducing Churn
A rising ARPU paired with rising churn is a dangerous combination—it means you are pricing out your core audience. To build a healthy business, you must pair your monetization strategies with strong customer engagement and retention.
- Prioritize High-Value Accounts: Flag support tickets from high-tier accounts and provide them with faster SLA response times. A low-cost customer can easily consume their entire lifetime value in support costs if they require manual attention, whereas enterprise accounts justify dedicated care.
- Focus on Customer Personas: Regularly review your customer data to identify which personas have the highest retention and spend. Shift your marketing efforts to target those specific profiles.
- Re-engage Inactive Users: Use targeted email campaigns and push notifications to bring inactive users back into your app before they churn.
To model how improvements in your retention rates will impact your monthly revenue, you can use our MRR Calculator.
Frequently Asked Questions about ARPU
What is a good ARPU for SaaS businesses?
There is no single benchmark for a "good" ARPU because it depends heavily on your industry, target audience, and business model.
For example, a midsize B2B SaaS company might target an ARPU of $500 to $5,000 per month by focusing on enterprise tiers. Meanwhile, a high-volume B2C streaming platform or mobile app might view $10 to $20 per month as a massive success.
To put this in perspective, let's look at some real-world figures from major consumer platforms in 2024:
- Spotify reported €15.62 billion in annual revenue with a monthly ARPU of €4.62.
- Meta reported a quarterly ARPU of $11.89 in Q2 2024 (up from $10.93 in Q2 2023).
- Snap reported a quarterly ARPU of $2.86 in Q2 2024 (up from $2.69 in Q2 2023).
- T-Mobile experienced a shift in its customer base between 2013 and early 2024, where prepaid ARPU rose from 28.25% to 37.18%, while postpaid ARPU declined from 54.5% to 48.79%.
A good ARPU is one that supports healthy unit economics for your specific business—meaning it comfortably exceeds your Customer Acquisition Cost (CAC) and yields strong margins. To model your own targets, try the CalcMastery ARPU Calculator.
Should free trial users be included in the calculation?
No, never. Including free trial users or non-paying sign-ups in your active user count will artificially inflate your denominator, deflate your ARPU, and make your monetization look much worse than it actually is.
Keep your trial-to-paid conversion pipelines completely separate. Only include users in your ARPU calculations once they have officially converted to a paying subscription tier.
How does ARPU relate to Gross Margin?
While ARPU is a revenue-based metric, your true business health is determined by profitability. This is where Gross Margin comes in.
To understand your true unit economics, you should calculate your gross profit per user by multiplying your ARPU by your gross margin percentage. This ensures that the revenue you generate from each user is actually enough to cover your hosting, support, and delivery costs while leaving a healthy margin for growth.
Conclusion

Automating Your Average Revenue Per User Calculation
Mastering the average revenue per user calculation is not just about knowing the math; it is about having clean, reliable data that you can act on in real time.
If your team is still manually exporting CSVs from Stripe, combining them with usage logs in Excel, and arguing over the definition of an "active user" every month, you are losing valuable time. Manual calculations are prone to errors and quickly become outdated.
That is where we can help. atSpark is an AI-powered analytics platform designed specifically for SaaS companies. We unify your billing, CRM, and subscription data into a single, governed source of truth.
Instead of writing complex SQL queries or building fragile spreadsheets, atSpark lets you ask plain-English questions like:
- "What was our monthly ARPU for enterprise users in Europe last quarter?"
- "Show me a chart of our ARPU vs. CAC over the last 12 months."
- "Which customer acquisition channels yield the highest ARPU?"
You get instant, accurate charts, tables, and insights without needing engineering help.
Ready to stop guessing and start growing? Explore our glossary entry on ARPU to learn more, or get started with atSpark today to unlock the true power of your business data.