Why Most Sales Forecasts Break (And How a Weighted Pipeline Performance Dashboard Fixes It)
A weighted pipeline performance dashboard gives revenue and RevOps teams a real-time, probability-adjusted view of their sales pipeline — so you can forecast with confidence instead of guessing.
Quick answer: What does a weighted pipeline performance dashboard do?
| Feature | What It Gives You |
|---|---|
| Weighted Pipeline Value | Total pipeline value adjusted by each deal's closing probability |
| Pipeline Coverage Ratio | How much weighted pipeline you have vs. your revenue target |
| Deal-Level Risk Signals | Flags stale deals, close date slips, and low-quality opportunities |
| Forecast Accuracy | Replaces gut-feel with math — accuracy improves 25–40% vs. unweighted methods |
| Audience-Specific Views | Separate views for execs, managers, and reps |
Here's an uncomfortable truth: 93% of sales leaders miss their annual number by more than 10% — and most of them had a pipeline. They just weren't measuring it right.
The problem isn't pipeline size. It's pipeline quality.
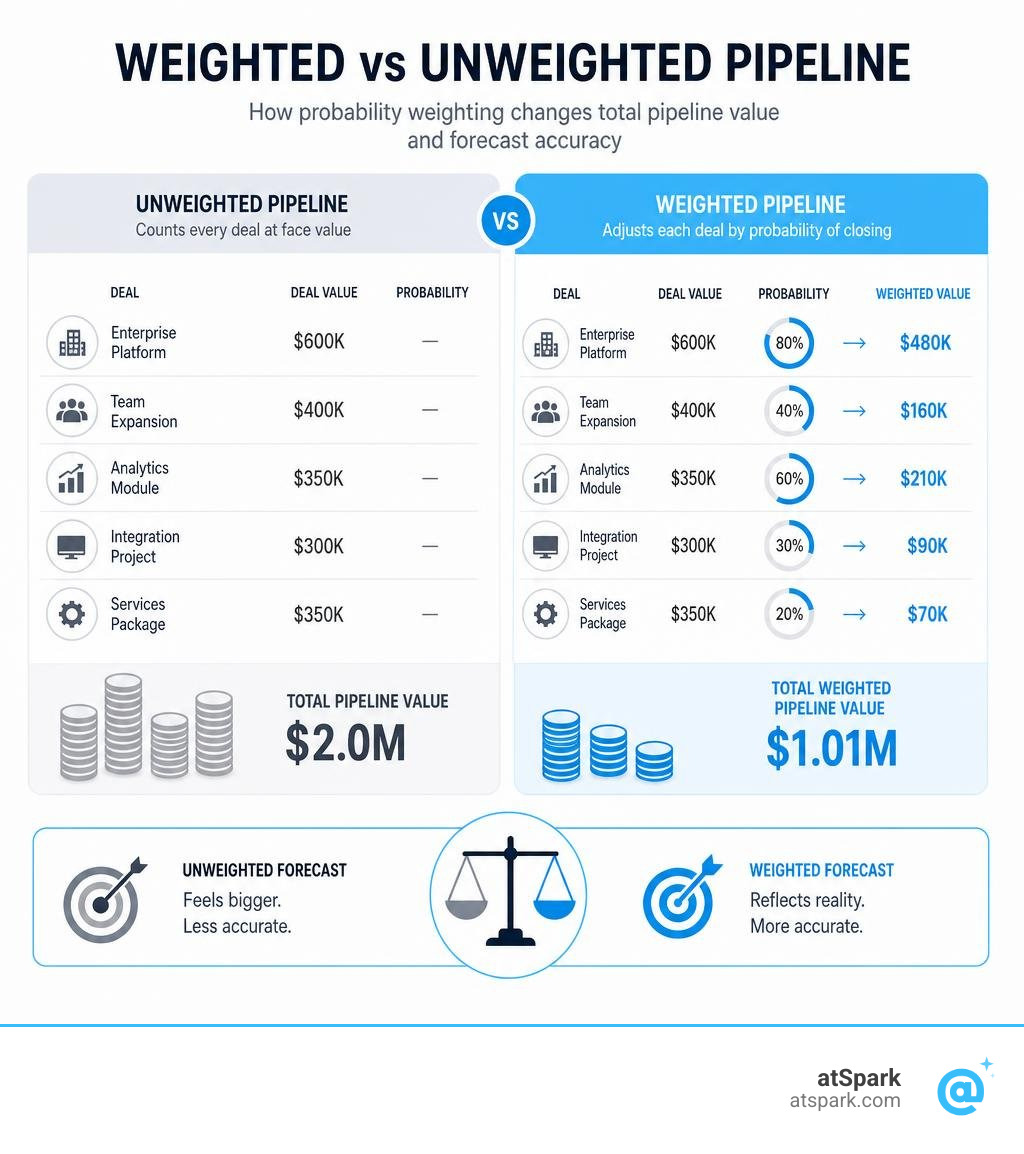
A raw pipeline value of $2M sounds great. But if half those deals are stuck in Discovery, haven't moved in 90 days, and have had their close dates pushed three times — your real forecast is nowhere near $2M.
That's exactly the trap that unweighted pipeline metrics set. They count every open opportunity at face value, regardless of how likely it actually is to close.
Weighted pipeline flips that. It multiplies each deal's value by its probability of closing, so your forecast reflects reality — not optimism.
Teams using weighted pipeline dashboards achieve 91% forecast accuracy, compared to just 68% for traditional stage-based methods. And yet, only 7% of sales teams consistently finish the year above 90% of plan without this kind of analysis in place.
If you're a RevOps or finance lead tired of reconciling spreadsheets before every board meeting — this guide is for you.
What is a Weighted Sales Pipeline?
To understand how a weighted pipeline performance dashboard works, we must first look at the foundation of pipeline management.
A standard Sales Pipeline tracks the journey of open opportunities as they progress through sequential stages, from initial qualification to a closed-won deal. Similarly, the Sales Funnel visualizes this conversion journey.
The core challenge with a standard pipeline is that it treats every dollar the same. If you have a $100,000 deal in "Discovery" and another $100,000 deal in "Negotiation," an unweighted pipeline reports your total value as $200,000. But we all know those two deals do not have the same likelihood of closing.
A weighted pipeline solves this by introducing probability metrics. It assigns a percentage-based win probability to each opportunity, allowing you to discount early-stage deals and give more weight to late-stage opportunities. This mathematical adjustment is what powers forecasting accuracy, turning a list of hopes into a reliable revenue prediction.
Weighted vs. Unweighted Pipelines
The difference between these two approaches comes down to how we value open opportunities.
- Unweighted Pipeline Value: This is the absolute, raw sum of all open opportunities. It is a volume metric that tells you the maximum potential value of your pipeline. While useful for understanding overall capacity, relying on unweighted value for your revenue forecast is highly risky. It ignores closing likelihood and creates a false sense of security.
- Weighted Pipeline Value: This is the probability-adjusted value of your pipeline. It takes the total deal value of each opportunity and multiplies it by its specific closing probability.
By looking at the weighted value, you gain deep pipeline visibility. You can see how much of your pipeline is actually "real" and ready to convert into revenue, helping you identify gaps before they impact your end-of-quarter results.
How to Calculate Weighted Pipeline Value for Accurate Forecasting
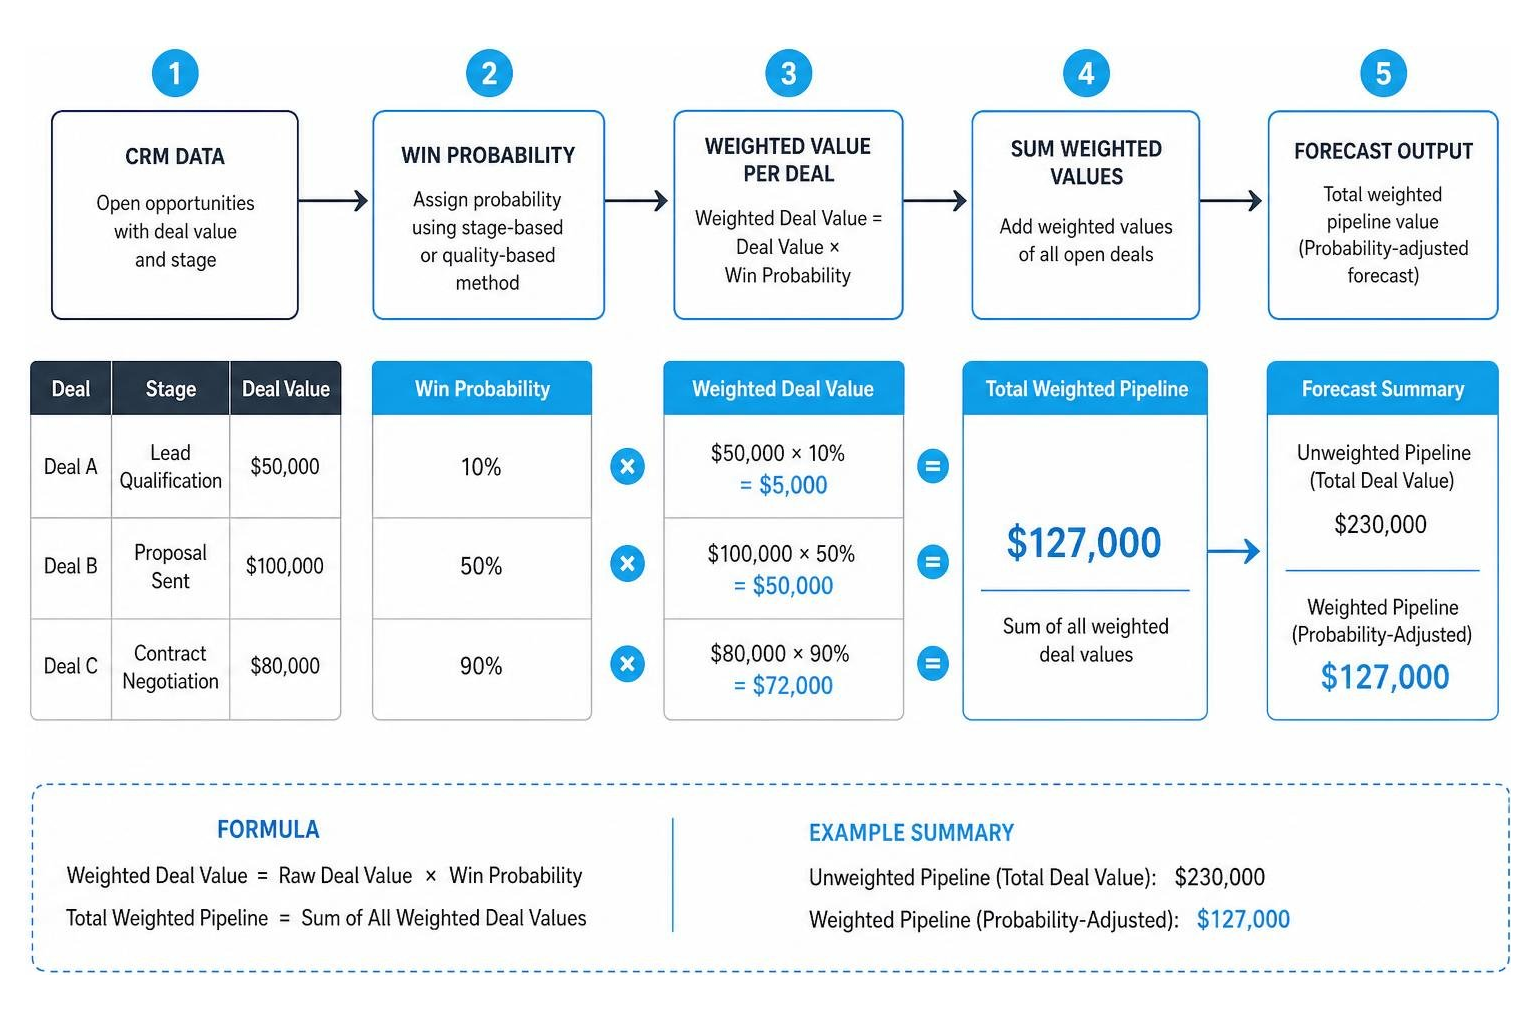
Calculating your weighted pipeline value requires multiplying each open opportunity's total value by its Deal Win Probability. Once you have the weighted value for each deal, you sum them up to find your total probability-adjusted Sales Forecast.
The formula is straightforward:
Weighted Deal Value = Raw Deal Value × Win Probability
Total Weighted Pipeline = Sum of All Weighted Deal Values
For example, if you have three deals in your pipeline:
- Deal A: $50,000 in Lead Qualification (10% probability) = $5,000 weighted
- Deal B: $100,000 in Proposal Sent (50% probability) = $50,000 weighted
- Deal C: $80,000 in Contract Negotiation (90% probability) = $72,000 weighted
Your unweighted pipeline is $230,000, but your weighted pipeline value is $127,000.
When building a weighted pipeline performance dashboard, you can calculate these probabilities using two primary methods: stage-based weighting or quality-based weighting.
| Weighting Method | How It Works | Pros | Cons |
|---|---|---|---|
| Stage-Based Weighting | Assigns a fixed probability to each stage of your sales cycle based on historical conversion rates. | Simple to set up; highly objective; easy to automate in your CRM. | Ignores individual deal risks; can be gamed by reps moving deals prematurely. |
| Quality-Based Weighting | Scores each opportunity across multiple dimensions (e.g., stakeholder engagement, budget confirmation) to calculate a custom probability. | Extremely accurate; accounts for deal-specific nuances and buyer behavior. | Requires more manual input; can become subjective if not governed by clear criteria. |
Best Practices for Assigning Deal Win Probability
To keep your calculations accurate, you must establish clear, objective standards for assigning probabilities. Here are the best practices we recommend:
- Define Strict Stage Entry Criteria: Do not let reps assign probabilities based on "gut feel." A deal should only move to a higher-probability stage when specific, verifiable actions occur (e.g., a signed NDA, a completed technical discovery, or a formal business case presentation).
- Use a Buyer-Readiness Diagnostics Framework: Instead of relying solely on CRM stages, ask three qualification questions during pipeline reviews:
- Can the buyer clearly articulate the business problem they need to solve?
- Can they explain why our solution is the right partner for them?
- Is there a compelling event driving them to make a decision this quarter? If the answer to any of these is "no," the deal's win probability should be heavily discounted, regardless of its stage.
- Analyze Historical Conversion Rates: Look at your historical data over the last three to four sales periods to see what percentage of deals in each stage actually ended up as closed-won. Use these real-world conversion rates as your baseline probabilities.
Key Metrics to Include in Your Weighted Pipeline Performance Dashboard
A great dashboard doesn't just display data; it tells a story about your revenue health. To build a dashboard that drives action, you need to combine volume, quality, and velocity metrics.
When setting up your SaaS KPI Dashboard, you want to balance leading indicators (what is about to happen) with lagging indicators (what already happened). For inspiration on what to track, you can review common SaaS KPI Examples.
Core KPIs for a Weighted Pipeline Performance Dashboard
Your dashboard should prominently feature these four core metrics:
- Weighted Pipeline Value: The total probability-adjusted value of your open opportunities. This is your most reliable leading indicator for end-of-period revenue.
- Total Open Pipeline (Unweighted): The absolute sum of all open deals. This helps you monitor your team's total capacity and raw pipeline generation.
- Won-Lost Rate: The percentage of closed opportunities that you win. This measures your overall competitive strength and market fit.
- Conversion Rate: The percentage of your total pipeline value that successfully converts to closed-won revenue over a given period.
Advanced Metrics: Pipeline Velocity and Coverage Ratios
To get a complete picture of your revenue engine, you should also track these advanced metrics:
- Pipeline Coverage Ratio: This compares your open pipeline value to your remaining revenue target. For example, if your remaining quota is $1M and your unweighted pipeline is $3M, you have a 3x coverage ratio.
Sales Velocity: This measures the speed at which your pipeline generates revenue. The formula is:
Sales Velocity = (Number of Opportunities × Average Deal Size × Win Rate) ÷ Sales Cycle Length (in days)Average Sales Cycle Length: The average number of days it takes for an opportunity to progress from creation to closed-won.
- Stagnant Deal Percentage: The share of your open opportunities that have had no sales activity or stage changes for more than 30 days. Ideally, this should remain under 20%.
Designing and Segmenting Your Dashboard for Different Audiences
A common pitfall when building dashboards is trying to make a single view work for everyone. Different stakeholders need different levels of detail to make decisions.
- The Executive View (Strategic): Executives need a high-level view of revenue health. Their view should focus on total weighted pipeline vs. quarterly targets, historical coverage trends, and AI-driven revenue projections.
- The Manager View (Operational): Managers need to monitor team performance and coach reps. Their view should highlight pipeline by owner, stage-to-stage conversion rates, stagnant deal alerts, and individual quota attainment scorecards.
- The Rep View (Tactical): Reps need a workspace to manage their daily activities. Their view should focus on their individual pipeline, upcoming close dates, stagnant deals requiring immediate action, and their personal progress toward quota.
To make these dashboards work, organizations often rely on unified data pipelines. While sales teams use CRM dashboards, data engineering and operations teams use specialized monitoring solutions.
For example, teams managing large-scale data workflows might use the Data Pipeline Monitor to track data health, or deploy the React Dashboard Data Pipeline Block for custom front-end visualizations.
On the infrastructure side, some teams monitor their technical delivery pipelines using resources like stelligent/pipeline-dashboard or Manzela/pipeline-observatory. For machine learning and model evaluation workflows, tools like TheStageAI/Spikes-Pipes help teams compare performance runs side-by-side.
If you want a pre-built business template for general reporting, options like the Pipeline Infrastructure KPI Dashboard in Power BI - Next Gen Templates can help you get started quickly with Excel integrations.
Required Data Fields for a Weighted Pipeline Performance Dashboard
To build an automated, reliable sales dashboard, your CRM must consistently capture several key data fields:
- Opportunity ID & Name: Unique identifiers for each deal.
- Opportunity Owner: The sales representative managing the deal.
- Pipeline Stage: The current step in the sales cycle.
- Deal Amount (Value): The total projected contract value.
- Close Date: The estimated date the contract will be signed.
- Close Date Month Extensions: A counter tracking how many times the close date has been pushed to a future month.
- Days in Current Stage: How long the deal has sat in its current pipeline stage.
- Days Open: The total age of the opportunity since creation.
- Custom Probability Field: The percentage weight applied to the deal (either automated by stage or manually adjusted based on quality scoring).
How Managers Use Weighted Analysis to Improve Forecasts and Avoid Pitfalls
A weighted pipeline performance dashboard is a powerful management tool, but it is only as good as the coaching and data hygiene behind it. Managers must use the dashboard to actively identify risks and keep CRM data clean.

Identifying At-Risk Deals and Slippage
When reviewing your dashboard, look for red flags that indicate a deal is likely to slip or fall through:
- 3+ Close Date Month Extensions: If a rep has pushed a deal's close date three or more times, the likelihood of it closing drops significantly. These deals should be flagged in red on your dashboard.
- Stagnant Stage Progress: If a deal has been sitting in an early stage (like Discovery) for longer than your average sales cycle, it is highly likely to be dormant.
- Unbalanced Funnel Distribution: A healthy pipeline should have a balanced mix of early, mid, and late-stage deals. If your near-term pipeline is heavily weighted with early-stage deals, your forecast is overly optimistic.
Avoiding Gaming and Maintaining Data Hygiene
To prevent reps from "gaming" the system (such as keeping dead deals open to show high pipeline volume, or sandbagging late-stage deals), establish a strict weekly pipeline review cadence:
- Audit Deal Quality Weekly: Do not let reps simply report on their deals. Walk through the opportunity table, validate stage entry criteria, and confirm that close dates are realistic.
- Clean Out Stale Pipeline: Encourage reps to move stagnant or lost deals out of the active pipeline. Having a smaller, highly qualified pipeline is always better than a bloated, unrealistic one.
- Enforce Accountability: Use your dashboard's leaderboard and rep views to highlight hygiene metrics, making data accuracy a key part of team performance expectations.
Frequently Asked Questions about Weighted Pipelines
How often should weighted pipeline data be refreshed?
Your CRM data should sync with your dashboard in real-time or near-real-time (such as every 15 minutes) to ensure you are looking at current deal updates. However, complex calculations — such as your historical win rates by stage or weighted pipeline averages — should be recalculated on a daily basis to maintain performance without cluttering active views.
What is a healthy pipeline coverage ratio?
For standard B2B SaaS companies, a healthy unweighted pipeline coverage ratio is 3x to 5x of your remaining quarterly revenue target. If you are running an enterprise sales model with longer sales cycles and larger deal sizes, you should target 4x to 6x coverage to confidently hit your goals. For your weighted pipeline, the total value should sit between 100% and 125% of your quarterly target.
Can you use weighted pipelines for complex enterprise sales?
Yes, but traditional stage-based weighting is often too simplistic for enterprise sales. Instead, enterprise teams should use a quality-weighted scoring model (such as a 30-point deal confidence score). This model scores deals across multiple dimensions — like executive alignment, multi-threaded engagement, and formal procurement steps — to generate a highly customized and accurate win probability.
Conclusion
Building and maintaining a weighted pipeline performance dashboard is one of the most effective ways to bring predictability to your revenue engine. It takes the guesswork out of forecasting, exposes hidden risks in your sales cycle, and helps your team focus their energy on the deals most likely to close.
But keeping your dashboard accurate shouldn't require a team of database engineers or endless SQL queries.
That's where atSpark comes in. As an AI-powered analytics platform designed specifically for SaaS companies, atSpark unifies your billing, CRM, and subscription data into a single source of truth. Instead of wrestling with complex spreadsheet formulas, your team can ask plain-English questions — like "What is our weighted pipeline value for deals closing this month?" — and get instant, beautifully formatted charts, tables, and insights.
With atSpark, you get governed, conversational analytics that empower your sales, marketing, and finance teams to collaborate without needing engineering help.
Ready to bring absolute clarity to your revenue forecasting? Learn more about how a Weighted Pipeline can transform your sales tracking and help you scale with confidence.