Why Sales Funnel Analytics Is the Key to Understanding Your Revenue
Sales funnel analytics is the process of measuring and analyzing how prospects move through each stage of your buying journey — from first touch to closed deal — so you can see exactly where revenue is won or lost.
If you're a RevOps or finance lead trying to answer questions like "Why did we miss quota this quarter?" or "Where are deals stalling?", this is the discipline that gives you those answers without waiting on a data team.
Quick answer — what sales funnel analytics covers:
| What you measure | Why it matters |
|---|---|
| Stage-by-stage conversion rates | Shows where prospects drop off |
| Average time in each stage | Reveals where deals stall |
| Lead-to-customer rate | Measures top-of-funnel quality |
| Revenue attribution | Links marketing spend to closed revenue |
| Win rate and deal velocity | Tracks overall funnel health and speed |
Most teams already have the data. The problem is it's scattered across a CRM, a marketing platform, a billing system, and three spreadsheets. Without a unified view, you're always looking backward — reacting to problems instead of catching them early.
One media performance director put it well: before centralizing their data, their team was always looking at what had already happened. With proper funnel intelligence, they could finally see what was coming next.
That shift — from reactive reporting to proactive insight — is exactly what mastering sales funnel analytics makes possible.
The Core Foundations of Sales Funnel Analytics
To truly master sales funnel analytics, we must first establish a solid data foundation. This begins with robust conversion tracking and seamless data integration. When we talk about tracking conversions, we are not just looking at the final checkout button. We are mapping the entire sequence of micro-conversions — from an initial ad click, to a whitepaper download, to a product demo, and finally to a recurring subscription.
Without unifying your marketing, CRM, and billing data into a single source of truth, your analytics will remain fractured. You might see a spike in website sign-ups in your marketing dashboard, but fail to realize those leads are stalling before they reach a sales rep. True conversion tracking requires connecting front-end user actions directly to back-end financial metrics.
Understanding this journey requires distinguishing two foundational concepts: the sales funnel and the sales pipeline.
Why Sales Funnel Analytics Matters for Modern Revenue Teams
For modern revenue operations, guessing is no longer an option. Relying on gut feelings to drive revenue growth is a quick way to miss targets. By leveraging deep funnel insights, we can make highly informed, data-driven decisions that directly impact saas growth metrics.
When your data is unified, the business impact is immediate. For instance, industry data shows that organizations utilizing automated marketing intelligence platforms see an average increase in return on advertising spend (ROAS) of 26% over their first two years. Furthermore, centralizing this data doesn't just improve performance — it dramatically cuts costs. Some enterprise brands have successfully reduced their data warehouse costs by up to 75% simply by automating their data pipelines and eliminating manual engineering overhead. Similarly, optimizing these conversion paths has been shown to reduce average cost per lead by 20%.
The Difference Between Funnel Analytics and Pipeline Analytics
While the terms are often used interchangeably, there is a distinct difference between funnel analytics and pipeline analytics.
- Funnel Analytics focuses on the buyer journey. It is customer-centric, mapping how a broad audience of prospects narrows down to a group of paying customers. It measures conversion rates, drop-off points, and user behavior across various touchpoints.
- Pipeline Analytics focuses on deal tracking and sales activities. It is sales-rep-centric, measuring the progress of active opportunities, forecasting revenue, and evaluating pipeline coverage to ensure there are enough active deals to meet sales quotas.
In short, funnel analytics tells you how your customers buy, while pipeline analytics tells you how your sales reps sell.
Mapping the Funnel: Stages, Metrics, and Key Performance Indicators
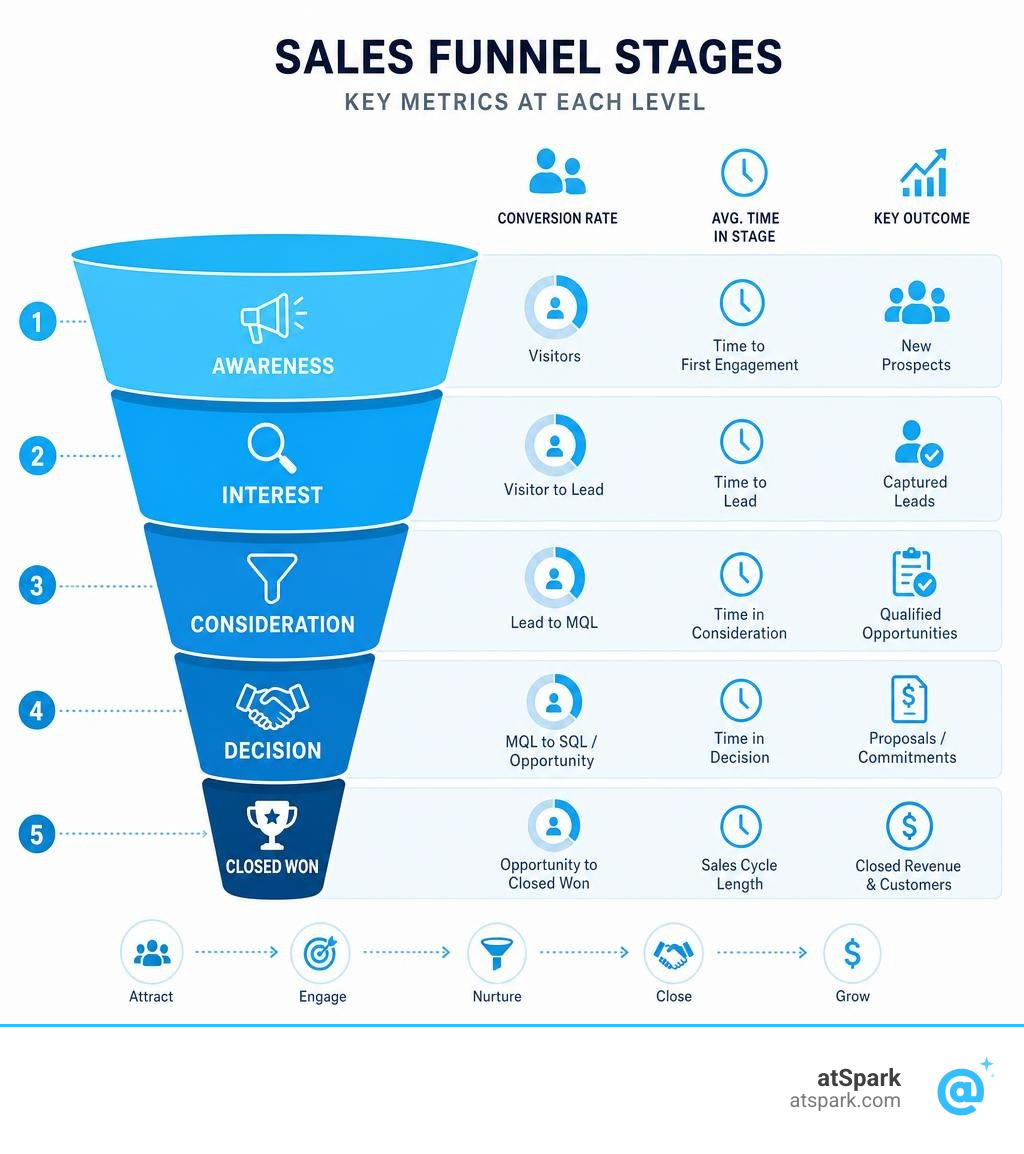
To optimize your revenue engine, you must break down your funnel into distinct operational stages. A healthy sales process relies on tracking the movement of prospects through every deal stage while monitoring overall sales velocity and the team's win rate.

A comprehensive analytics strategy tracks metrics across the three main sections of the funnel:
Top-of-Funnel (ToFU) Metrics and Lead Qualification
The top of the funnel is all about traffic acquisition and lead generation. However, filling the funnel with low-quality traffic is counterproductive. To protect your sales team's time, we must implement rigorous lead scoring and qualification frameworks (such as BANT or MEDDIC) early in the process.
Key ToFU metrics to monitor include:
- Unique Visitors & Traffic Sources: Identifying which channels drive the highest-intent visitors.
- Lead Conversion Rate: The percentage of visitors who become marketing qualified leads (MQLs).
- Sales Activity Level: Tracking initial outreach efforts. To see how to structure these insights, you can explore the only sales activity report examples youll ever need to benchmark your team's sales activity.
By setting strict entry criteria, we prevent sales reps from populating the pipeline with unqualified deals, keeping the funnel healthy and focused.
Middle-of-Funnel (MoFU) Metrics and Deal Progression
Once a lead is qualified, they enter the middle of the funnel, where the primary objective is nurturing and deal progression. This is where deals are most likely to stall. To prevent stagnation, we must track the average deal age and evaluate the deal win probability at each step.
Critical MoFU metrics include:
- MQL to SQL Conversion Rate: How many marketing leads are accepted by sales.
- Time in Stage: Measuring the exact number of days a prospect spends in a specific phase.
- Stagnation Rate: Identifying deals that have exceeded average time thresholds without any activity.
If a deal sits in the "demo completed" stage for twice the average duration, its win probability drops significantly. Tracking these metrics allows you to intervene before the lead goes cold.
Bottom-of-Funnel (BoFU) Metrics and Revenue Attribution
The bottom of the funnel is where decisions are made and revenue is realized. Here, we analyze final conversion rates, overall bookings, and average deal size to determine the ultimate success of our campaigns.
Key BoFU and saas performance metrics include:
- SQL to Closed-Won Rate: The percentage of sales-qualified leads that sign a contract.
- Customer Acquisition Cost (CAC) & LTV: Balancing what we spend to acquire a customer against their lifetime value.
- Revenue Attribution: Linking closed revenue back to the specific marketing campaigns or touchpoints that initiated the journey.
Real-world optimization examples show how small changes at this stage yield massive results. For instance, in subscription models, offering a low-cost paid trial instead of a completely free trial can make users 25% more likely to purchase a full subscription at the end of the trial. In e-commerce, offering free shipping above a specific threshold has been shown to increase average order sizes by 15%. Even simple landing page optimizations, like refreshing a core recipe or features page with a prominent call-to-action, have successfully boosted conversion rates by 5.5%.
How to Visualize and Interpret Funnel Data
Data is only as useful as your ability to interpret it. Visualizing your sales funnel allows you to quickly run a drop-off analysis and identify exactly where prospects are abandoning the journey.
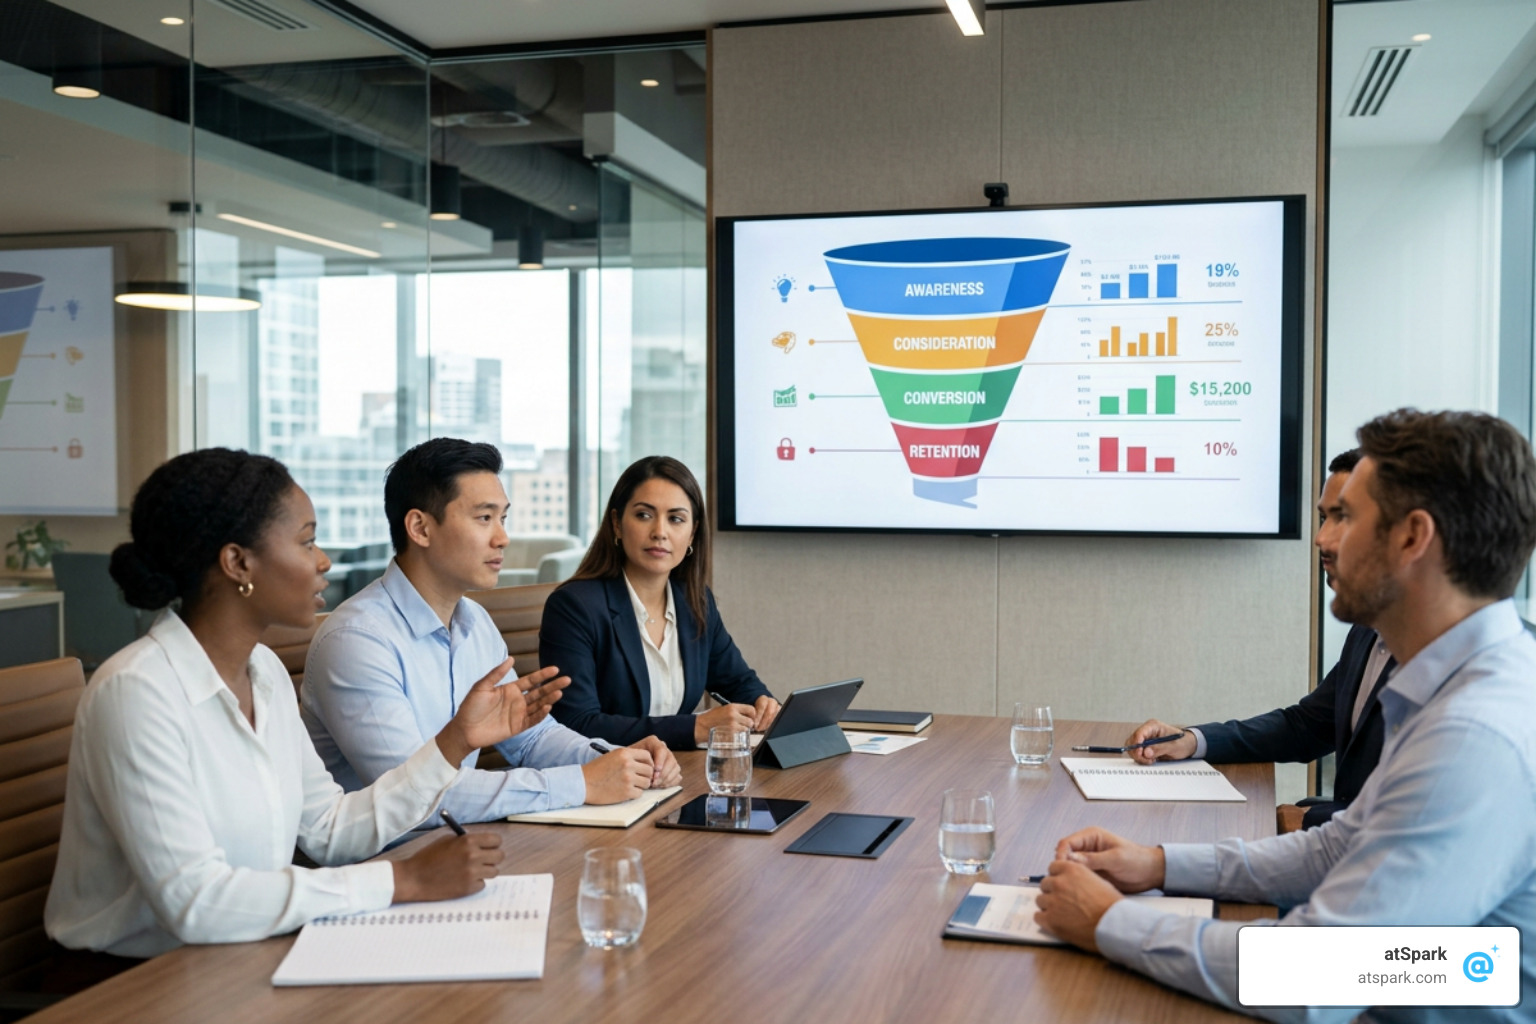
When building these visualizations, you must choose between an "open" and a "closed" funnel model.
| Metric / Feature | Open Funnel | Closed Funnel |
|---|---|---|
| Entry Logic | Users can enter at any stage of the funnel | Users must enter strictly at the first stage |
| User Tracking | Captures non-linear journeys and direct purchases | Tracks linear progression step-by-step |
| Drop-off Accuracy | Broad view of overall interactions | Precise view of step-by-step friction |
| Best Use Case | Content sites, multi-entry web apps | Strict checkout flows, structured onboarding |
To get started with setting up these visual representations, you can learn how to Create a custom funnel report to track these user actions in your analytics suite.
Building Custom Reports for Sales Funnel Analytics
Creating tailored reports is essential for mapping unique user journeys. When configuring a custom GA4 Funnel exploration, you can define up to 10 distinct steps.
When building these reports, keep these best practices in mind:
- Use Segment Comparisons: Apply up to 4 segments (such as organic traffic vs. paid ads) to compare how different audiences move through the same steps.
- Analyze Next Actions: Look at the "Top 5 Next Actions" to see where users go when they abandon a step.
- Account for API Limitations: If you are programmatically generating reports via the Google Analytics Data API, the feature is in its early stages (v1alpha) and defaults to showing only the first 5 distinct values of a breakdown dimension unless customized.
Identifying and Fixing Funnel Bottlenecks
Once your reports are live, you will inevitably find friction points. A bottleneck is any stage where the drop-off rate is significantly higher than the industry average. Once identified, fixing these bottlenecks requires targeted optimization.
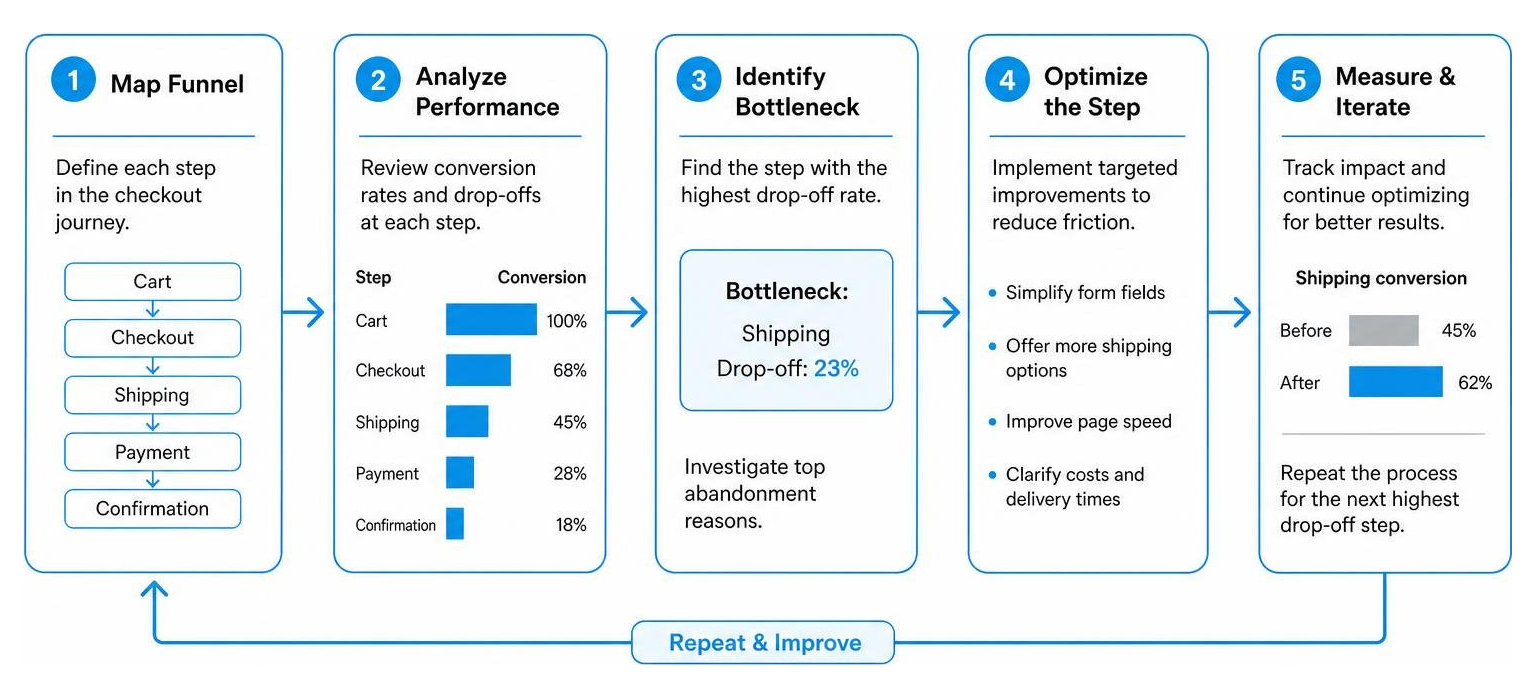
Optimizing these stages can lead to immediate revenue gains. Case studies show that simplifying checkout flows and removing unnecessary fields can instantly boost conversion rates by 2 to 2.5 times. In other scenarios, product-led teams have doubled user retention simply by improving the discoverability of core features (like a browser extension) to make onboarding seamless.
For a step-by-step strategy on converting stuck deals, read our guide on how to turn your weighted pipeline into real sales conversions.
Advanced Optimization: Necessary Condition Analysis (NCA) vs. Sufficiency Logic
When optimizing a weighted pipeline, most revenue teams rely on traditional predictive analytics. However, to achieve highly accurate forecasting, we must understand the difference between sufficiency logic and necessity logic. To master this, we recommend reviewing the ultimate guide to weighted pipeline sales forecasting and analytics.
Understanding Sufficiency-Based Funnel Analysis
Traditional sales analytics operate on sufficiency logic. This approach uses regression models to ask: "What activities, on average, increase the probability of closing a deal?"
When building a sales forecast, sufficiency logic calculates that if a prospect attends a demo, they have a 40% chance of converting. While useful for high-level planning, this method only looks at average effects. It fails to identify the absolute "must-haves" without which a sale is mathematically impossible.
Applying Necessary Condition Analysis (NCA) to Prevent Failures
Necessary Condition Analysis (NCA) flips this logic by focusing on necessity. Instead of asking what helps make a sale, NCA identifies the absolute constraints — the minimum thresholds that must be met to avoid failure.
NCA uses "ceiling lines" on scatter plots to separate the possible outcome space from the impossible zone. It generates bottleneck tables showing exact operational requirements. For example, NCA might reveal that to achieve a sale size of $50,000, a prospect must have visited the pricing page at least once and had a response time from sales of under 24 hours. If those conditions are not met, the probability of closing the deal is exactly zero.
By combining NCA with traditional win-loss analysis, revenue teams can stop chasing dead deals and ensure every active opportunity meets the necessary criteria for success.
Frequently Asked Questions about Funnel Optimization
When teams begin tracking their saas metrics to track, several common queries consistently arise. Here are quick, actionable answers to help guide your optimization efforts.
What is the difference between an open and a closed funnel?
In an open funnel, users can enter at any stage of the journey, and their progression is counted regardless of where they started. In a closed funnel, users must enter strictly at the first step to be included in the metrics. For a detailed breakdown of how to build and track these flows globally, refer to the documentation on Funnels (Global Analytics) - FunnelKit.
How do you calculate average days in a funnel stage?
To find the average duration a lead spends in a specific stage, divide the total number of days spent in that stage by all leads within a given timeframe by the total number of leads that progressed through that stage. Monitoring this metric is crucial for keeping your sales cycle length under control and identifying where deals are stagnating.
What is a healthy stage-over-stage conversion rate?
According to industry benchmarks, a healthy, well-optimized sales funnel generally exhibits a steady stage-over-stage conversion rate of 15% to 30% at each step. If your conversion rate drops below 15% between any two stages, it indicates a critical bottleneck that requires immediate attention. For deeper insights into benchmarking these stages, check out our guide on saas pipeline metrics that actually matter for growth.
Conclusion
As we look forward through 2026, the landscape of sales funnel analytics is shifting rapidly toward automated data unification and AI-driven decision-making. Relying on manually built spreadsheets or waiting weeks for data engineering teams to write custom SQL queries is no longer viable.
The future of revenue operations belongs to teams that can access real-time, governed insights instantly. By unifying your billing, CRM, and subscription data, you can eliminate reporting blind spots and get a complete, single source of truth for your entire customer journey.
To learn more about how artificial intelligence is transforming modern sales tracking, explore our deep dive on what is ai revenue analytics.
If you are ready to stop guessing and start querying your data in plain English — without writing a single line of SQL — discover how you can ask your data anything without sql.
Ready to simplify your revenue operations and scale your growth? Optimize your revenue operations with atSpark today.