Why Most SaaS Revenue Forecasts Are Wrong — and How to Fix Them
Weighted pipeline SaaS metrics are the most reliable way to forecast revenue accurately — and most teams aren't using them correctly.
Here's the quick answer if you need it fast:
| Metric | What It Means |
|---|---|
| Raw pipeline | Total value of all open deals, regardless of close probability |
| Weighted pipeline | Each deal's value multiplied by its stage-based close probability |
| Formula | Weighted Pipeline = Σ (Deal Value × Stage Probability) |
| Why it matters | Removes false optimism and gives you a realistic revenue estimate |
| Key benefit | 25-30% better forecast accuracy vs. unweighted pipeline |
If your team is looking at a $5M pipeline and expecting $5M in revenue, you're going to miss. Badly.
The problem is that most sales pipelines are aspirational by nature. Every deal gets counted at full value, even the one that's been sitting in "Proposal" for four months with no activity. That's not a forecast — that's wishful thinking.
Research shows that 67% of sales organizations overestimate their conversion rates. And uncalibrated pipelines typically erode 20-40% between initial commit and final close. Meanwhile, fewer than 25% of sales teams hit forecast accuracy above 75%.
For a Finance or RevOps lead, this isn't just a sales problem. Inaccurate pipeline data flows directly into headcount decisions, board reporting, and investor conversations — creating downstream chaos that's hard to unwind.
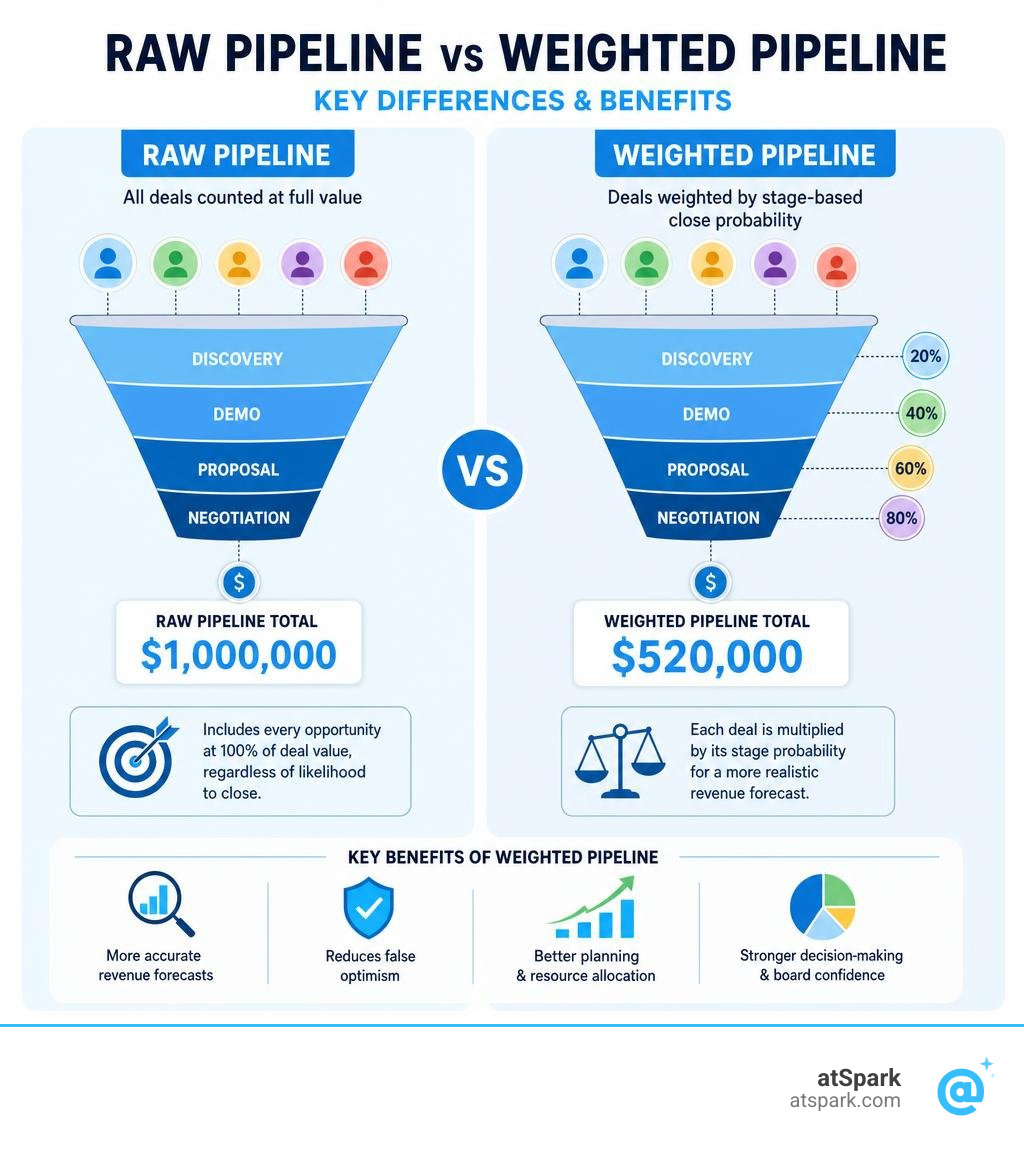
Weighted pipeline changes the equation. Instead of counting every deal at face value, it discounts each opportunity based on where it sits in the sales cycle and how likely deals at that stage actually close. The result is a number you can plan around.
Mastering Weighted Pipeline SaaS Metrics for Accurate Forecasting
To build a predictable revenue engine in 2026, we have to move past the era of treating every dollar in our CRM as equal. When we look at our sales pipeline, we are looking at a mix of high-intent buyers ready to sign and early-stage prospects who barely remember booking a demo. Combining these into a single raw total is like planning a vacation budget based on the lottery tickets you bought this morning.
This is where a weighted pipeline comes in. It translates the raw, chaotic energy of a sales pipeline into a grounded, operational revenue projection.
What is a Weighted Pipeline?
A weighted pipeline is a sales forecasting methodology that adjusts the value of each open opportunity by its historical likelihood of closing. Instead of assuming a 100% success rate for every active deal, we assign a specific deal win probability to each stage of our sales cycle.
As a deal moves through successive sales cycle stages—from initial discovery to technical evaluation and finally verbal agreement—the probability of winning that deal increases. By multiplying the total contract value of each deal by its corresponding stage probability, we get a highly realistic picture of expected recurring revenue. This is one of the most critical saas metrics to track because it bridges the gap between sales activity and financial forecasting.
Raw Pipeline vs. Weighted Pipeline
The difference between raw and weighted pipelines is the difference between aspiration and reality.
- Raw pipeline (or unweighted pipeline) is simply the sum of all active opportunities. If you have ten enterprise deals worth $100,000 each, your raw pipeline is $1,000,000.
- Weighted pipeline applies a reality check. If those ten deals are all in the early "Discovery" phase—which historically has a 10% conversion rate—your weighted pipeline is actually $100,000.
Relying on raw pipeline values for financial planning is a primary driver of forecast misses. It creates a false sense of security, leading to over-hiring and aggressive spending. When those early-stage deals inevitably slip or convert at normal historical rates, the organization is left with a massive revenue shortfall.
To see how this works in practice, let's look at how a typical mid-market SaaS company evaluates its pipeline across different stages:
| Sales Stage | Raw Deal Value | Historical Stage Win Rate | Weighted Pipeline Value |
|---|---|---|---|
| Discovery | $300,000 | 10% | $30,000 |
| Demo / Scoping | $250,000 | 25% | $62,500 |
| Proposal | $150,000 | 50% | $75,000 |
| Negotiation / Contract | $100,000 | 80% | $80,000 |
| Total | $800,000 | — | $247,500 |
By tracking these saas business metrics, the executive team knows that while they have $800,000 in raw opportunities, they can realistically forecast $247,500 in closed-won revenue from this cohort.
Connecting Weighted Pipeline SaaS Metrics to Other Key Indicators
Weighted pipeline metrics do not live in a vacuum. To maximize their utility, we must connect them to other foundational SaaS indicators:
- Win Rate: Your overall win rate is a lagging indicator, but your stage-by-stage win rates are the precise fuel that powers your weighted pipeline. If your overall win rate drops due to shifting market dynamics, your stage probabilities must be calibrated downward to keep forecasts accurate.
- Sales Cycle Length: How long a deal takes to close directly impacts pipeline hygiene. A deal that has been sitting in the "Proposal" stage for twice your average sales cycle length is mathematically less likely to close, even if your standard stage probability says otherwise.
- Pipeline Coverage: Traditionally, SaaS companies look for a 3x to 4x raw pipeline coverage ratio relative to their sales quota. However, calculating Weighted Pipeline Coverage | Revenue Analytics Glossary | ORM gives a much more precise view. When you divide your total weighted pipeline by your sales quota, a ratio of 1.5x to 2.0x indicates a healthy, achievable target. Anything below 1.0x means you are mathematically unlikely to hit your quota based on historical performance.
How to Calculate Weighted Pipeline Value and Stage Probabilities
Calculating your weighted pipeline value is mathematically straightforward, but its accuracy depends entirely on the quality of the data you feed into the calculation.
Calculating Weighted Pipeline SaaS Metrics: The Step-by-Step Formula
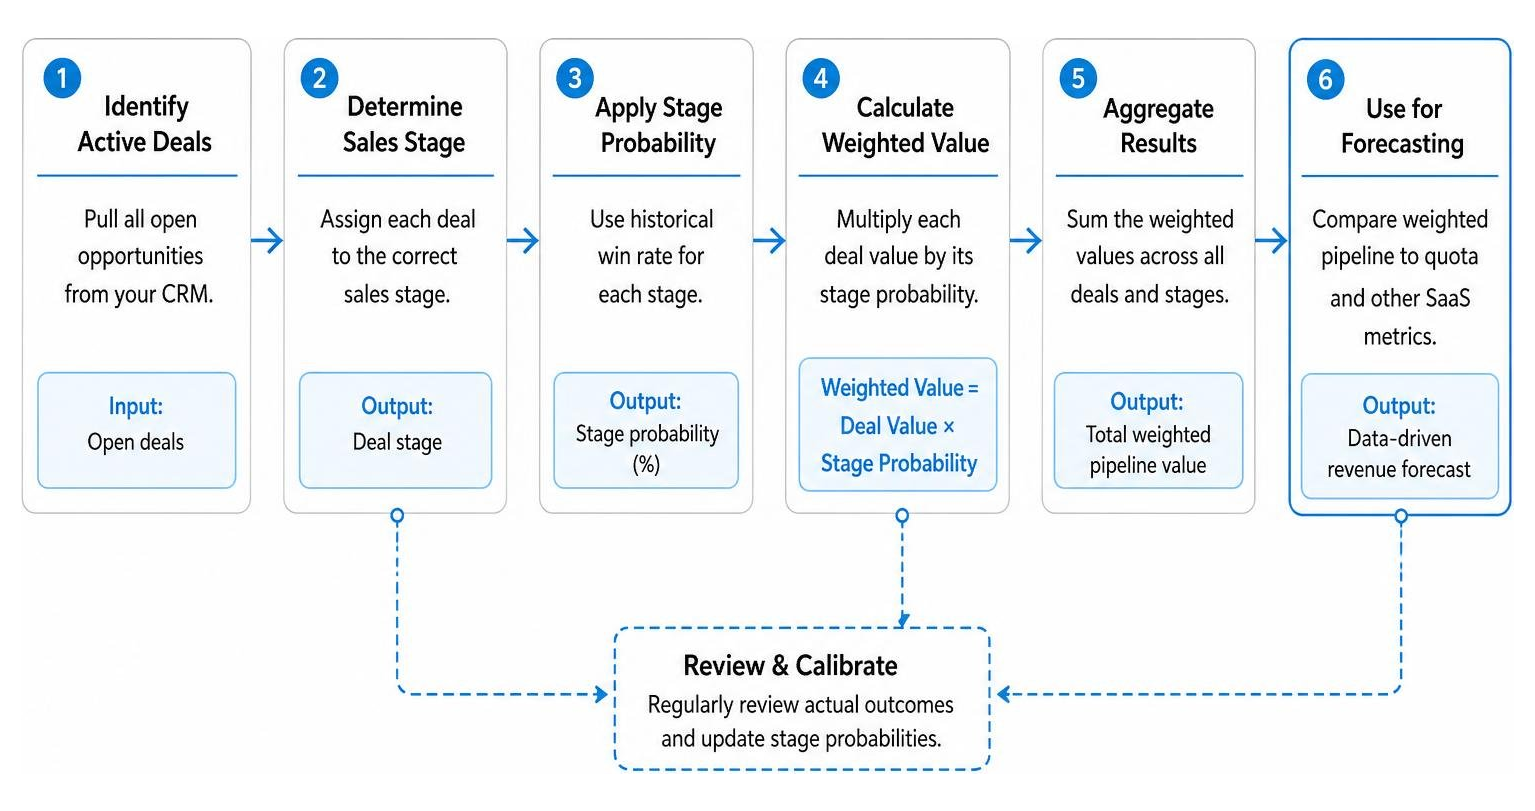
To calculate your total weighted pipeline value, you must evaluate each active opportunity in your CRM, apply its stage-specific probability, and aggregate the results.
The basic formula is:
$$\text{Weighted Deal Value} = \text{Total Deal Value} \times \text{Stage Probability}$$
To find your total weighted pipeline, you sum these individual values across all active deals:
$$\text{Total Weighted Pipeline} = \sum (\text{Opportunity Value} \times \text{Stage Probability})$$
Let's look at a concrete example. Imagine our SaaS company has three active enterprise opportunities:
- Deal A: $100,000 in the Discovery Stage (10% probability) = $10,000 weighted value
- Deal B: $50,000 in the Proposal Stage (50% probability) = $25,000 weighted value
- Deal C: $200,000 in the Negotiation Stage (80% probability) = $160,000 weighted value
While the unweighted pipeline is $350,000, our true operational sales forecast is $195,000. For a deeper dive into establishing these structures, you can check out this Weighted Pipeline Definition: The Complete B2B Guide.
Calibrating Stage Probabilities with Historical Data
The biggest mistake we see teams make is using the default stage probabilities that come out of the box with their CRM (such as 10%, 25%, 50%, 75%, 90%). These defaults are arbitrary guesses that do not reflect your actual sales motion, buyer behavior, or market segment.
To build a reliable forecasting model, you must calculate your Stage Win Rate using your own historical CRM data.
Here is how to do it:
- Pull 4 to 6 quarters of closed-won and closed-lost opportunity data.
- For each sales stage, calculate how many opportunities that entered that stage eventually ended up as "Closed Won."
- Divide the number of won deals by the total number of deals that passed through that stage to establish your actual conversion rate.
Additionally, you should segment your probabilities by deal type (e.g., new business vs. expansion vs. renewals) and customer segment (SMB vs. Enterprise). Enterprise deals typically have longer sales cycles and lower conversion rates at early stages compared to SMB deals. Deriving your probabilities from actual historical data—rather than industry averages—can improve your forecast accuracy by up to 40%. This rigorous calibration is what transforms basic numbers into high-impact saas growth metrics.
Strategic Benefits and Common Pitfalls of Weighted Pipeline Implementation
When implemented correctly, weighted pipeline SaaS metrics transform forecasting from a stressful guessing game into an objective, data-driven science. However, the system is only as good as the discipline of the team maintaining it.
Improving Resource Allocation and Sales Management
Using weighted pipeline metrics provides immediate operational benefits for both sales managers and executive leadership:
- Smarter Headcount Planning: Finance teams can confidently plan customer success and engineering hiring based on realistic, weighted revenue projections rather than raw sales optimism.
- Targeted Sales Coaching: Managers can easily spot reps who have a massive raw pipeline but a very low weighted pipeline, indicating their deals are getting stuck in early stages.
- Efficient Deal Prioritization: Instead of chasing a massive, low-probability enterprise deal, reps can focus their energy on smaller, high-probability opportunities that are closer to the finish line.
- Increased Sales Productivity: Organizations utilizing weighted pipeline methodologies see a 15% increase in sales productivity because reps spend less time chasing dead leads and more time on high-intent accounts. This is a classic example of using saas kpi examples to drive real-world behavioral changes.
Enhancing Investor Relations and Revenue Predictability
For SaaS executives, predictable growth is the ultimate currency. Companies with consistent, accurate forecasting command higher valuations from investors because they present far less risk.
As detailed in this guide on Understanding Weighted Pipeline: A Critical Metric for SaaS Success, having a clear grasp of your weighted pipeline allows you to run multiple forecasting scenarios (conservative, expected, and optimistic). This level of preparation builds massive board confidence. When you show up to a quarterly board meeting and hit your revenue targets within a 5% margin, you prove that you have complete control over your go-to-market engine. It elevates your reporting from basic updates to highly strategic important saas metrics analysis.
Overly Optimistic Probabilities and Ignoring Deal Age
The most common pitfall in pipeline management is failing to account for deal age.
If your historical data says that a deal in the "Proposal" stage has a 50% chance of closing, that probability is only valid if the deal is moving at a normal pace. If your average sales cycle length is 60 days, and a deal has been sitting in the proposal stage for 90 days, its actual probability of closing is drastically lower.
In fact, deals that exceed their average stage duration by 50% are 30% less likely to close than those moving at a normal pace. If your sales reps are not maintaining clean close dates, or if they are leaving stale deals in active stages with no customer interaction for over 14 days, your weighted pipeline will be heavily inflated.
CRM Data Decay and Lack of Segmentation
Another silent killer of forecast accuracy is CRM data decay. On average, B2B data decays at a rate of roughly 34% per year as prospects change jobs, companies shift budgets, and market conditions evolve.
Furthermore, failing to segment your pipeline by source intent can skew your numbers. For instance, a sudden spike in top-of-funnel demo requests might look fantastic on paper, but if those leads lack real buying intent, they will quickly stall out in early stages. If you apply your standard, unsegmented stage probabilities to these low-intent leads, your weighted pipeline will show a massive spike in expected revenue that will never actually materialize.
Frequently Asked Questions about SaaS Pipeline Metrics
What is a Good Weighted Pipeline Coverage Ratio for SaaS?
For a healthy SaaS business, a weighted pipeline coverage ratio of 1.5x to 2.0x relative to your sales quota is the industry standard.
However, this benchmark varies significantly by sales motion:
- SMB SaaS (short sales cycles, high volume): 1.5x weighted coverage is usually sufficient.
- Mid-Market SaaS (60-90 day cycles): 2.0x to 2.5x weighted coverage is recommended.
- Enterprise SaaS (long, complex sales cycles): 3.0x to 4.0x weighted coverage may be required to account for the higher risk of deal slippage.
For early-stage startups, keeping an eye on these ratios is vital for survival, as outlined in the Weighted Pipeline | RevOps Docs for Startups framework.
How Often Should We Update Our Stage Probabilities?
We recommend recalibrating your stage probabilities quarterly using a rolling 90-day average of your actual conversion data. This ensures your weighted pipeline model automatically adjusts to changing economic conditions, seasonal buying patterns, and shifts in your product-market fit.
SaaS companies that actively adjusted their weighted pipeline models for changing economic conditions maintained 22% higher forecast accuracy than those that relied on static, historical averages.
How Does Deal Age Affect Weighted Pipeline Accuracy?
Deal age is the ultimate truth-teller in pipeline management. As a deal lingers past your average sales cycle length, its win rate drops precipitously.
To maintain weighted pipeline accuracy, you must implement strict pipeline hygiene rules:
- Automatically discount the probability of any deal that has exceeded its average stage duration by more than 50%.
- Flag any deal with no recorded activity (emails, calls, meetings) in the last 14 days.
- Require manager approval to extend a deal's close date more than once in a quarter.
Conclusion: Get Real-Time Pipeline Clarity with atSpark
Building a reliable, data-driven forecasting model doesn't have to mean spending dozens of hours every week wrangling complex spreadsheets or building custom SQL queries in your CRM.
At atSpark, we believe that understanding your pipeline should be as simple as having a conversation. Our AI-powered analytics platform unifies your billing, CRM, and subscription data into a single source of truth. Instead of fighting with complex dashboards, you can ask atSpark plain-English questions like:
- "What is our weighted pipeline value for enterprise deals closing this quarter?"
- "Show me all deals in the proposal stage with no activity in the last 14 days."
- "What is our current weighted pipeline coverage ratio compared to our Q3 quota?"
Within seconds, atSpark generates clean, accurate charts, tables, and actionable insights — no engineering or SQL required.
Ready to stop guessing and start forecasting with absolute confidence? Learn more about how we help SaaS teams unlock predictable growth by exploring our weighted pipeline resources and see how easy revenue predictability can be.