SaaS growth metrics can make your dashboard look reassuring right up until cash gets tight, churn creeps up, or a busy sales month turns out to be much less profitable than it looked on paper. The numbers that matter are the ones that help you decide what to fix next. In plain English, SaaS growth metrics are the recurring revenue, retention, acquisition, and efficiency measurements that show whether your business is growing in a way that can actually last.
Early on, a clean graph going up feels like enough. Then Monday morning hits, somebody asks why MRR is rising while net revenue is flat, and suddenly the difference between a healthy business and a leaky one matters a lot. This guide covers the 10 SaaS growth metrics that deserve your attention, how to calculate them, how they connect, and how to use them without getting buried in spreadsheet tabs.
A quick map before getting into the details:
- what each metric means
- how to calculate it
- what it helps you diagnose
- where founders and teams get it wrong
- which metrics matter most by stage
- how to turn the numbers into a usable dashboard
What SaaS Growth Metrics Actually Tell You
SaaS growth metrics are not just scorekeeping. They tell you where growth is coming from, what it costs, how long customers stay, and whether existing accounts are expanding or quietly slipping away. That matters because recurring revenue can look stable on the surface while the engine underneath is doing something much less comfortable, like buying growth at an unsustainable cost or replacing churned customers every month just to stand still.
A useful dashboard does one job: it helps you make better decisions faster. If a number looks nice but does not change what you do next, it probably belongs in the vanity pile.
Growth metrics vs. vanity metrics
Here’s the thing: signups feel exciting, but retained paying customers pay the bills. Website traffic, trial starts, social followers, webinar registrations, and app downloads can all move in the right direction while the business itself barely improves.
A simple example makes the difference obvious. If signups double but trial-to-paid conversion drops and month-two churn spikes, you do not have healthier growth. You have a noisier top of funnel. Real growth metrics force that honesty. They focus on outcomes tied to revenue quality, customer behavior, and efficiency.
Why one metric never tells the full story
No single metric can carry the whole story. MRR without churn can flatter a business that is constantly replacing lost customers. CAC without payback can hide a cash problem. LTV without realistic retention inputs can become fantasy dressed up as strategy.
That is why this guide works as a system, not a random list. These metrics are connected. Acquisition affects CAC. Retention shapes LTV. Expansion changes NRR. Revenue trends only make sense when you can see what is lifting them and what is quietly dragging them down.
How To Use This List Without Drowning In Spreadsheets
Most SaaS teams do not need a 47-tab reporting monster. You need a small set of consistent metrics, tracked on a clear cadence, tied to real decisions. That means sorting metrics by what stage your company is in, which team can influence them, and what kind of choice each metric supports.
At an early stage, retention and early recurring revenue matter more than polished forecasting. As the business scales, acquisition efficiency and payback start to matter a lot more. Later, segmentation, expansion, and predictability take center stage.
The three jobs your metrics should do
Your metrics should help you spot problems early. If churn jumps, CAC stretches, or expansion slows, you want to see it before it becomes a board-slide surprise.
Your metrics should also help you prioritize growth bets. Better onboarding, pricing changes, sales headcount, channel experiments, packaging updates, and customer success programs all compete for time and money. A good metric set helps you decide where effort has the best chance of paying back.
And yes, metrics should help you forecast with more confidence. Not perfectly. Just better. Clean recurring revenue and retention numbers make it much easier to estimate what next quarter might look like without pretending the future is more certain than it is.
A quick note on timing, definitions, and consistency
Consistency matters more than cleverness. If you change formulas every month, trend lines stop meaning anything. Pick a definition, write it down, and keep it stable unless there is a strong reason to change it.
Common mistakes show up fast here. Monthly contracts and annual contracts get mixed without converting annual revenue into monthly equivalents. Trial users get counted as customers. One-time setup fees sneak into recurring revenue. Sales reports one version of CAC while finance reports another. If you want cleaner benchmarks and better planning, keeping your core business numbers aligned is worth the boring setup work.
1. Monthly Recurring Revenue (MRR)
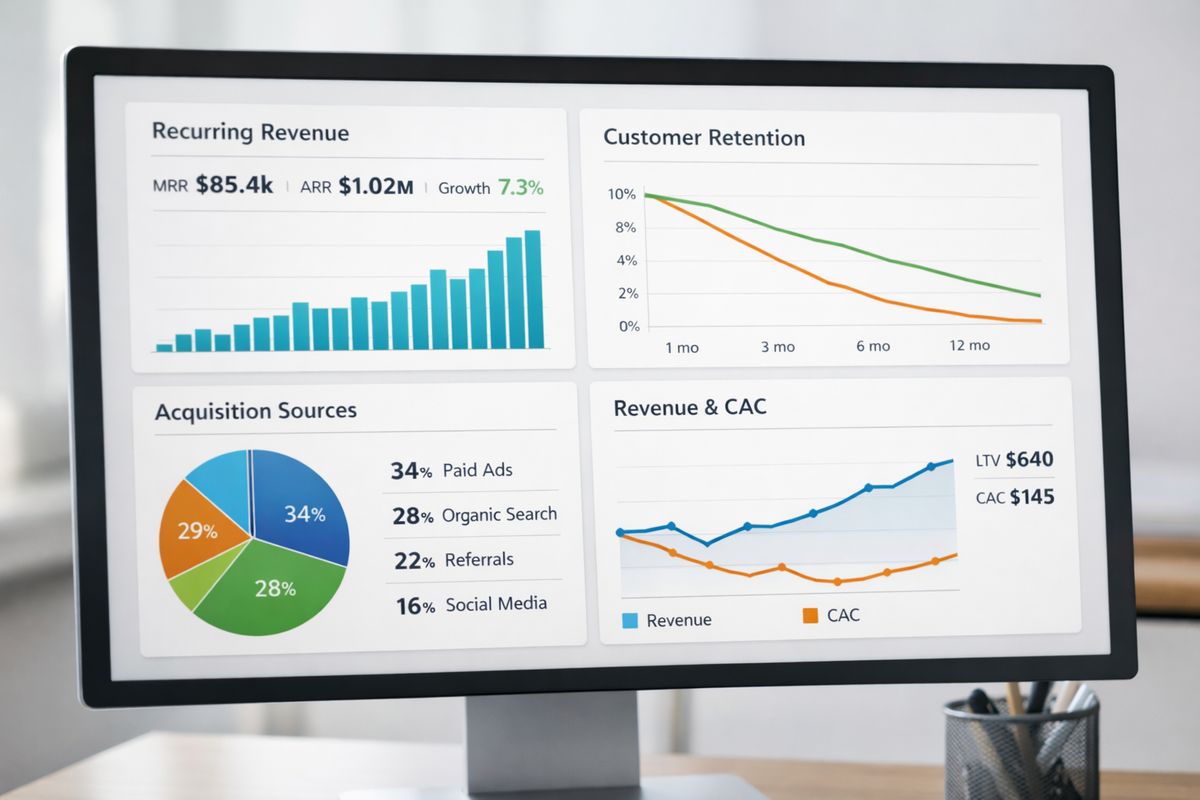
MRR is the monthly value of your recurring subscription revenue. It is the clearest heartbeat for most SaaS businesses because it tells you what recurring revenue your customer base is generating each month, independent of one-time payments.
The key word is recurring. Setup fees, implementation work, training packages, and other one-off charges do not belong here. If you mix them in, MRR turns into a feel-good number instead of a real operating metric.
How to calculate MRR
The basic formula is simple: sum up all monthly recurring subscription revenue from active customers.
If a customer pays $200 per month, that adds $200 to MRR. If another customer pays $2,400 annually, that adds $200 per month to MRR. Annual plans should be converted into monthly equivalents so your reporting stays comparable. Upgrades increase MRR, downgrades reduce it, and cancellations remove the recurring amount entirely.
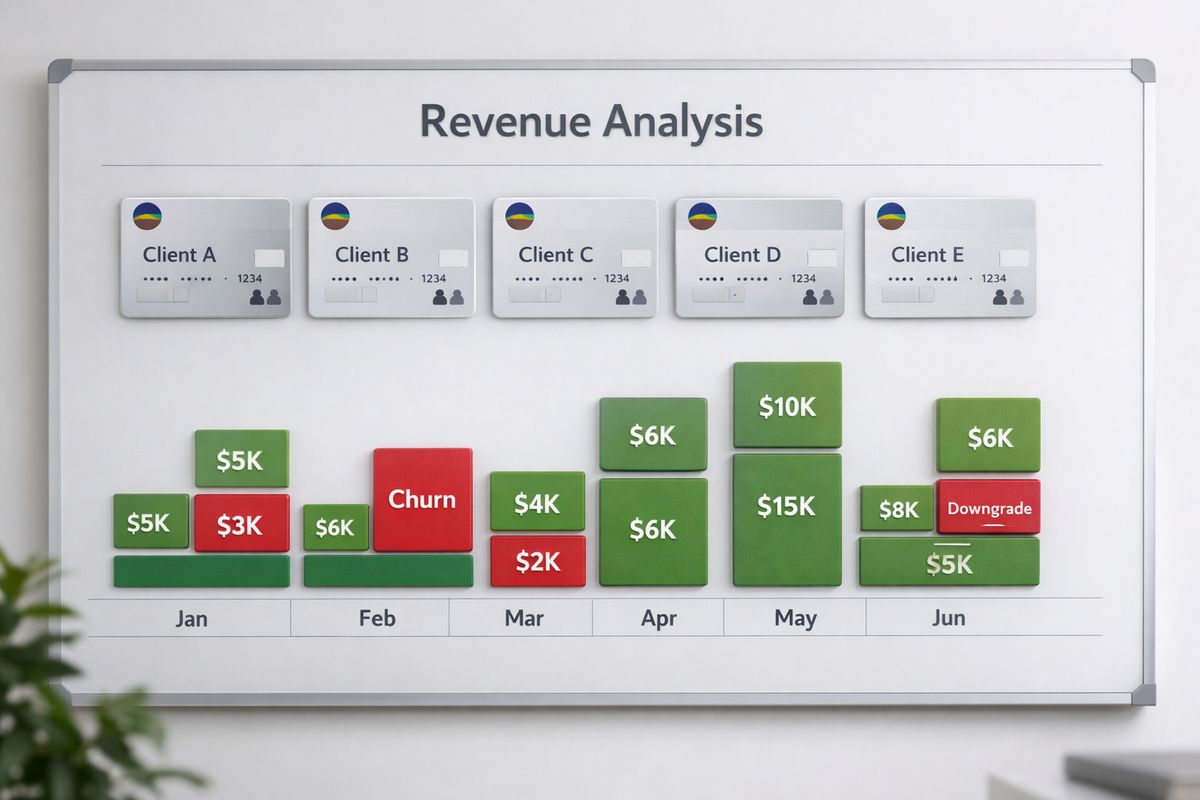
The trick is to capture changes in the month they happen. If an account moves from $100 to $300, the additional $200 is expansion MRR. If an account drops from $300 to $180, the lost $120 is contraction MRR.
The MRR components worth tracking separately
Looking at one total MRR number is not enough. Break it into new MRR, expansion MRR, contraction MRR, reactivation MRR, and churned MRR. Once you do that, growth stops being vague.
Suppose total MRR rose by $12,000. Great. But was that driven by $20,000 in new sales and $8,000 in churn? Or by modest new sales plus strong expansion from existing accounts? Those are very different businesses with very different priorities.
What good MRR analysis looks like
Good MRR analysis looks at trend lines, composition, and context. You want to see whether growth is accelerating, flattening, or depending too heavily on one source. You also want to spot seasonality. August can look quiet in one market and completely normal in another.
MRR becomes much more useful when paired with retention and revenue efficiency metrics. If you want a broader view of the numbers that sit around it, this breakdown of the SaaS numbers worth watching closely helps connect MRR to the rest of the operating picture.

2. Annual Recurring Revenue (ARR)
ARR is your recurring subscription revenue normalized to a yearly value. For companies with longer contracts, bigger accounts, or slower-moving enterprise sales, ARR often becomes the more natural planning metric.
It is especially useful for strategic discussions. Annual plans, contract renewals, and longer sales cycles can make month-to-month fluctuations look more dramatic than they really are. ARR smooths that view out.
ARR vs. MRR: when each one is more useful
MRR is better for fast operating decisions. It is closer to the ground, easier to monitor monthly, and ideal for early-stage or self-serve businesses where things move quickly.
ARR is more useful when planning headcount, discussing performance with investors, or managing a business where contracts tend to be annual and expansion happens in bigger jumps. If your average deal closes with a 12-month commitment, ARR may reflect the reality of the business more clearly.
Common ARR mistakes
One common mistake is annualizing unstable monthly revenue too aggressively. If a young company has a shaky $40,000 MRR base and simply multiplies by 12, the result can sound more solid than it is.
Another mistake is stuffing non-recurring revenue into ARR, like onboarding fees or consulting. That muddies the number immediately. A third mistake is projecting ARR forward without accounting for churn and contraction. A customer book is not frozen in place for 12 months just because the spreadsheet wants it to be.
3. Customer Churn Rate
Customer churn rate is the percentage of customers who cancel during a given period. It is one of the fastest ways to quietly kill growth because a business can close new customers every month and still fail to build momentum if enough existing customers leave.
That is why churn deserves attention even when top-line revenue looks fine. It tells you whether the product keeps earning its place after the initial sale.
How to calculate customer churn rate
The standard formula is:
Customer churn rate = customers lost during the period / customers at the start of the period
If you start the month with 500 customers and lose 25, your monthly customer churn rate is 5%. Use the customer count at the start of the period, not the average during the period, so the number stays consistent.
What churn can reveal about product and onboarding
Churn is not just a customer success issue. It can point to poor fit, weak onboarding, confusing setup, low activation, pricing friction, shaky support, or sales promises that set the wrong expectations.
If churn clusters in the first 30 to 60 days, onboarding and activation are usually the first place to look. If it shows up later, product depth, ongoing value, account expansion path, or support quality may be the bigger problem. Looking into retention signals that show who actually stays can make churn far less mysterious.
When a “normal” churn rate is still a problem
A churn rate can look acceptable in isolation and still cause damage over time. That is the catch. A business with monthly contracts and small-ticket customers will usually have higher churn than one selling annual enterprise deals, but even modest churn compounds like a slow leak under the sink.
Lose 3% of customers each month and the annual impact is much bigger than it feels in one snapshot. Retention problems rarely arrive with fireworks. They usually show up as a quiet drag on growth, cash flow, and morale.
4. Revenue Churn and Net Revenue Retention (NRR)
Customer churn counts logos. Revenue churn counts money. That distinction matters because losing one small account is not the same as losing one big account, and some customers downgrade before leaving entirely.
Net Revenue Retention, or NRR, goes a step further. It measures how recurring revenue from your existing customer base changes over time after accounting for expansion, downgrades, and churn. It is one of the cleanest ways to see whether your installed base is getting more valuable or less.
Gross revenue churn vs. net revenue churn
Gross revenue churn looks only at revenue lost from downgrades and cancellations. It answers a simple question: how much recurring revenue disappeared from existing accounts?
Net revenue churn includes expansion revenue too. If a few customers cancel but several others upgrade enough to more than offset those losses, net revenue churn can be very low or even negative. Negative net revenue churn is a good thing. It means your existing base is expanding faster than it is shrinking.
How to calculate NRR
The basic formula is:
NRR = (starting recurring revenue + expansion revenue - contraction revenue - churned revenue) / starting recurring revenue × 100
If you start the month with $100,000 in recurring revenue, gain $15,000 in expansion, lose $5,000 to downgrades, and lose $7,000 to churn, your NRR is 103%. That means your existing customers generated 3% more revenue than the starting base, even before adding brand-new customers.
Why NRR matters so much in SaaS
NRR matters because it makes growth more efficient. Strong NRR means your business is not forced to rely only on new logo acquisition for revenue growth. Existing customers keep compounding value through renewals, seat growth, feature adoption, or plan upgrades.
That usually points to something healthy underneath: real product value. It also lowers pressure on acquisition. If expansion is doing meaningful work, you can afford to be more selective and disciplined about what you spend to bring in new customers.
5. Customer Acquisition Cost (CAC)
CAC is the cost to acquire a new customer. Simple idea, easy to misuse. The mistake is treating CAC like an ad-spend number when it should reflect the full cost of getting a customer across the line.
If you only count paid media, CAC almost always looks better than reality.
How to calculate CAC correctly
The standard formula is:
CAC = total sales and marketing costs for a period / number of new customers acquired in that period
Total sales and marketing costs should include paid media, salaries, software tools, agencies, commissions, contractor support, content production, and campaign expenses tied to acquisition. In a sales-led motion, excluding headcount makes the number almost useless.
Timing can complicate CAC because spending and customer conversion do not always happen in the same month. For fast-moving self-serve funnels, same-month CAC can be directionally fine. For enterprise sales cycles, lagged CAC analysis often gives a more accurate picture.
CAC by channel, segment, and plan tier
A blended CAC average hides too much. Break it down by channel, customer segment, and plan tier whenever possible. Search ads may look fantastic for one product line and terrible for another. A content program may produce low-cost SMB customers while enterprise deals depend on more expensive outbound and longer sales cycles.
That kind of segmentation helps you stop overfunding expensive channels just because overall growth looks decent.
The catch with blended CAC
Blended CAC is convenient, but it can mask major differences between self-serve and sales-led motions, or between SMB and enterprise pricing. One average number can make a weak channel look okay and a strong one look less attractive than it actually is.
That is why channel-level and segment-level reporting matters. If you are building out a cleaner scoreboard, this guide to metrics that show how your startup is really performing pairs well with CAC work because it pushes you beyond flattering averages.
6. Customer Lifetime Value (LTV)
https://www.youtube.com/watch?v=s8_Vax8VUmM
LTV is the total value a customer brings over the full relationship with your business. In SaaS, it is usually modeled from recurring revenue, gross margin, and retention assumptions.
Useful? Yes. Magical? Not at all. LTV only helps if the assumptions underneath it are realistic.
A simple way to calculate LTV
A straightforward formula is:
LTV = ARPU × gross margin / churn rate
If your average customer brings in $200 per month, your gross margin is 80%, and monthly churn is 5%, LTV would be $3,200. The formula is simple enough to use regularly, but the inputs need care.
Why LTV estimates often go wrong
LTV goes wrong when churn assumptions are too optimistic, when historical data is too thin, or when a young company projects long-term retention from a short stretch of early wins. A few strong months can make future value look bigger than it really is.
Another problem is using customer churn when revenue churn would be more appropriate for a business with strong expansion dynamics. In that case, the customer may stay and spend more over time, which changes the shape of actual value.
How LTV changes with retention and expansion
LTV is not just about pricing. Better onboarding, faster activation, stronger product adoption, and a clearer upgrade path can push LTV up significantly without changing acquisition at all.
That is why retention work compounds so well. A small reduction in churn or a bump in expansion revenue can lift lifetime value much more than squeezing a few extra percentage points out of top-of-funnel conversion.
7. LTV:CAC Ratio
LTV:CAC ratio compares what a customer is worth to what it costs to acquire that customer. It is a fast way to judge whether your acquisition engine is efficient, not just active.
If CAC keeps rising but lifetime value stays flat, growth can look busy while economics worsen underneath. This ratio exposes that tension quickly.
How to interpret the ratio
A low ratio often means you are paying too much to acquire customers, retaining them poorly, or both. A healthy ratio is commonly framed around 3:1, meaning a customer is worth three times the cost to acquire. That is a decent benchmark, though not a law of nature.
A suspiciously high ratio can be a warning too. If the ratio is 8:1, it may mean your channel is underfunded and you could invest more aggressively. Or it may mean your LTV model is overly optimistic. Usually, it is worth checking both before celebrating.
Why this ratio can mislead you
The limitation is timing. LTV:CAC does not show when cash comes back. A great ratio can still hide a slow payback period, which matters a lot if runway is tight.
It also depends heavily on LTV assumptions, which can be shaky in younger companies or in businesses with changing pricing and retention patterns. Treat it as a directional health check, not a standalone verdict.
8. CAC Payback Period
CAC payback period measures how long it takes to earn back acquisition cost from the gross profit generated by a customer. This is one of the most practical SaaS growth metrics because it connects growth directly to cash reality.
A business can have attractive lifetime value and still suffer if getting that value back takes too long.
How to calculate CAC payback
The usual formula is:
CAC payback period = CAC / (average monthly recurring revenue per account × gross margin)
If CAC is $1,200, average monthly recurring revenue per account is $150, and gross margin is 80%, the monthly gross profit is $120. Payback takes 10 months.
That number becomes far more useful when broken out by channel or segment. A 6-month payback channel and an 18-month payback channel should not get the same budget treatment.
Why payback matters more than people think
Payback matters because growth consumes cash before it produces it. The longer the gap, the harder it is to scale safely. This is especially true when hiring sales reps, increasing ad spend, or moving into more expensive channels.
A decent LTV can make things look fine in theory while cash recovery feels painful in practice. On a Tuesday afternoon in a finance review, that difference stops feeling academic very quickly.
What to do if payback is too long
If payback stretches too far, the usual levers are straightforward. Improve activation so new customers reach value faster. Raise prices if the market supports it. Tighten ICP targeting so acquisition spend goes toward better-fit accounts. Reduce sales friction if long cycles are inflating cost.
Sometimes the fix is not a dramatic new growth tactic. Sometimes it is simply getting more of the right customers, faster, with less wasted motion.
9. Average Revenue Per User or Account (ARPU/ARPA)
ARPU or ARPA is the average recurring revenue generated per active user or account over a given period. The distinction depends on your model. User-level businesses often use ARPU. Account-based SaaS often uses ARPA.
Either way, the metric helps you understand pricing power, customer mix, and revenue quality.
How to calculate ARPU or ARPA
The formula is simple:
ARPU or ARPA = recurring revenue for the period / active users or accounts in the period
If your MRR is $80,000 and you have 400 active accounts, ARPA is $200. If you measure by end users instead, divide by active users.
Why this metric matters beyond pricing
ARPU and ARPA help you answer questions that pricing alone cannot. Are you growing because more customers are joining, or because each customer is worth more? Are certain segments expanding faster? Is packaging helping customers move up naturally, or capping value too early?
This metric becomes especially useful when paired with product behavior. If accounts that adopt a certain feature tend to have higher ARPA and better retention, that is not just interesting, it is a real growth clue. Looking at product usage patterns tied to revenue outcomes can make ARPA much more actionable.
10. Customer Retention Rate
Customer retention rate is the percentage of customers who stay over a given period. It is the mirror image of churn, but it deserves separate attention because staying is not just the absence of leaving. It reflects whether customers keep getting enough value to renew and continue using your product.
In practice, retention is often the metric that separates temporary growth from durable growth.
How to calculate retention rate
The formula is:
Customer retention rate = customers remaining at end of period / customers at start of period × 100
For monthly businesses, use a monthly window. For annual contract businesses, quarterly and annual views may be more meaningful. The key is matching the time frame to how customers actually buy and renew.
Retention by cohort tells the real story
Cohort analysis means grouping customers by the month or quarter they started, then tracking how each group retains over time. It sounds technical, but it is just a clearer way to answer a simple question: are newer customers sticking better than older ones did?
That view cuts through averages. If overall retention looks flat but cohorts from the past three months are improving, your onboarding changes may be working. If one pricing tier keeps churning while the rest look solid, a total retention number will hide it.
How These 10 Metrics Work Together
These metrics make more sense as a chain than as separate definitions. Acquisition creates customers at some cost. Activation and early product experience shape whether those customers stick. Retention and expansion determine how much long-term value gets created. Revenue metrics show the final output.
Once you see the connections, the dashboard becomes easier to use. You stop asking, “Is this number up or down?” and start asking, “What upstream factor is causing this?”
A simple metric chain for SaaS growth
The chain usually looks like this: lead generation drives customer acquisition, acquisition determines CAC, customer experience shapes activation, activation influences retention, retention drives LTV, and expansion lifts ARPA and NRR, which then feed overall revenue growth.
That sequence helps frame ownership too. Marketing can help lower CAC. Product can improve activation. Customer success can influence retention and expansion. Finance can keep definitions clean enough that nobody argues about the numbers instead of the problem.
Which combinations reveal the biggest problems fastest
Certain metric combinations act like smoke alarms. Rising MRR with worsening churn often means you are sprinting to replace lost revenue. Strong signups with weak CAC payback can signal poor-fit customers or expensive channels. High LTV:CAC with poor cash position often points to slow payback.
Those combinations matter more than isolated numbers. If you want your dashboard to become a decision tool instead of a report nobody opens after the monthly meeting, focusing on a cleaner KPI view for SaaS teams is a smart next move.
Which Metrics Matter Most At Each SaaS Stage
Not every SaaS company should obsess over the same scoreboard. Stage changes the job of the metric.
Early-stage SaaS
Early on, retention matters more than polished efficiency math. If customers do not stick, a prettier CAC model will not save you. Watch early MRR, retention, churn, and activation-adjacent signals closely enough to learn whether you have real pull.
Growth-stage SaaS
At growth stage, acquisition efficiency starts carrying more weight. CAC, payback, NRR, and channel-level performance become more important because the go-to-market engine is scaling and mistakes get more expensive.
More mature SaaS companies
In more mature SaaS businesses, forecastability, expansion revenue, gross-margin-aware growth, and segment optimization become the bigger story. At that point, the job is not just to grow. It is to grow predictably and profitably.
Common SaaS Metric Mistakes That Lead You Off Track
Most dashboard problems are not caused by missing data. They come from messy definitions, mixed concepts, and averages that hide the real issue.
Mixing bookings, billings, and recurring revenue
Bookings represent contract value signed. Billings represent invoices sent. Recurring revenue represents normalized subscription revenue recognized for the period. Those are not interchangeable.
Count the same win in all three places without knowing the difference, and performance suddenly looks better than it is. That mistake shows up constantly in fast-moving teams.
Using inconsistent definitions across teams
Sales, finance, marketing, and product can all report “the same” metric differently. CAC is the usual suspect. One team includes salaries, another excludes them. One team counts trial conversions immediately, another waits until payment clears.
Write definitions down. Keep them visible. That simple step prevents a lot of bad meetings.
Watching totals instead of segments and cohorts
Totals hide pain. Average churn can look manageable while one segment is falling apart. Average CAC can look stable while one channel has gotten much more expensive. Cohorts and segments give you the texture needed to act.
How To Improve Your SaaS Growth Metrics Without Chasing Every Number
Trying to improve every number at once is a good way to improve none of them. The better approach is to find the constraint that is hurting the system most and work there first.
Usually, that means starting with acquisition efficiency, retention, or expansion.
Improve acquisition efficiency
Lowering CAC starts with tighter targeting. Sharper ICP definition, better messaging, cleaner landing pages, and stronger conversion paths can do more than simply increasing spend. Smarter channel selection matters too. A mediocre channel rarely becomes a great one just because more money gets poured into it.
Improve retention first
Retention often creates the fastest compounding gains. Better onboarding, clearer activation paths, improved product adoption, and stronger support can reduce churn while lifting LTV and improving NRR at the same time.
For many SaaS businesses, this is the highest-leverage work in the building. If customers are not staying, growth stays fragile.
Expand revenue from existing customers
Expansion can come from upgrades, seat growth, add-ons, usage-based pricing, or better packaging. The best expansion does not feel forced. It follows real product adoption and increasing value.
That is why customer success and product teams matter so much here. A deeper look at customer success measures tied to renewals and expansion can help turn this from a vague goal into a repeatable motion.
Build A Simple SaaS Growth Dashboard You’ll Actually Use
A dashboard only works if it gets checked and discussed regularly. That means keeping it simple enough to scan on a Monday morning before a pipeline call, but detailed enough to point toward action.
The core monthly dashboard
Your core monthly dashboard should include the ten metrics in this guide: MRR, ARR, customer churn, revenue churn, NRR, CAC, LTV, LTV:CAC, CAC payback, ARPU or ARPA, and retention rate. Add trend lines, targets, and short notes for major changes so the numbers do not float without context.
If one metric moved because pricing changed, because an enterprise account expanded, or because a paid channel slowed down, note it. Context saves time.
Who should own what
Finance usually owns recurring revenue definitions and reporting integrity. Growth or marketing often owns CAC by channel. Sales influences acquisition efficiency and segment quality. Customer success helps drive retention and expansion. Product shapes activation and adoption, which then show up in churn and revenue retention.
Ownership does not mean isolation. It means somebody is responsible for explaining movement and pushing the next action.
A good review rhythm
Weekly checks work best for leading indicators and funnel movement. Monthly reviews are better for core business metrics like MRR, churn, NRR, CAC, and payback. Quarterly resets are useful for bigger strategy changes, pricing decisions, and channel allocation.
The exact rhythm matters less than staying consistent enough to notice patterns early.

FAQ About SaaS Growth Metrics
What are the most important SaaS growth metrics?
The most important SaaS growth metrics are MRR or ARR, customer churn, retention rate, NRR, CAC, LTV, LTV:CAC ratio, CAC payback period, and ARPU or ARPA. The real priority depends on your stage. Early on, retention and early recurring revenue matter most. As your company scales, CAC efficiency, payback, and NRR usually become more urgent.
What is a good SaaS churn rate?
A good churn rate depends on contract length, price point, and customer segment. Self-serve SMB SaaS usually sees higher churn than enterprise SaaS with annual contracts. The better question is whether churn is improving, how it compares across cohorts, and whether it leaves enough room for efficient growth.
What is the difference between MRR and ARR?
MRR is monthly recurring revenue. ARR is annual recurring revenue. MRR is more useful for monthly operating decisions and fast-moving businesses. ARR is better for longer sales cycles, annual contracts, strategic planning, and investor discussions.
How often should you track SaaS growth metrics?
Some numbers deserve weekly attention, especially acquisition and funnel indicators. Core SaaS growth metrics like MRR, churn, NRR, CAC, and payback are usually best reviewed monthly. Quarterly reviews help with planning, resource shifts, and pricing or packaging decisions.
Which metric should you improve first?
If growth feels fragile or expensive, start with retention and CAC payback. Better retention lifts LTV, improves NRR, and reduces pressure on acquisition. Better payback improves cash efficiency and gives you more room to grow without stretching the business.
The one thing worth trying first
If your dashboard feels crowded, pick one simple move: review MRR, churn, NRR, CAC, and payback together in the same meeting, every month, using fixed definitions. That alone will surface more truth than a bigger dashboard with fuzzy math.
Once you can see the system clearly, better decisions come faster. If you want a simpler way to track your SaaS growth metrics and turn them into action, try AtSpart.