Your dashboard can be packed with charts and still leave you staring at the screen at 4:47 p.m., wondering what to fix first. That is why SaaS customer success metrics matter: they show whether customers are getting value, sticking around, and growing their spend, so you can make faster decisions without guessing.
In plain English, SaaS customer success metrics are the numbers that track what happens after the sale. They tell you if customers adopt the product, renew, expand, struggle, or quietly drift toward churn.
Start With the Metrics That Actually Change Decisions
A good metric earns its spot by helping you act. If a number looks impressive in a board deck but does not change onboarding, support, pricing, or account strategy, it is probably just decoration.
Early on, it is easy to treat customer success as a softer function, something centered on check-ins and relationship management. That view misses the point. Customer success metrics sit right in the middle of product, revenue, and retention because customer value is what keeps subscription businesses alive.
What SaaS customer success metrics are
These metrics track customer outcomes after signup or purchase. That includes retention, renewals, usage, satisfaction, expansion, and the health of recurring revenue over time.
The overlap with growth and product metrics is real, but the lens is different. Product teams may watch feature adoption to improve UX. Revenue teams may watch NRR to forecast growth. Customer success looks at those same signals and asks a more practical question: are customers getting enough value to stay and grow?
Why these metrics matter more than a crowded KPI dashboard
Watching everything at once usually creates less clarity, not more. You do not need 37 widgets. You need a short list of numbers that reveal leaks in your customer journey.
The best SaaS customer success metrics help you reduce churn, improve onboarding, find expansion opportunities, and protect recurring revenue. That is the real job. If a metric helps you spot risk before renewal season, or notice which customers are ready for an upgrade, keep it. If not, cut it.
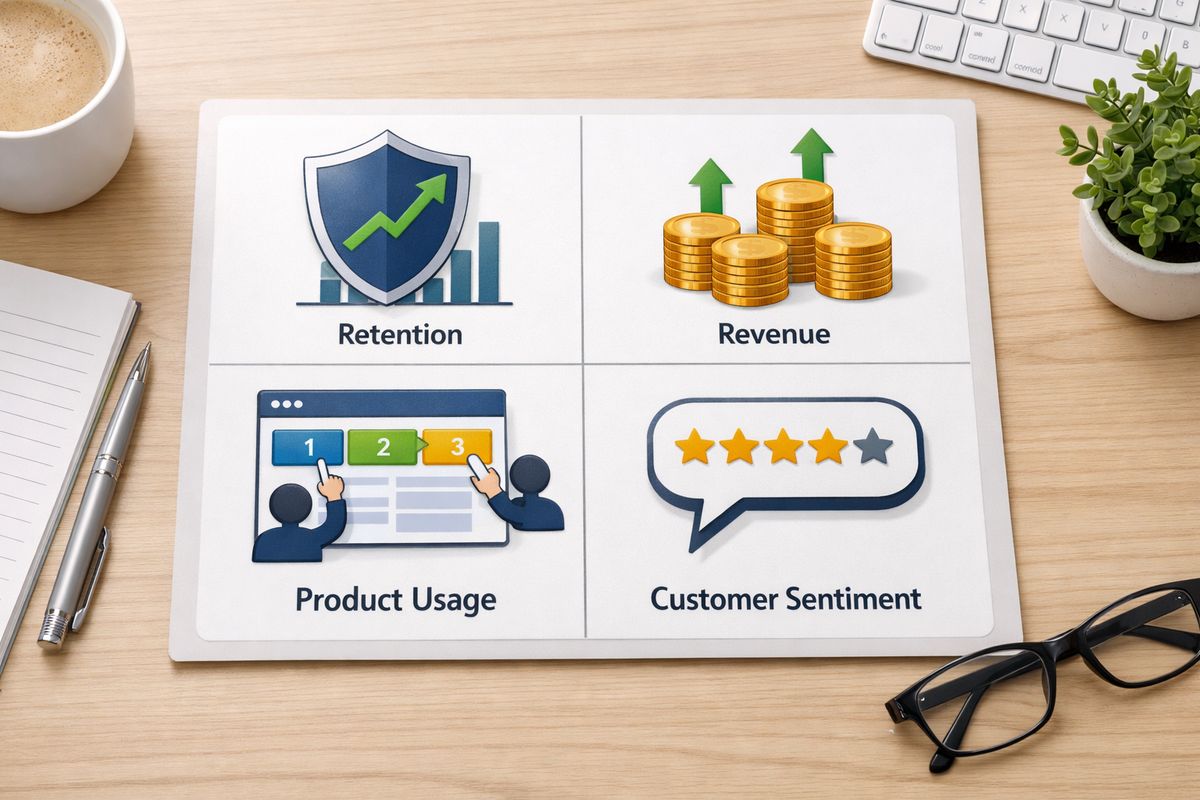
Group Your Customer Success Metrics Into Four Buckets
The easiest way to make this usable is to sort metrics into four buckets: retention, revenue, product usage, and customer sentiment. Once you do that, the whole picture gets simpler.
Retention tells you who stays. Revenue tells you what that means financially. Usage tells you what is likely to happen next. Sentiment helps explain why customers feel good, frustrated, or ready to leave.
Retention metrics
Retention metrics show whether customers keep renewing, keep paying, and keep finding enough value to stay. In most SaaS businesses, this is the backbone of customer success because retention is where growth either compounds or stalls.
Revenue metrics
Revenue metrics connect customer success to business reality. Saving accounts, driving expansion, and improving renewals are not side wins. They directly shape the quality of your recurring revenue base. If you want a broader view, this fits naturally alongside other numbers every SaaS team should monitor.
Product adoption metrics
Usage is often your earliest warning sign. Customers usually do not wake up one morning and churn for no reason. The pattern tends to show up first in low adoption, shallow engagement, or slow time to value.
Customer sentiment metrics
Feedback metrics like NPS, CSAT, and CES add color to the picture. Feelings alone are not enough, but they often explain the story behind a dip in retention or a spike in support requests.
Track Retention Metrics First If You Want a Clearer Picture Fast
If you need a starting point, start here. Retention metrics cut through noise fast because they show whether your business is holding onto the customers you worked hard to earn.
Customer churn rate
Customer churn rate is the percentage of customers you lose in a given period. If you begin a month with 100 customers and lose 5, your monthly churn rate is 5%.
You also need to separate logo churn from revenue churn. Losing one small account and losing one large account both count as one customer, but the revenue impact is obviously not the same. Rising churn is one of the fastest ways to stall growth because every new deal has to replace lost ground before it adds anything net new.
Customer retention rate
Retention rate is the flip side of churn. It tells you what percentage of customers you keep over a period, which often gives a cleaner long-term view than simply counting new logos.
This matters because new customer growth can hide retention problems for a while. A business can look busy and still be leaking badly underneath. For a deeper retention lens, it helps to compare your numbers with other ways to measure how well customers stick around.
Gross revenue retention (GRR)
GRR measures how much recurring revenue you retain from existing customers before counting any upgrades or expansion. In simple terms, it answers one question: how well are you protecting your base?
That makes GRR brutally honest. It strips out the comfort of upsells and shows how much revenue your current book of business is losing through churn and downgrades.
Net revenue retention (NRR)
NRR measures recurring revenue retained from existing customers after upgrades, downgrades, and churn. If GRR is about protection, NRR is about momentum.
This is one of the clearest SaaS growth metrics because it shows whether your existing customer base is getting stronger or weaker. If NRR is above 100%, expansion is outpacing losses. If it falls below 100%, your base is shrinking even before you think about new sales.
Renewal rate
Renewal rate tracks how many eligible customers renew at the end of a contract term. It overlaps with retention, but it deserves its own view, especially in annual-contract B2B SaaS.
A customer can look calm for eleven months and still become a renewal problem in month twelve. That is why renewal forecasting matters. It forces you to see risk before the contract end date sneaks up on you.
Use Revenue Metrics to Connect Customer Success to Growth
Customer success is not separate from growth. It is one of the cleanest drivers of growth, especially once acquisition gets more expensive.
Monthly recurring revenue (MRR)
MRR is the predictable revenue your subscriptions generate each month. Simple enough. The customer success angle is what changes it: fewer cancellations, fewer downgrades, more renewals, and more expansions all push MRR in the right direction.
Sometimes a renewal saved in the last week of the quarter matters more than a flashy top-of-funnel number. That saved account keeps revenue stable, protects future expansion, and saves acquisition dollars you would otherwise spend replacing it.
Expansion revenue
Expansion revenue comes from upsells, cross-sells, added seats, plan upgrades, and broader product adoption. It is often the payoff for strong onboarding and a product that becomes more useful over time.
Healthy expansion usually means customers got value early, saw more use cases, and brought more teams into the account. That is why customer success owns more of this than many companies admit.
Customer lifetime value (LTV or CLV)
LTV estimates the revenue, or sometimes gross profit, a customer generates over the full relationship. The longer customers stay and the more they expand, the higher this number climbs.
This is where retention gets powerful. You do not need to spend more on acquisition to improve LTV. Keeping customers longer and helping them grow can do the job.
Customer acquisition cost (CAC) and CAC payback
CAC is what you spend to acquire a customer. CAC payback measures how long it takes to recover that spend from the revenue a customer brings in.
Customer success affects both more than most dashboards show. Better activation, better onboarding, and better retention mean acquired customers become valuable faster and stay valuable longer. That is why customer success should sit beside your broader revenue and operating metrics, not outside them.
Cost of retention
Cost of retention tracks what you spend to keep and grow existing customers. Salaries, tooling, support effort, education, and account management can all factor in.
This number matters because busy does not always mean efficient. If retention programs are expensive but barely move GRR, NRR, or expansion, something is off.

Watch Product Usage Metrics Because They Tell You What Revenue Will Do Next
Usage metrics are your early-warning system. Think of them like hearing the engine rattle before the car stops on the highway. Revenue reports tell you what happened. Usage tells you what is about to happen.
Active users and engaged users
Daily, weekly, and monthly active users measure how many people use your product within a time window. But a login is not automatically meaningful. If someone logs in, clicks around for 20 seconds, and leaves confused, that should not count as success.
The better move is to define active use around value. An engaged user completes actions that correlate with retention, like importing data, sending a campaign, creating a report, or inviting teammates.
Product usage rate
Product usage rate looks at how often customers use the product and how deeply they use it. The trick is to tie usage to outcome-based actions, not surface-level clicks.
If you want a sharper framework for this, it helps to study which usage signals actually predict growth. Not every button click matters. A handful of behaviors usually carry most of the signal.
Feature adoption rate
Feature adoption rate tracks how many customers use specific features tied to value, stickiness, or expansion. This helps you spot whether onboarding and education are doing their job.
A low adoption rate on a high-value feature often means one of two things: customers do not understand it, or the product is making it too hard to start.
Time to value (TTV)
TTV is the time it takes a new customer to reach the first meaningful win. That win should be obvious and concrete, not vague. For one product, it might be publishing a dashboard. For another, it might be inviting five teammates and automating the first workflow.
Shorter TTV improves activation, retention, and expansion at the same time. Customers stay when the product proves itself early.
Onboarding success rate
Onboarding success rate measures whether new accounts complete the milestones that lead to real use. That might include setup completion, data import, team invites, integrations, or reaching a first result.
This metric matters a lot in early-stage SaaS because weak onboarding creates churn months later. By then, the original problem is harder to see.
Add Customer Feedback Metrics So You Don’t Miss the “Why”
Behavior tells you what customers do. Feedback helps explain why. Used together, those signals are much stronger than either one alone.
Net promoter score (NPS)
NPS measures how likely customers are to recommend your product. It is useful as a directional loyalty signal, especially when tracked over time.
The catch is that NPS is not a retention metric by itself. Some happy customers still churn because budgets change or priorities shift. Trends matter more than one score in isolation.
Customer satisfaction score (CSAT)
CSAT measures satisfaction with a specific interaction or moment, like onboarding, a support conversation, or a feature experience. It works best as a quick pulse check.
That focus is what makes CSAT useful. It tells you where friction shows up in the journey instead of pretending to summarize the entire relationship.
Customer effort score (CES)
CES asks how easy it was for a customer to complete a task or solve a problem. This is one of the most practical feedback metrics because effort is often where frustration starts.
If customers have to jump through hoops to import data, set up permissions, or get support, retention usually suffers later. Making things easier sounds simple, but it pays back fast.
Qualitative customer feedback
Open-text survey comments, success call notes, support themes, and cancellation reasons turn metrics into action. A score tells you something is wrong. A sentence often tells you what to fix next.
Review this material regularly. Patterns show up fast when you stop treating comments like clutter.
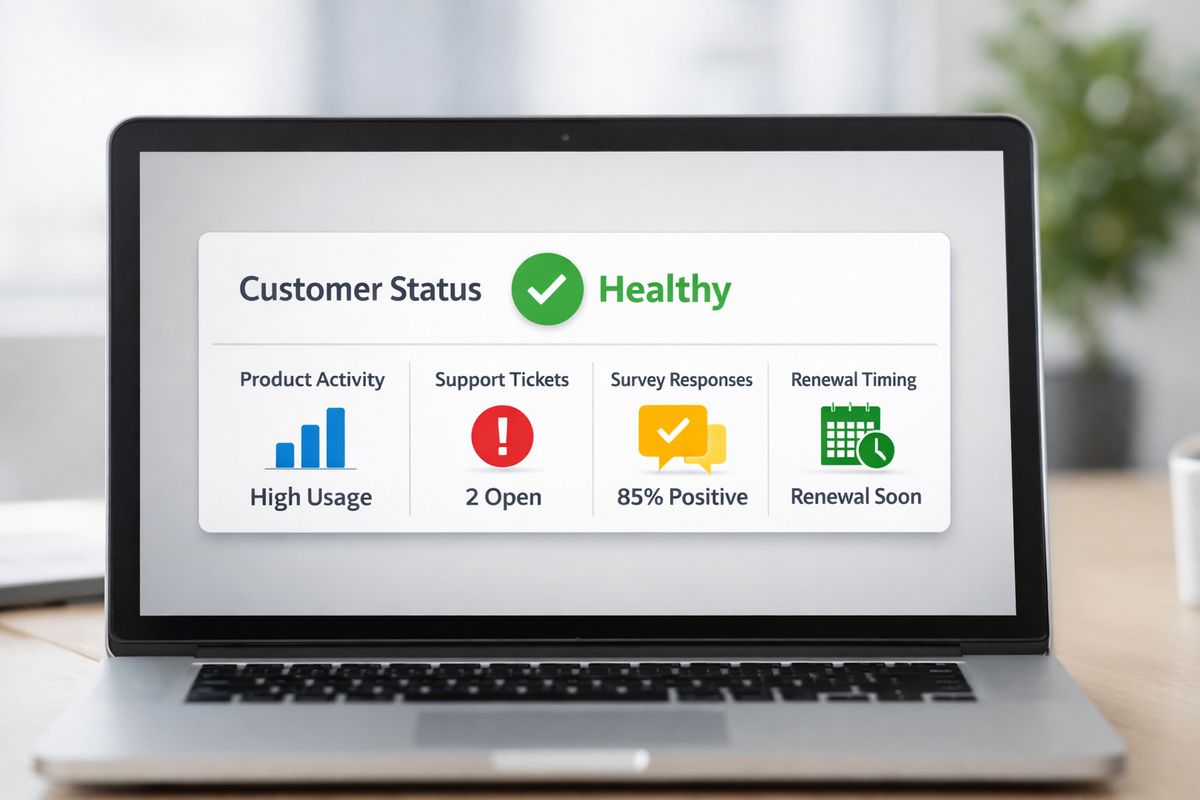
Build a Customer Health Score Without Making It Too Complicated
A customer health score combines several signals into one snapshot. Done right, it helps you prioritize outreach, spot risk, and focus team time where it counts.
Done badly, it becomes a fancy spreadsheet nobody trusts.
What to include in a customer health score
Good inputs usually include product usage, feature adoption, support ticket patterns, NPS or CSAT, renewal timing, stakeholder engagement, and payment behavior.
You do not need every possible signal. You need the handful that actually predict renewals, churn, or expansion in your business.
How to weight your score
Not every input deserves equal weight. If low feature adoption consistently predicts churn, give it more influence than a single lukewarm survey response.
Historical patterns should guide the weighting. If your healthiest accounts almost always activate two teammates within the first 14 days, that action deserves attention. If something looks interesting but never correlates with outcomes, cut it.
Common mistakes that make health scores useless
The most common mistake is stuffing in too many inputs. Another is using vanity behaviors, like raw login counts, that look active but do not reflect value.
Health scores also break when nobody updates the logic. Products change. Customer behavior changes. Your score should change too. If you are building reporting around this, a clean dashboard structure for SaaS KPIs helps keep the score visible and usable instead of buried in a tool nobody opens.
Pick the Right Metrics for Your SaaS Stage
A 15-person startup does not need the same dashboard as a public SaaS company. Copying an enterprise metric stack too early usually creates work, not insight.
Early-stage SaaS
At this stage, focus on onboarding success, time to value, active usage, early churn, and customer feedback. You need fast learning more than perfect benchmarking.
The goal is simple: find out where customers get stuck and fix that quickly.
Growth-stage SaaS
Once growth picks up, retention rate, GRR, NRR, expansion revenue, LTV, and customer health scores start to matter more. This is when metric discipline begins shaping hiring, segmentation, and forecasting.
You are no longer just trying to survive onboarding. You are building repeatable retention and expansion.
More mature SaaS companies
At scale, NRR, logo retention, cost of retention, segmented health scores, and expansion efficiency become more useful. Averages get less trustworthy because different customer groups behave very differently.
That is where mature reporting starts to look more like stage-specific growth measurement than one blended dashboard for everybody.
Turn Metrics Into a Simple Customer Success Dashboard
You do not need a complicated operating system. You need a dashboard that is easy to review, easy to trust, and tied to real decisions.
What your dashboard should show
For most SaaS teams, a focused dashboard should include churn, retention, NRR, MRR impact, expansion revenue, active usage, feature adoption, TTV, NPS or CSAT, and a customer health score.
That mix gives you both lagging and leading indicators. You can see what happened, what is changing, and where to intervene.
How often to review each metric
Review onboarding progress, usage, and health changes weekly. Those signals move fast and deserve quick action.
Review churn, retention, renewal risk, and MRR impact monthly. Review LTV, CAC payback trends, and strategic cohort patterns quarterly. Not every number needs constant attention.
How to segment your metrics for better decisions
Averages hide problems. Break metrics down by plan, cohort, company size, industry, lifecycle stage, or acquisition channel.
A 3% churn rate can look fine until you notice one segment is churning at 12%. That is the kind of detail that actually changes decisions.
Fix the Most Common Metric Mistakes Before They Skew Your Decisions
Bad measurement creates fake confidence. That is worse than having less data.
Mixing customer success metrics with vanity metrics
Raw signups, page views, and login counts can look exciting, but they mean little if they do not connect to retention or value realization.
Track what predicts outcomes, not what flatters the dashboard.
Tracking too many metrics at once
Too much data creates the same problem as too little clarity. If every metric is urgent, none of them are.
Keep the shortlist tight. Focus on numbers tied directly to customer outcomes and recurring revenue.
Ignoring metric definitions and consistency
Define churn, active users, expansion, and LTV the same way every time. If formulas change every quarter, trend lines become useless.
Consistency matters more than perfection here. A stable definition beats a theoretically perfect one that keeps moving.
Looking at company-wide averages only
One blended number can hide a serious issue in a specific segment. You need cohort and segment analysis to see what is actually going on.
This becomes especially obvious in SaaS with multiple plans, mixed customer sizes, or both self-serve and sales-led motion.
Start With a Shortlist of SaaS Customer Success Metrics
If your dashboard feels bloated, cut back to a starter set: churn rate, retention rate, NRR, MRR, expansion revenue, active usage, feature adoption, time to value, NPS or CSAT, and a simple health score.
Then pick one weak spot and work from there. If onboarding is messy, start with TTV and onboarding success. If renewals feel shaky, start with churn, retention, GRR, and NRR. If growth has slowed, look hard at expansion revenue and product adoption.
Try AtSpart if you want a cleaner way to track the metrics that actually move customer success and revenue.
Frequently Asked Questions
What is the most important SaaS customer success metric?
If you need one answer, start with net revenue retention. It shows whether existing revenue is growing or shrinking after churn, downgrades, and expansion. That said, NRR works best alongside churn, retention, and product usage data.
How many customer success metrics should you track?
For most teams, 8 to 10 core metrics is enough. More than that usually creates noise unless you are segmenting by product line, customer tier, or lifecycle stage.
What is the difference between customer churn and revenue churn?
Customer churn measures how many accounts you lose. Revenue churn measures how much recurring revenue you lose. Revenue churn gives a better picture when account sizes vary a lot.
How do you build a customer health score?
Start with a few signals that predict outcomes in your business, such as usage, feature adoption, support patterns, renewal timing, and sentiment. Weight the strongest predictors more heavily, then review and adjust the model over time.
Which metrics matter most for early-stage SaaS?
Early-stage teams usually get the most value from onboarding success rate, time to value, active usage, early churn, and direct customer feedback. Those metrics help you learn quickly and fix obvious friction before it turns into retention problems.
How often should you review SaaS customer success metrics?
Review onboarding and usage weekly, because those signals change fast. Review retention, churn, renewals, and MRR monthly. Review LTV, CAC payback, and long-term cohort trends quarterly.