If your SaaS performance metrics live in five dashboards, twelve tabs, and one Slack screenshot from last Tuesday, you already know the problem: having numbers is not the same as knowing what to do next. The right saas performance metrics show where growth is real, where money is leaking out, and which fixes are worth your next month of effort.
In plain English, SaaS performance metrics are the numbers that tell you how your subscription business acquires customers, turns revenue into recurring revenue, keeps customers, and grows efficiently over time. Good metrics help you make decisions. Bad ones just make your dashboard look busy.
Here’s what you’ll learn in this guide:
- Which metrics actually matter
- How to group metrics by customer journey
- The core formulas worth memorizing
- How to spot retention and CAC problems early
- Which product metrics explain business shifts
- How to build a dashboard you’ll keep using
- Common mistakes that distort decisions
- A simple 30-day review plan
What SaaS Performance Metrics Actually Tell You
A healthy SaaS business is not just “growing.” It is acquiring customers at a sensible cost, getting them to value quickly, keeping enough of them long enough, and expanding revenue without burning cash like a bonfire in a parking lot.
That is what SaaS performance metrics help you see.
When your dashboard is full but your next move still feels unclear, the issue is usually not lack of data. It is lack of signal. The trick is to use metrics as decision tools, not trivia. A good scorecard tells you what to fix, what to protect, and what only looks like progress because the top of funnel got louder for a week.
The difference between a useful metric and a vanity metric
A useful metric changes what you do. If trial-to-paid conversion drops, you inspect onboarding, pricing, or sales follow-up. If CAC jumps, you revisit channel mix and qualification. If gross revenue retention falls, you know the base business is weakening.
A vanity metric looks impressive without telling you much. Website traffic after a launch. Free signups from a giveaway. Social reach. Even raw lead volume can be vanity if those leads never convert or churn in 30 days.
Here’s the test: if a metric goes up or down, can you name the decision it should trigger? If not, it probably does not deserve prime real estate.
Why startups need a small core scorecard first
Tracking everything at once sounds disciplined, but it usually creates noise. Early-stage teams especially do better with a tight core scorecard tied to revenue, retention, and efficiency.
Start with a handful of metrics that answer five questions: Are you growing recurring revenue? Are customers staying? Are you acquiring them efficiently? Are accounts expanding? Are you burning too much to get there? That usually means MRR or ARR, churn, retention, CAC, LTV, and one or two supporting efficiency metrics.
Small beats sprawling. A scorecard you check every Monday morning at 8:15 is worth far more than a giant dashboard nobody opens after setup week.
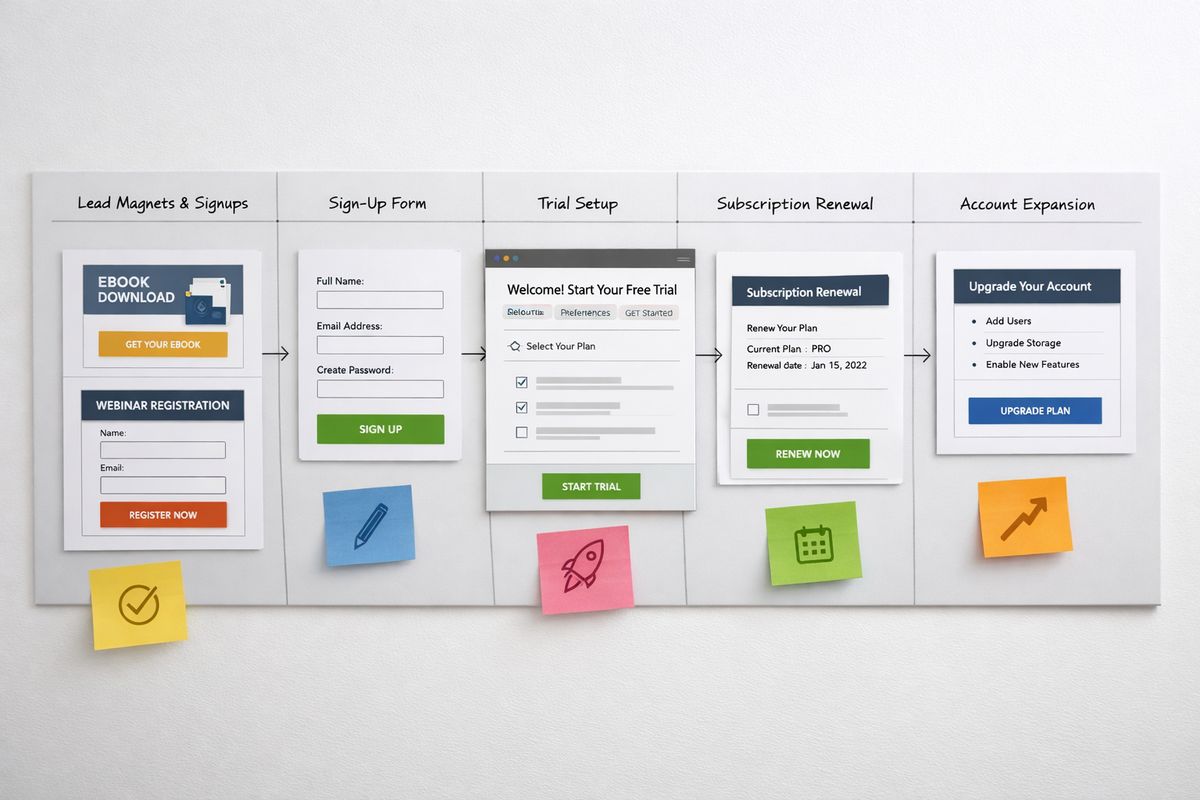
Build Your SaaS Metrics Stack Around the Customer Journey
One of the easiest ways to make reporting less messy is to organize metrics by where they show up in the customer journey. Instead of one spreadsheet junk drawer, you get a map: acquisition, conversion, retention, revenue, and efficiency.
That structure matters because metrics do not exist in isolation. CAC gets better or worse because conversion changed. NRR rises because retention and expansion improved. Burn multiple gets ugly when growth slows but spend does not.
Acquisition metrics
Acquisition metrics tell you if you are bringing in the right leads at a cost your business model can support. This is where lead volume, lead-to-customer conversion rate, CAC, and channel-level efficiency live. If your pipeline is full but revenue is flat, the issue often starts here.
Revenue and growth metrics
Revenue metrics show whether the business is compounding or stalling. MRR, ARR, CMGR, ARPA, and ACV all help you see the shape of growth, not just the size of it. A company adding $20,000 in MRR with strong expansion is in a very different position from one adding the same amount through heavy discounting and short-lived customers.
Retention and expansion metrics
Retention metrics reveal whether customers stick around and whether existing accounts become more valuable over time. Churn, GRR, NRR, logo retention, expansion revenue, and contraction all live here. This is the part too many teams treat as a side panel. It is not a side panel. It is the business.
Efficiency and financial health metrics
Efficiency metrics answer the uncomfortable but necessary question: is growth sustainable? Gross margin, CAC payback, burn multiple, and customer concentration help you judge quality, not just speed. Investors watch these closely, but honestly, you should care long before an investor asks.
Start With the Core SaaS Metrics Every Startup Should Track
Some metrics are useful later. Some are useful only in certain models. A few belong on almost every startup’s core scorecard from the start.
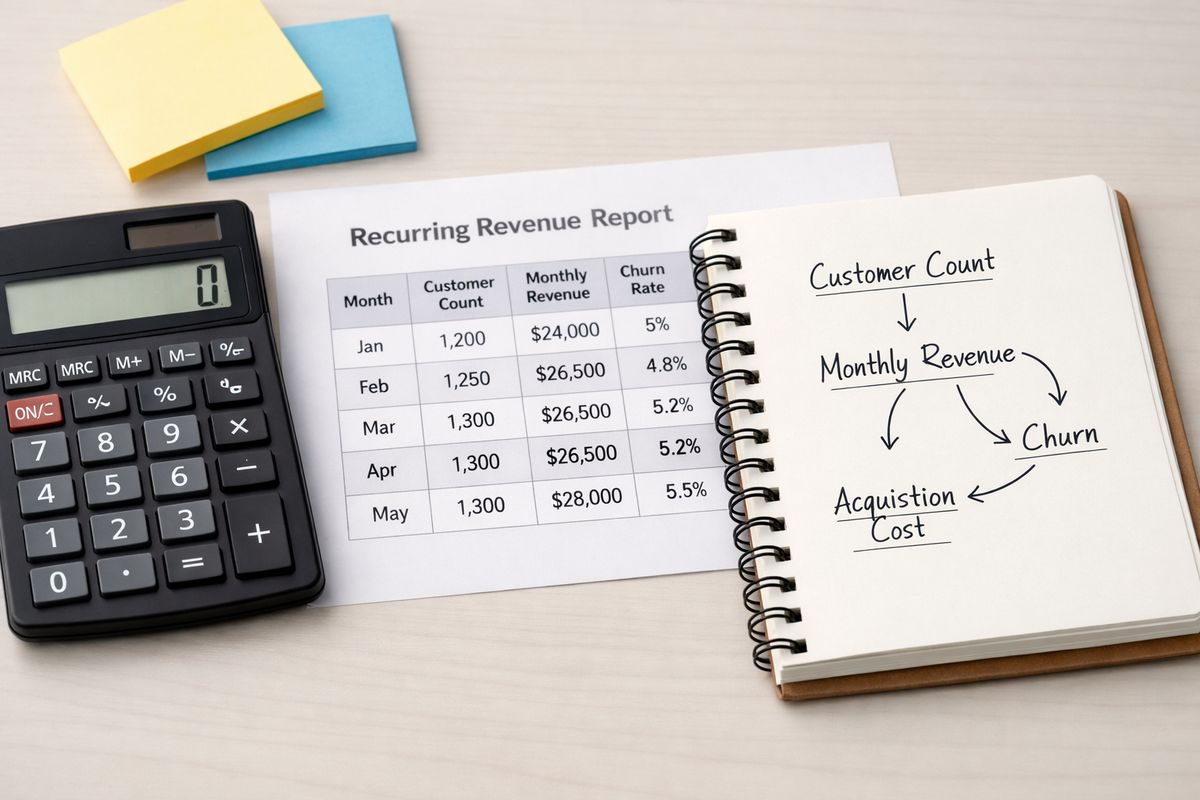
Monthly recurring revenue (MRR)
MRR is the monthly value of your recurring subscription revenue. It is the clearest pulse check for an early-stage SaaS company because it shows the recurring base you can count on this month, not one-time services, setup fees, or annual cash collected upfront.
What counts? Subscription charges normalized to one month. What does not? Professional services, one-off implementation fees, and non-recurring add-ons. If a customer prepays annually, the cash arrives now, but the revenue should still be recognized across the contract period.
MRR matters because it reacts fast. New sales, churn, downgrades, upgrades, and failed payments show up quickly.
Annual recurring revenue (ARR)
ARR is recurring revenue annualized. If MRR is your pulse, ARR is your planning view. It becomes especially useful as contracts get larger, sales cycles get longer, and investor updates start focusing on annual scale.
For companies with annual contracts or higher ACV, ARR gives a cleaner strategic picture than obsessing over monthly wiggles. But the underlying logic stays the same: only recurring revenue belongs here.
Customer churn rate
Customer churn rate, often called logo churn, measures how many customers you lose in a period. It sounds simple, but the damage compounds. Losing 5 percent of customers each month is not a bump, it is a hole in the floor.
A rising churn rate usually signals one of four things: poor fit, weak onboarding, low product value, or preventable friction like billing issues and support pain. Sometimes pricing causes it too, especially when low-intent customers enter through a discount and leave at renewal.
Revenue churn and net revenue retention (NRR)
Customer churn tells you how many accounts leave. Revenue churn tells you how much recurring revenue disappears through cancellations and downgrades. Those are not always the same. Losing one large account can hurt revenue far more than losing five tiny ones.
NRR goes a step further by including expansion revenue from upgrades, added seats, or cross-sells. If expansion offsets churn and contraction, NRR can stay above 100 percent, which is one of the clearest signs of a healthy SaaS business. Strong NRR means the installed base is not just surviving, it is growing.
Customer lifetime value (LTV)
LTV estimates how much value a customer generates across the full relationship. That can be revenue-based or, better, gross-profit-based. The exact formula varies, and that is fine. The real goal is consistency.
Rough but honest beats perfect-looking fantasy math. If your churn assumptions are shaky, an overly polished LTV number is worse than a simple estimate you update every month.
Customer acquisition cost (CAC)
CAC measures what you spend to acquire a paying customer. In most startups, that includes ad spend, salaries, commissions, tools, agencies, and other sales and marketing costs tied to acquisition.
Undercounting CAC creates bad decisions fast. Paid search looks amazing until you include sales time. A new outbound motion looks efficient until you add SDR compensation and tooling. If acquisition cost is real in cash, it should be real in the metric.
Learn the Formulas Without Getting Lost in Spreadsheet Fog
You do not need an MBA-style model to get value from SaaS metrics. You need clear formulas and a few guardrails so every function is talking about the same thing.
Simple formulas for MRR, churn, CAC, and LTV
MRR is the sum of monthly recurring subscription revenue. For annual contracts, divide contract value by 12.
ARR is MRR multiplied by 12.
Customer churn rate is customers lost during a period divided by customers at the start of that period.
Revenue churn rate is recurring revenue lost in the period divided by starting recurring revenue.
CAC is total sales and marketing acquisition costs over a period divided by new customers acquired in that period.
A simple LTV formula is ARPA multiplied by gross margin multiplied by average customer lifespan. Another common version is ARPA times gross margin divided by churn rate. That second version is popular because it is fast, but it becomes unreliable when churn is unstable.
How to calculate CAC payback period
CAC payback period tells you how long it takes to recover acquisition cost from the gross profit generated by a customer. A common version is CAC divided by monthly gross profit per customer.
This is one of the most honest metrics in SaaS because it forces efficiency into the conversation. Fast growth with a miserable payback period can still put your business in a dangerous spot. According to Stripe’s guide to SaaS metrics, payback period is one of the core ways operators evaluate go-to-market efficiency.
LTV:CAC ratio and how to use it without fooling yourself
The classic ratio compares customer lifetime value to acquisition cost. On paper, it tells you whether a customer is worth the cost to win. In practice, it is easy to make this number look better than reality.
The catch is in the inputs. If churn is understated or margins are ignored, LTV gets inflated. If your payback period is long, the ratio can still look attractive while your cash position gets worse. Use LTV:CAC as a directional metric, not a trophy.
ACV and ARPA: two supporting metrics that make the big ones clearer
ACV, annual contract value, is the average annualized value of a customer contract. ARPA, average revenue per account, shows average recurring revenue per customer account over a period.
Both add context to bigger metrics. Higher ACV can support higher CAC. Rising ARPA can improve LTV even before retention changes. A flat churn rate looks very different when ARPA is climbing through expansion.
Track Acquisition Metrics That Connect to Revenue
Acquisition should not be measured by volume alone. Plenty of startups learn this the hard way after celebrating lead growth while revenue barely moves.
Lead-to-customer conversion rate
This metric shows how many leads become paying customers. It helps you spot weak handoffs between marketing, sales, onboarding, or pricing. If leads are healthy but customer growth lags, the problem is not top of funnel. Something in the middle is broken.
This metric gets even more useful when segmented by channel. Organic demo requests often behave very differently from webinar leads or paid social signups.
Trial-to-paid and freemium-to-paid conversion
If your product has a self-serve motion, trial-to-paid and freemium-to-paid conversion rates matter a lot. Healthy signup volume means very little if users never reach value or never see a reason to pay.
A strong product-led motion depends on activation. If signups look healthy but revenue does not, check what happens in the first session, first day, and first week. That is usually where the real story lives.
Magic Number
The SaaS Magic Number is a sales efficiency metric that compares new ARR growth to sales and marketing spend. It tries to answer a simple question: how much new recurring revenue did acquisition spend create?
It is useful for evaluating go-to-market efficiency over time, especially once sales cycles stabilize. But early-stage teams can get misled by it. A single large deal, a delayed ramp, or spend that lands before revenue catches up can make the number swing hard.
Measure Retention Like It’s the Main Event
https://www.youtube.com/watch?v=s8_Vax8VUmM
Here’s the thing: retention is the game. Acquisition gets attention because it feels exciting. Retention decides whether the business compounds or quietly leaks from the bottom.
Gross revenue retention (GRR)
GRR measures the percentage of recurring revenue you keep from existing customers before expansion is counted. It ignores upsells on purpose, which makes it a clean view of the strength of the base business.
If GRR is weak, expansion can hide the problem for a while, but not forever. Strong GRR means your core product is holding up on its own.
Logo retention
Logo retention is simply the percentage of customers you keep. It matters most when accounts are fairly similar in size, such as many SMB SaaS businesses. In those cases, customer count tells a meaningful story, not just revenue.
If your business has a few giant accounts and many small ones, logo retention becomes less informative by itself. That is why it should sit next to revenue retention, not replace it.
Expansion revenue, contraction, and net dollar movement
After the sale, accounts can grow, shrink, or leave. Expansion revenue comes from upgrades, extra seats, higher usage, or add-on products. Contraction is the opposite: downgrades, reduced seats, or lower spend.
Tracking net dollar movement inside existing accounts tells you whether your product becomes more valuable over time. That is a powerful growth engine. According to Benchmarkit’s SaaS benchmarks, expansion ARR has become an increasingly important share of total new ARR in larger SaaS businesses.
Early warning signs before churn shows up in your revenue
Churn almost never appears out of nowhere. It usually sends signals first: declining usage, slower onboarding completion, repeated support frustration, lower admin activity, or a champion who stops showing up to calls.
That is why business metrics need product context. If an account has not completed setup by day 10, or weekly active usage falls sharply, that is your chance to intervene before renewal turns into a postmortem.

Use Product Engagement Metrics to Explain the “Why”
Business metrics tell you what happened. Product engagement metrics help explain why.
DAU, WAU, and MAU
Daily, weekly, and monthly active users measure how often people actively use your product. Which one matters depends on usage pattern. A team chat tool might care about DAU. Payroll software probably should not.
The mistake is copying another company’s benchmark without asking how often your product is supposed to be used. Frequency only matters relative to expected behavior.
Feature adoption and activation rate
Activation rate measures how many new users reach a meaningful early milestone, like connecting data, inviting teammates, or publishing a first workflow. Feature adoption shows whether users start using sticky features tied to long-term value.
If retention is weak, activation is one of the first places to look. Customers rarely renew products that never became part of a habit or workflow.
Customer engagement score
A customer engagement score combines several usage signals into one practical health score. This can include login frequency, key actions completed, seat usage, support activity, and setup progress.
Keep it simple enough to act on. If the score needs a 40-minute explanation, nobody will trust it. A rough health score that flags accounts for action is better than a clever one nobody uses.
Keep an Eye on Financial Health and Efficiency Metrics
Once recurring revenue starts moving, the next question is quality. Not just “Are you growing?” but “Are you growing in a way that holds up?”
Gross margin
Gross margin in SaaS is revenue minus cost of goods sold, expressed as a percentage. In practice, that usually includes hosting, support, and service delivery tied directly to serving customers.
Gross margin shapes how much you can reinvest in growth. Higher margin businesses can afford longer payback periods and heavier experimentation. Lower margin businesses need more discipline.
Burn multiple
Burn multiple measures how much cash you burn to generate each new dollar of ARR. It became a popular efficiency check because it cuts through vanity. If revenue is growing but cash burn is rising faster, this metric shows it fast.
It is blunt, which is useful. A flashy launch month cannot hide an ugly burn multiple for long.
Customer concentration
Customer concentration measures how dependent you are on a few accounts. This matters more than many founders want to admit, especially in early B2B SaaS. If one customer accounts for 18 percent of ARR, one churn event can leave a crater.
Track it regularly. A company can look healthy on MRR and still carry serious concentration risk.
CMGR and growth rate tracking
CMGR, compound monthly growth rate, helps you track growth trends over time. Month-over-month growth matters too, but trend lines matter more than one strong month after a launch, annual promo, or enterprise close.
Look for patterns, not celebrations. One spike is an event. A trend is a signal.
Create a SaaS Metrics Dashboard You Will Actually Use
The best dashboard is not the one with the most widgets. It is the one your team trusts and checks often enough to act on.
Choose one source of truth for each metric
Metrics break when product, growth, and finance all define them differently. MRR becomes three different numbers. Churn changes depending on which customer base gets used. Meetings get lost in definition fights.
Give each KPI one owner, one definition, and one source of truth. Document it. Keep it boring.
Set reporting cadences by decision speed
Not every metric deserves daily attention. Product usage and funnel activity can be checked daily or weekly. MRR, churn, and CAC usually make more sense weekly or monthly. Strategic metrics like burn multiple or concentration risk often belong in a monthly or quarterly review.
Cadence should match action speed. If you cannot do anything with a metric every day, do not force a daily habit around it.
Segment metrics by plan, channel, and cohort
Blended averages hide problems. Segment by pricing tier, acquisition channel, and signup cohort to see what is really happening. Churn may be fine overall but terrible on one plan. CAC may be climbing only in paid search. Activation may be broken only for one ICP.
Segmentation is where dashboards stop being decorative and start becoming useful.
Common SaaS Metrics Mistakes That Skew Decisions
Bad metric math does not just create confusion. It sends you toward the wrong fix.
Mixing bookings, billings, cash, and recurring revenue
Bookings are contracted value. Billings are invoiced amounts. Cash is money collected. Recurring revenue is the normalized subscription revenue recognized over time. Those are not interchangeable.
This gets messy fast with annual prepayments. A customer paying $12,000 upfront feels great for cash flow, but it is still $1,000 in MRR, not $12,000.
Calculating churn on the wrong customer base
Churn should usually be calculated against the customer count or revenue at the start of the period. Using the wrong denominator changes the answer and makes comparisons messy.
Consistency matters more than cleverness. Pick a method, define it clearly, and stick to it.
Ignoring gross profit in LTV and payback calculations
Revenue-only LTV can make acquisition look healthier than it is. If support, infrastructure, or delivery costs are meaningful, gross margin belongs in the calculation.
Otherwise, you end up funding growth with optimistic math.
Celebrating growth while retention gets worse
This is one of the classic startup traps. New customer growth can hide worsening retention for a while. The dashboard still looks exciting. The leak just gets larger underneath.
If MRR is up but churn and GRR are getting worse, do not call that healthy growth.
How to Improve Your SaaS Performance Metrics, One Lever at a Time
Metrics improve when you pull specific levers, not when you tell the team to “optimize the funnel.”
To improve MRR and ARR
Grow recurring revenue by improving pricing, packaging, and expansion paths. Add clearer upgrade triggers. Offer annual plans where they make sense. Reduce failed payments and involuntary churn. Sometimes the fastest MRR win is not new acquisition, it is fixing revenue you were already supposed to collect.
To lower churn and lift retention
Focus on faster time to value. Tighten onboarding. Make setup clearer. Improve customer education. Shorten support response time. Build a simple at-risk signal so accounts get help before renewal is in trouble.
Retention improves when customers get value early and often. That is the whole trick.
To improve CAC and payback
Tighten channel mix around what actually converts and retains. Fix conversion bottlenecks. Improve lead qualification. Raise ACV through packaging or better targeting so acquisition cost is spread over more revenue.
Cheaper leads are not always better. Better-fit customers usually are.
To raise LTV without guesswork
Better retention, healthier expansion, and margin-aware pricing usually do more for LTV than chasing more top-of-funnel volume. If you want LTV to rise, make the relationship last longer and become more valuable over time.
Simple. Not easy, but simple.
Benchmarks, Context, and What “Good” Looks Like
Everybody wants benchmark numbers. That makes sense. The problem is that random benchmark screenshots often create more confusion than clarity.
Why benchmarks vary by stage and business model
An early product-led SaaS with low ACV will look very different from a sales-led B2B company closing six-figure contracts. SMB-focused businesses often accept higher logo churn but lower CAC. Enterprise businesses usually tolerate longer sales cycles and higher acquisition costs because expansion and retention can be stronger.
That is why sources like Maxio’s overview of SaaS metrics and NetSuite’s guide group metrics by business function and model, not just one universal threshold.
How to use benchmarks without steering into a ditch
Use benchmarks as prompts, not commandments. If your CAC payback is worse than peers, ask why. If your NRR is stronger, ask what is driving it and whether it is repeatable. Benchmarks are starting points for better questions.
Copying a number from a LinkedIn post is like grabbing a stranger’s jacket because it looked good on the hanger. It may fit. It may also make no sense on you.
Your 30-Day SaaS Metrics Review Plan
You do not need a quarter-long analytics project to get better control of your numbers. A focused 30-day reset is enough to clean up definitions, build a lean dashboard, and find one real problem worth fixing.
Week 1: audit definitions and data sources
List every metric your team already uses. For each one, define the formula, owner, source system, and reporting cadence. Fix duplicates and mismatched definitions first.
This week is not glamorous, but it matters. Shared definitions remove a shocking amount of noise.
Week 2: build a lean executive dashboard
Choose the small set of metrics that deserve regular attention: MRR or ARR, customer churn, revenue churn or NRR, CAC, CAC payback, LTV, gross margin, and one or two acquisition or product signals.
Keep it lean enough to review in one sitting. If the dashboard needs scrolling, it is probably trying to do too much.
Week 3: segment one problem area
Pick one issue, churn, CAC, or conversion, and segment it by plan, channel, or cohort. That is where hidden patterns show up. Maybe churn is concentrated in one low-price plan. Maybe paid social has decent conversion but terrible retention. Maybe one signup cohort never activated properly after a product change.
You only need one clear leak to create a valuable month.
Week 4: run one targeted fix
Choose one concrete intervention and measure it. Improve onboarding emails for a weak cohort. Add trial prompts tied to activation. Review packaging for one segment with low ARPA and high support load.
Try one thing, watch the metric, and learn fast. If you want a cleaner way to track your SaaS performance metrics and turn them into action, try AtSpart.
Frequently Asked Questions
What are the most important SaaS performance metrics to track first?
Start with MRR or ARR, customer churn, revenue churn or NRR, CAC, LTV, and retention. Those give you a usable picture of growth, customer health, and efficiency without drowning you in noise.
What is the difference between churn and retention?
Churn measures what you lose in a period. Retention measures what you keep. Customer churn focuses on accounts, while revenue retention focuses on recurring revenue, which often tells a more useful story in SaaS.
How often should you review SaaS metrics?
Some metrics deserve daily or weekly review, especially funnel activity and product usage. Core business metrics like MRR, churn, CAC, and retention usually fit a weekly or monthly cadence. Strategic efficiency metrics often make sense monthly or quarterly.
Why is NRR such a big deal in SaaS?
NRR captures how existing revenue changes after churn, downgrades, and expansion. It is powerful because it shows whether your customer base becomes more valuable over time. High NRR usually signals strong product value and healthy expansion paths.
How accurate does LTV need to be?
Accurate enough to guide decisions, not perfect enough to impress a spreadsheet. A simple, consistent, margin-aware LTV estimate is more useful than a complicated model built on shaky churn assumptions.
What makes a SaaS metric a vanity metric?
A vanity metric looks impressive but does not help you decide what to do next. Raw traffic, unqualified signups, or inflated lead counts often fall into this category if they are not tied to conversion, retention, or revenue.