New signups can make your dashboard look healthy right up until Friday afternoon, when the revenue picture still feels weirdly shaky. That usually means your saas customer retention metrics are telling a very different story than your acquisition numbers, and once you see that clearly, you stop mistaking growth for momentum.
In plain English, SaaS customer retention metrics show how well you keep customers, keep recurring revenue, and grow existing accounts after the sale. Some metrics track logos, meaning how many customers stayed. Others track dollars, meaning how much recurring revenue survived churn, downgrades, and upgrades.
Start With the Retention Problem That Sneaks Up on You
Retention problems rarely arrive with drama. More often, they show up quietly: a few customers stop logging in, a handful downgrade, one annual account declines renewal, and suddenly the month that looked fine on the first Monday feels thin by the last one.
Here’s the thing: acquisition can hide this for a while. If enough new customers keep coming in, you can miss the fact that the business leaks value every month. Retention metrics are the scoreboard for that leak. Without them, you can end up celebrating top-of-funnel wins while the actual engine underneath keeps losing pressure.
Early-stage SaaS teams especially run into this. A pricing page update boosts conversions. Paid acquisition starts working. Pipeline looks active. But if new customers never reach value, or long-time customers shrink seats before leaving, your MRR becomes harder to trust. Retention is what tells you if growth is sticking.
What SaaS Customer Retention Metrics Actually Tell You
Retention metrics answer a simple question: after customers buy, what happens next? Do you keep the account, keep the revenue, expand it, or lose it?
That sounds obvious, but the catch is that these are not the same thing. You can retain a lot of customers and still lose meaningful revenue if larger accounts downgrade. You can also lose some customers and still grow revenue if expansions from healthy accounts more than offset the losses. That’s why retention needs a small set of connected metrics, not one vanity percentage.
If you want the bigger context around how these numbers fit with the rest of your business, it helps to see retention alongside other numbers that shape SaaS growth decisions.
Customer Retention vs. Customer Churn vs. Revenue Retention
Customer retention is logo retention. It tells you what percentage of starting customers stayed over a period.
Customer churn is the flip side. It tells you what percentage left.
Revenue retention focuses on dollars instead of accounts. That means it captures downgrades and expansions, which logo retention misses. If one ten-seat account cuts down to four, the logo is still there, but your revenue took a hit.
Why Retention Matters More Than a Pretty Signup Graph
Retention makes every other growth number more trustworthy. That’s the direct claim.
If customers stay longer, CAC payback improves, MRR becomes more durable, forecasting gets less fragile, and product-market fit becomes easier to believe. A big signup graph can come from clever campaigns, discounts, or timing. Strong retention is harder to fake. Customers only stay if the product keeps solving a real problem.
The Core SaaS Customer Retention Metrics You Should Track
This is the main set. You do not need fifty metrics on one screen. You need the right handful, defined clearly and reviewed consistently.
Customer Retention Rate
Customer retention rate measures the percentage of customers you kept during a period.
Formula: ((Customers at end of period - New customers added during period) / Customers at start of period) x 100
Use it to understand logo stability at a glance. It is simple, intuitive, and useful for board updates, but it does not tell you what happened to revenue inside those accounts.
Customer Churn Rate
Customer churn rate measures the percentage of customers lost during a period.
Formula: (Customers lost during period / Customers at start of period) x 100
This belongs on the same dashboard as retention rate because the two should complement each other. If retention is 92% for the month, churn is roughly 8%, assuming the same cohort and time frame.
Revenue Churn Rate
Revenue churn rate measures the recurring revenue lost from existing customers through cancellations and downgrades.
Formula: (Revenue lost from churn and downgrades during period / Starting recurring revenue for the period) x 100
Gross revenue churn is especially useful here because it shows lost revenue before expansions offset the pain. If pricing or account mix is shifting, this number often tells the truth faster than logo churn.
Net Revenue Retention (NRR)
NRR shows how much recurring revenue from an existing customer base you kept after churn, downgrades, and expansions.
Formula: ((Starting MRR + Expansion MRR - Churned MRR - Downgraded MRR) / Starting MRR) x 100
This is a favorite board-level metric for a reason. It captures both durability and growth inside the base. If NRR is above 100%, your existing accounts are growing overall even after losses.
Gross Revenue Retention (GRR)
GRR measures how much starting recurring revenue you kept, excluding any expansion.
Formula: ((Starting MRR - Churned MRR - Downgraded MRR) / Starting MRR) x 100
Think of GRR as the no-sugarcoating metric. It tells you what stayed before upsells make the picture look better. In many cases, GRR is more revealing than NRR because it exposes product or packaging weakness that expansion might temporarily cover.
Renewal Rate
Renewal rate measures the percentage of renewable contracts that actually renewed.
Formula: (Renewed contracts / Contracts up for renewal) x 100
This matters most for annual and multi-year contracts. In enterprise SaaS, renewal rate can tell you more than monthly churn because the real decision point happens at contract expiration, not through steady month-to-month cancellation.
Existing Customer Revenue Growth Rate
This metric tracks revenue growth from your current customer base through upgrades, cross-sells, and seat expansion.
Formula: (Expansion revenue from existing customers / Starting revenue from existing customers) x 100
It connects retention to growth. You are not just asking who stayed, but who found enough value to spend more.
Average Revenue Per User (ARPU)
ARPU measures average recurring revenue per customer or account over a period.
Formula: Total recurring revenue / Total active customers
ARPU gives context to retention. If customer retention looks stable but ARPU slips for three straight months, downgrades or lower-value customer mix may be pulling revenue quality down. A deeper look at the SaaS numbers worth tracking together usually makes that easier to spot.
The Unit Economics Metrics That Support Retention Decisions
https://www.youtube.com/watch?v=s8_Vax8VUmM
Retention does not live alone. A churn number by itself can worry you or reassure you for the wrong reasons unless you also know what it means for growth efficiency.
Customer Lifetime Value (LTV or CLV)
LTV is the total revenue, or sometimes gross profit, you expect from a customer over the full relationship.
A common simple version is: ARPU x average customer lifespan
Retention has an outsized effect here. If customers stay twice as long, LTV can rise dramatically without any pricing change. That is why small retention gains often matter more than chasing one more acquisition channel.
Customer Acquisition Cost (CAC)
CAC is what you spend to acquire a new customer.
Formula: Total sales and marketing spend / New customers acquired
High CAC gets dangerous fast when retention is weak. Paying a lot to acquire customers who leave before becoming profitable is like filling a bucket with a hole in the bottom.
CAC Payback Period
CAC payback period shows how long it takes to recover acquisition cost from recurring gross profit or contribution margin.
A simplified version is: CAC / Monthly gross profit per customer
Poor retention stretches payback. If customers churn before payback happens, growth creates cash pressure instead of compounding value.
LTV:CAC Ratio
LTV:CAC ratio compares the value of a customer to the cost of acquiring that customer.
Formula: LTV / CAC
It is a useful quality check, but not one to trust blindly. Inflated LTV assumptions often come from overly optimistic retention assumptions. If your ratio looks amazing while recent cohorts are weakening, the model is lying to you.
How to Calculate SaaS Retention Metrics Without Getting Lost in the Spreadsheet
Most retention confusion comes from setup, not math. The formulas are easy. The data discipline is the hard part.
Pick the Right Time Frame First
Monthly views work well for self-serve and SMB SaaS because changes happen quickly. Quarterly and annual views matter more when contracts are larger or renewals happen less often.
The wrong window distorts the picture. A monthly churn rate can look calm in enterprise SaaS right up until a renewal quarter hits. An annual view can hide onboarding problems in a product-led business where customers decide in the first 30 days.
Use a Clean Starting Cohort
Retention works best when you measure from a fixed starting group. That could be customers active on January 1, or MRR active at the start of Q2.
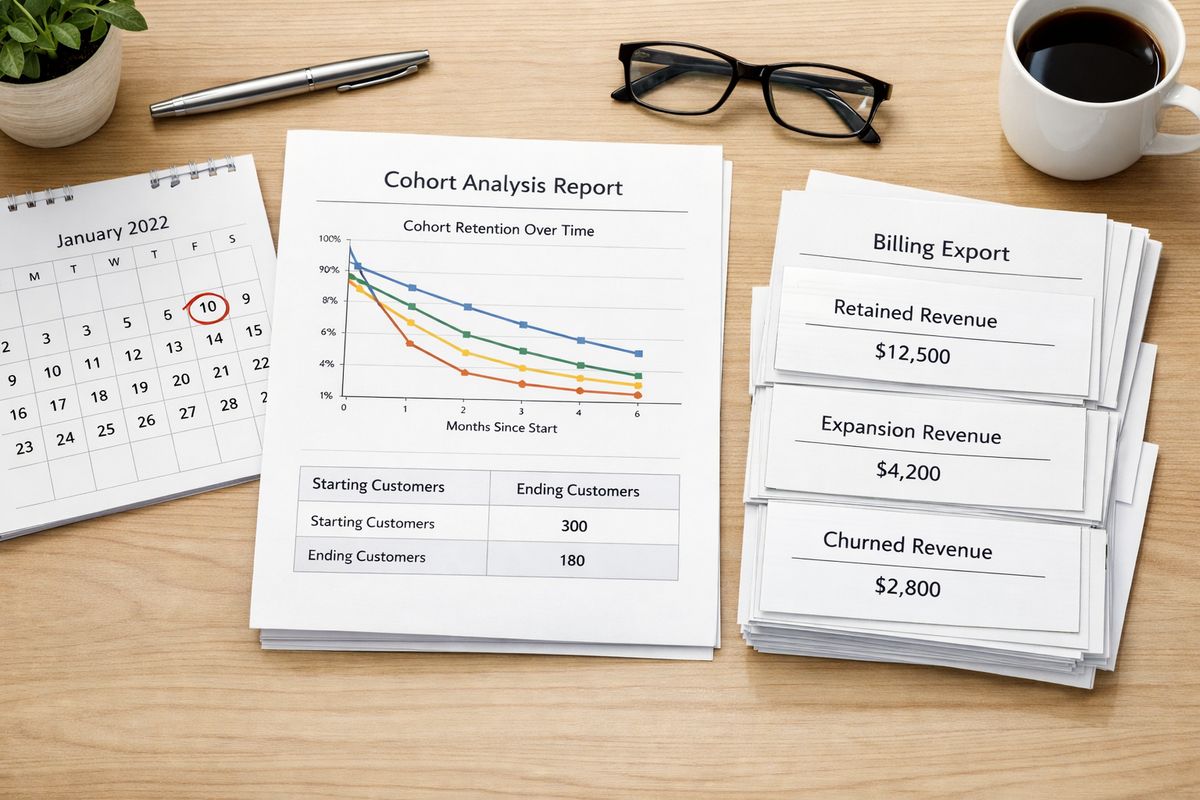
This is the basic idea behind cohort analysis. Instead of mixing old and new customers together, you follow one clean group over time and see what actually happened. If you want retention reporting to be useful, cohort views belong in the same conversation as a practical KPI dashboard for SaaS teams.
Separate New Revenue From Retained Revenue
New customer revenue should never inflate retention metrics. Neither should reactivations, upsells from newly acquired accounts, or one-off services.
Keep three buckets distinct: retained revenue, expansion revenue, and new revenue. That sounds fussy, but honestly, this one habit prevents half the dashboard arguments that waste an afternoon.
Build One Source of Truth for MRR Data
Finance, product, and revenue teams often use slightly different definitions for active customers, expansion, contraction, or even MRR itself. That is where trust in the data starts to break.
Pull from consistent systems, usually billing data first, then CRM and product usage tools for context. The goal is not perfect architecture on day one. The goal is one agreed version of the numbers that everybody uses.
What Good SaaS Retention Metrics Look Like
Everybody wants a benchmark. Fair enough. But there is no single good retention rate for all SaaS businesses.
Benchmarks by SaaS Model and Stage
Lower-priced SMB products usually see higher logo churn. That is normal. Customers have lower switching costs, smaller teams, and tighter budgets. Enterprise SaaS tends to keep revenue better because implementation is deeper, switching is harder, and account expansion is more common.
Stage matters too. Younger companies often have shakier retention because the product and ideal customer profile are still settling. Mature companies usually expect more stability, especially in GRR and renewal rates.
Healthy Ranges for NRR, GRR, and Churn
Directional guidance is still useful. NRR above 100% is a good sign, and above 110% usually points to strong expansion. GRR in the high 80s or 90s is healthier than a flashy NRR built on a few big upsells. Monthly logo churn in low single digits is often manageable for many B2B SaaS products, while persistent high-single-digit monthly churn is usually a problem.
The trick is to read ranges in context. A $29 self-serve tool and a $30,000 annual platform should not be judged the same way.
Warning Signs Hidden Behind an Average Retention Rate
Blended averages can make trouble disappear. One plan may retain beautifully while another quietly bleeds. One acquisition channel may bring loyal customers while another brings short-lived trial hunters.
If you only look at the company-wide average, you can miss the segment causing most of the damage. That is why retention should sit next to examples of SaaS KPIs that reveal business quality, not in isolation.
How to Read Retention Metrics Like an Operator, Not a Reporter
Reporting tells you what happened. Operating asks why it happened and what to fix next.
When High Retention Still Hides a Problem
High logo retention can look comforting while ARPU falls, support burden rises, or expansion concentrates in just a couple of accounts. That kind of growth is fragile.
Another common trap is strong NRR driven by a tiny group of enterprise customers while the rest of the base is flat. The headline number looks great. The business underneath may still be uneven.
When Churn Is Fine but Activation Is Broken
Sometimes customers do not leave right away because contracts, switching friction, or internal inertia keep the account alive. But usage stays shallow, adoption stalls, and expansion never comes.
That means activation is broken. Customers survived, but never fully landed. Retention metrics often reflect onboarding quality with a delay, so if expansion is weak, look back to first value and early product habits.
Segment by Plan, Persona, Region, and Acquisition Channel
This is where retention gets useful fast. Segmenting by plan can reveal packaging issues. Segmenting by persona can expose a mismatch between the product and the customer job. Segmenting by region can surface onboarding or support gaps. Segmenting by acquisition channel often reveals that one campaign brings bargain hunters who churn in month two.
Averages are easy to report. Segments are what you can actually fix.
Use Cohort Retention Curves to Find the Real Drop-Off Point
Retention curves show when customers leave. Week one. Month two. Right after a usage cap. At renewal. Following a price increase.
That timing matters. If churn spikes in the first 14 days, onboarding is the place to look. If it spikes after renewal conversations, value communication or account coverage may be the issue. If you want to go deeper, pair this with closer tracking of product adoption signals, because usage patterns usually explain the curve.
Retention Metrics That Capture Customer Health and Sentiment
Billing tells you what already happened. Health and sentiment metrics can hint at what is about to happen.
Net Promoter Score (NPS)
NPS measures how likely customers are to recommend your product. It is a simple sentiment signal, useful for spotting broad satisfaction trends.
But it is not a substitute for retention data. Customers can say nice things and still churn for budget or workflow reasons. Treat it as directional, not definitive.
Product Usage and Adoption Metrics
Usage often predicts retention better than survey responses. Logins, seat utilization, feature adoption, activation milestones, and time-to-value all help you spot healthy versus shaky accounts.
Plain English version: if customers are not using the product in the way that creates value, retention eventually notices.
Support Volume, Resolution Speed, and Escalations
Support data can become an early-warning system. Repeated tickets around one workflow, slow resolution times during onboarding, or rising escalations before renewal all point to friction that churn data will only confirm later.
This is especially helpful when combined with customer success signals tied to renewals and expansion.
How to Improve SaaS Customer Retention Metrics
Once the numbers are clear, the work becomes straightforward. Not easy, but straightforward.
Fix Onboarding Friction First
The first days matter more than most teams want to admit. If setup is confusing, data import fails, or users do not hit a clear first win quickly, later retention gets harder.
Guided workflows, templates, checklists, better setup help, and fewer dead ends can change a lot here. Think less about feature tours and more about helping customers complete one meaningful task.
Find Out Why Customers Churn
Exit reasons need structure. Cancellation flows, win-loss notes, support themes, and usage history should all feed into the same picture.
The trick is to look for patterns. One angry cancellation rarely tells you much. Twenty cancellations tied to the same missing integration tell you exactly where to look.
Create Tight Feedback Loops
Feedback becomes useful only when it loops back into action. In-app prompts, interviews, support conversations, and account reviews all create signals, but those signals need owners and follow-through.
If customers keep raising the same issue and nothing changes, retention is not a metrics problem anymore. It is an execution problem.
Reduce Involuntary Churn
Failed payments, expired cards, billing confusion, and procurement hiccups can create churn that customers never intended. This is one of the fastest fixes available.
Smart retries, clear dunning emails, easy payment updates, and cleaner billing flows often recover revenue without any product change at all.
Improve Customer Support and Self-Serve Help
Fast answers reduce frustration. Better docs reduce dependence. In-app guidance helps customers solve problems in the moment instead of opening another tab and giving up.
Support quality matters most during onboarding and renewal windows, when confidence in the product is still forming or being reassessed.
Drive Expansion From Healthy Accounts
Expansion works best when customers are already getting value. Seat growth, upgrades, and cross-sells should follow strong adoption, not pressure tactics.
If an account is barely active, upsell conversations usually just speed up churn.

Common Mistakes That Make Retention Metrics Misleading
Bad measurement leads to bad decisions. Simple as that.
Mixing Monthly and Annual Customers in One View
Contract length changes how churn shows up. Monthly customers can leave anytime. Annual customers often look stable until renewal season.
Putting both in one undifferentiated view smooths away the real behavior. Separate views are usually cleaner.
Counting Reactivations as Pure Retention
Reactivations are valuable, but they are not the same as uninterrupted retention. If you count returned customers as retained customers, your core metric starts telling a nicer story than reality.
Track reactivations separately so you can celebrate them without distorting the baseline.
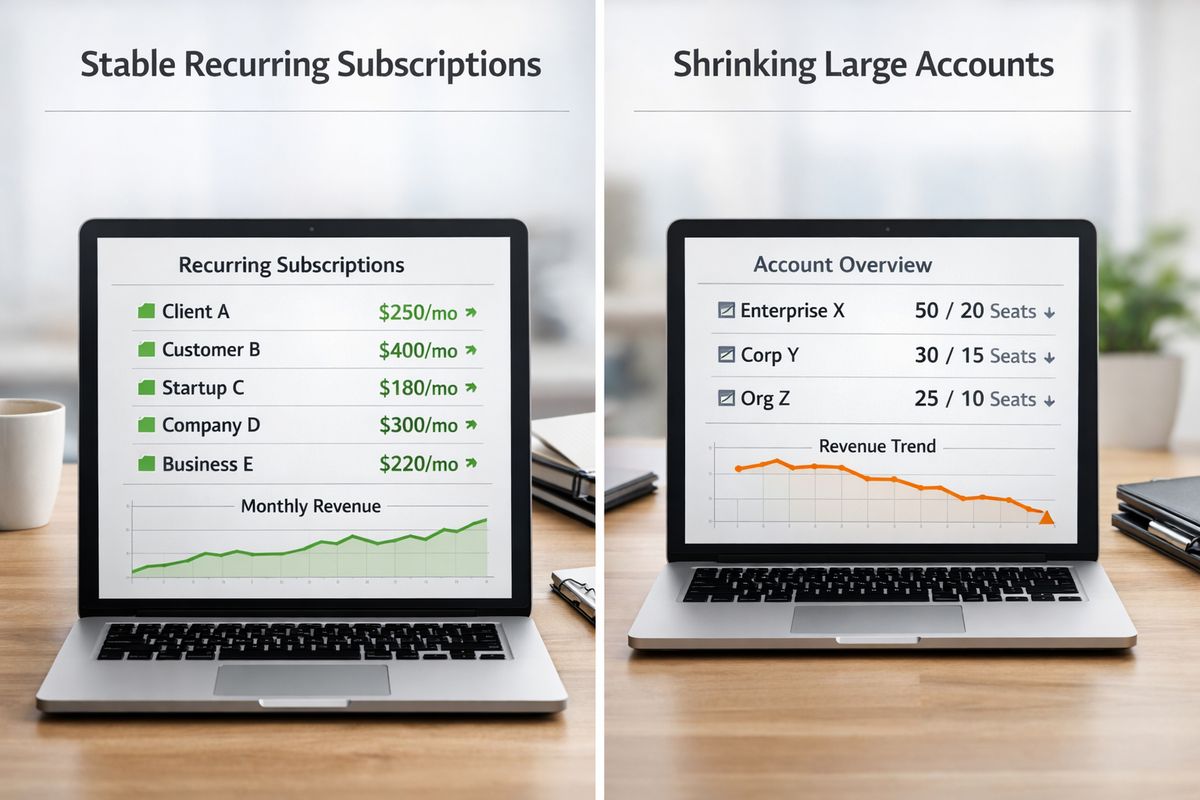
Ignoring Downgrades Because the Customer “Stayed”
A customer who stays on a smaller plan still represents revenue loss. That is why logo retention and revenue retention need to sit side by side.
Saved logos are good. Shrinking accounts still deserve attention.
Overlooking Small Segments With Outsized Revenue
A small enterprise segment or a single acquisition source can hold a huge share of your revenue risk. Looking only at account count misses that.
Weight by revenue when it matters. Ten tiny churned accounts do not always matter more than one large contraction.
Build a Retention Dashboard You’ll Actually Use
A useful dashboard should help you notice patterns fast, not bury you in widgets.
The Minimum Metrics to Put on One Page
Keep one page focused on customer retention rate, customer churn rate, NRR, GRR, ARPU, LTV, CAC payback, and two or three leading indicators such as activation rate, seat utilization, or support escalations. If a metric does not help you make a decision, it probably does not belong on the front page.
How Often to Review Each Metric
Leading indicators deserve weekly review because product friction shows up there first. Churn, retention, and revenue metrics usually make sense monthly. Cohort reviews, segment-level analysis, and benchmark checks fit better on a quarterly rhythm, when enough time has passed to see real movement instead of noise.
One Simple Next Step to Try This Week
Pick one cohort, such as customers who signed up in January after a pricing page change. Compare logo retention, revenue retention, and activation for that one group. You do not need a fancy model to start. You just need one clean slice of reality.
Frequently Asked Questions
What is the most important SaaS customer retention metric?
If you have to choose one, start with net revenue retention. It shows whether existing recurring revenue is shrinking or growing after churn, downgrades, and expansion. But it works best alongside GRR and logo retention, because one number never tells the full story.
What is the difference between NRR and GRR?
NRR includes expansion revenue, so upsells and seat growth can offset churn and downgrades. GRR excludes expansion and shows only how much starting revenue stayed. GRR is the stricter measure of revenue durability.
What is a good SaaS retention rate?
A good rate depends on your model. SMB SaaS usually has lower logo retention than enterprise SaaS because switching is easier and contracts are smaller. In general, low churn, NRR above 100%, and GRR in the high 80s or better are healthier signs than a single benchmark number taken out of context.
How often should you track retention metrics?
Leading indicators like activation and usage are worth checking weekly. Core retention and churn metrics usually belong in monthly reviews. Cohort trends and segment analysis make more sense quarterly, when you can see patterns clearly.
Can you have good customer retention but bad revenue retention?
Yes. Customers can stay while spending less through downgrades, lower seat counts, or reduced usage. That is exactly why logo retention alone can be misleading.
Which leading indicators usually predict churn earliest?
Weak activation, slow time-to-value, low feature adoption, poor seat utilization, repeated support tickets, and renewal risk signals often show trouble before churn appears in billing data.
If your retention numbers feel scattered, start simple and make them usable. Try AtSpart to track the metrics that actually move your SaaS business, spot leaks earlier, and turn retention from a vague goal into a clear operating system.