Why Every Startup Needs a Solid Sales Projection Example
A sales projection example is one of the most powerful tools a finance or RevOps leader can have — yet most startups either skip it entirely or build one that falls apart the moment it meets reality.
Here's a quick answer to what a sales projection example looks like in practice:
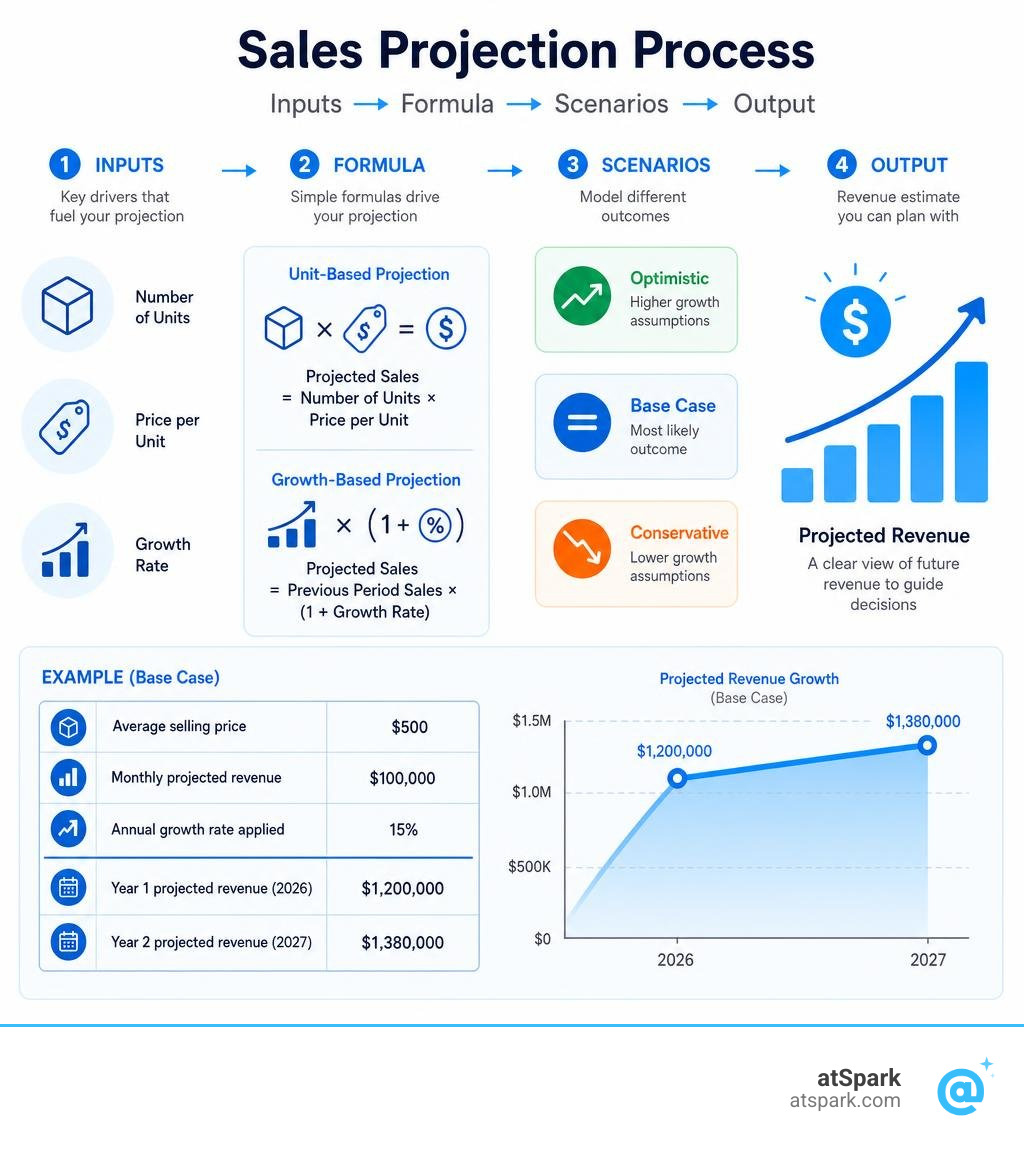
A basic sales projection example:
| Component | Example Value |
|---|---|
| Units sold per month | 200 |
| Average selling price | $500 |
| Monthly projected revenue | $100,000 |
| Annual growth rate applied | 15% |
| Year 1 projected revenue | $1,200,000 |
| Year 2 projected revenue | $1,380,000 |
The core formula is simple:
Projected Sales = Number of Units × Price per Unit
Or for growth-based projections:
Projected Sales = Previous Period Sales × (1 + Growth Rate)
But a number in a spreadsheet isn't a projection. A real projection connects your pipeline, your market assumptions, and your operating capacity into a single coherent story.
For a Finance or RevOps lead, the stakes are high. You need to answer questions like:
- Do we have enough pipeline coverage to hit our annual target?
- Can we afford to hire two more account executives next quarter?
- What happens to our cash runway if conversion rates drop by 10%?
Without a solid projection model, those questions get answered with gut feel — and that's a risk you can't afford.
According to research from monday.com, 66% of sales leaders struggle with inaccurate forecasts because their reporting systems lack access to live CRM data. And when forecasting data lives across separate tools and spreadsheets, accuracy can drop by as much as 40-60%.
This guide walks you through real sales projection examples — from a simple formula to a full B2B SaaS pipeline model — so you can build projections that actually hold up.
Understanding the Sales Projection Example: Projections vs. Forecasts
Before we dive into the calculations, we must clear up a very common point of confusion: the difference between a sales projection and a sales forecast. While many people use these terms interchangeably, they serve completely different roles in your business planning.
Think of it this way: a projection is where you want to go based on specific strategic scenarios, while a forecast is where you are actually heading based on real-time operational data.
| Feature | Sales Projection | Sales Forecast |
|---|---|---|
| Time Horizon | Long-term (typically 1 to 5 years) | Short-term (typically weekly, monthly, or quarterly) |
| Primary Purpose | Strategic planning, fundraising, capacity planning, and goal setting | Immediate operational decisions, inventory management, and cash flow tracking |
| Data Inputs | Stated assumptions, market trends, target growth rates, and macroeconomics | Active CRM pipeline data, historical conversion rates, and representative capacity |
| Update Frequency | Set annually; reviewed quarterly or when major strategic shifts occur | Updated weekly or monthly to reflect real-time changes |
| Nature | Scenario-based (e.g., Best-Case, Worst-Case, Most-Likely) | A single, highly realistic prediction of what will close |
Projections: The Tool for Strategic Planning and Scenario Modeling
A sales projection is built on "what-if" scenarios. It is designed to help you model long-term goals and map out resources. For example, if we increase our marketing spend by 20% and expand into the APAC region—which is projected to dominate B2B e-commerce with an 80% market share by 2026—what will our revenue look like in three years?
Projections allow you to build different strategic paths so you can stress-test your business model. If your conversion rate drops by 10%, how does that affect your cash runway? Projections give you those answers.
Forecasts: The Tool for Immediate Operational Decisions
On the flip side, a Sales Forecast is highly tactical. It looks at your active pipeline and calculates exactly what is likely to close in the next 30, 60, or 90 days. It doesn't care about your five-year plan; it cares about the deals your Account Executives are working on right now. Sales leaders use forecasts to manage inventory, schedule customer onboarding, and make immediate hiring decisions.
While both are essential, trying to run your weekly sales meetings with a five-year projection—or trying to raise venture capital with a 30-day forecast—is a recipe for disaster.
The Strategic Advantages of Creating Sales Projections
Why should your startup spend time building detailed sales projections? It is easy to dismiss them as "educated guesses," but a structured projection plan is the foundation of your entire business operating system.
Here are the primary advantages of building a robust sales projection model:
- Optimized Resource Allocation: If you project a 50% increase in customer acquisition next year, you can't wait until those customers sign to start hiring. Projections tell you when to hire customer success managers, when to upgrade your server infrastructure, and when to expand your sales team so you don't break your operational capacity.
- Securing Investor Credibility: Investors do not back plans built on hope. They back plans built on math. A detailed projection shows institutional investors that you understand your unit economics, your customer acquisition costs (CAC), and your market size.
- Managing Cash Runway: Startups do not fail because they run out of ideas; they fail because they run out of cash. Projections help you anticipate cash-poor months (due to seasonality or long enterprise sales cycles) so you can secure credit lines or cut operational costs before a crisis hits.
- Proactive Risk Mitigation: By running sensitivity analyses on your projections, you can prepare for market downturns, regulatory shifts, or competitor campaigns. If a new competitor cuts into your market share, you already have a "Worst-Case Scenario" playbook ready to execute.
To get started on your own documentation, you can utilize structured frameworks like this Sales Projections Template (Free Word) to formalize your assumptions.
Common Methods and Formulas to Calculate Sales Projections
There is no single "correct" way to calculate sales projections. In fact, the most accurate models combine multiple methodologies to cross-reference and validate the numbers.
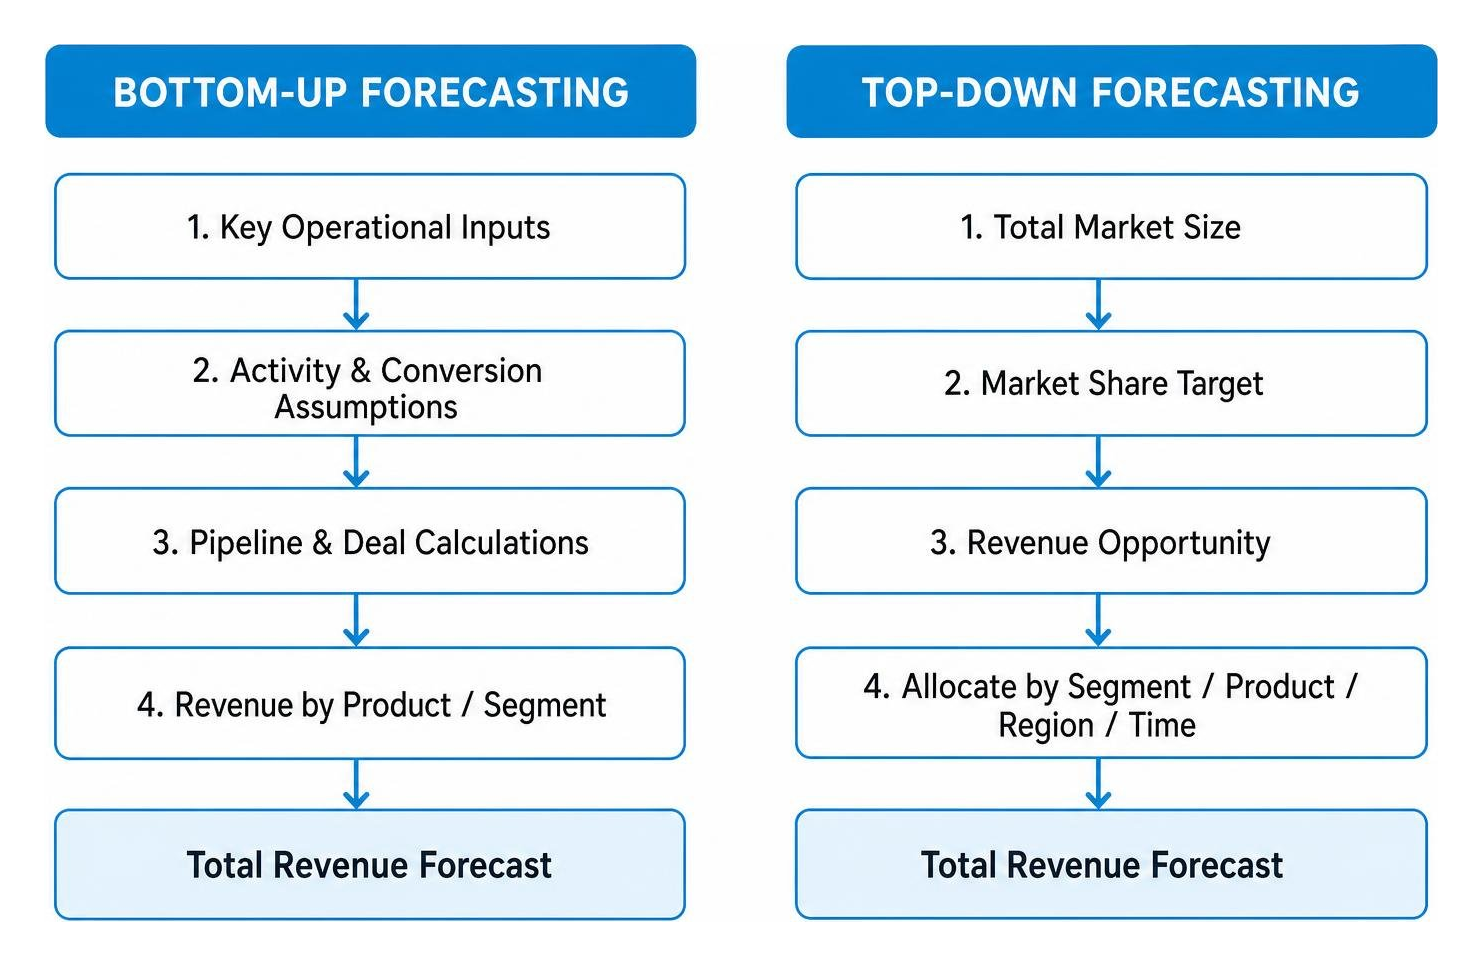
Let's break down the four most common methods used by modern businesses:
1. Bottom-Up Forecasting
Bottom-up forecasting starts with the smallest operational metrics and builds up to a total revenue projection. It is highly detailed and grounded in your actual capacity. You look at your average website traffic, your lead-to-opportunity conversion rate, the number of sales reps you have, and your average deal size.
Because it is built on real performance metrics, bottom-up forecasting is incredibly reliable for short-to-medium-term planning.
2. Top-Down Forecasting
Top-down forecasting starts with the total market size (Total Addressable Market, or TAM) and estimates what percentage of that market your business can realistically capture. For example, if the global B2B e-commerce market is projected to reach $36 trillion by late 2026, a top-down approach would estimate capturing 0.001% of that market to reach a $360 million projection.
While top-down modeling is useful for validating market opportunities and pitching to investors, it can easily suffer from overoptimism if it is not balanced by a bottom-up reality check.
3. Historical Trending
If your business has been operating for more than a year, you can use historical sales data as a baseline. You analyze your year-over-year (YoY) growth rates, identify patterns, and project those trends into the future.
However, historical trending has a major blind spot: it assumes the future will look exactly like the past. It cannot predict market disruptions, new competitor entries, or sudden shifts in customer behavior.
4. Regression Analysis
For startups with access to advanced data analytics, regression analysis is a mathematical method used to project future sales by identifying relationships between variables. For example, you might discover a direct correlation between your Google Ad spend, local economic indicators, and monthly sales. By modeling these variables, you can create highly sophisticated, predictive projections.
How to Calculate a Basic Sales Projection Example
Let's look at a concrete, step-by-step mathematical example of how to calculate a basic sales projection.
Imagine we run a B2B software company. We want to calculate our projected sales for the upcoming year using a bottom-up, growth-based approach. We will start with our unit sales and average selling price, then apply our expected growth rate.
Step 1: Establish your baseline metrics
- Previous Year Sales (baseline): $500,000
- Average Selling Price (ASP): $2,500 per annual license
- Units Sold (licenses): 200
Step 2: Define your growth assumptions We plan to launch a new marketing campaign and hire one additional sales rep. Based on historical conversion rates, we expect our unit sales to grow by 15% next year.
Step 3: Calculate projected unit sales $$\text{Projected Units} = \text{Current Units} \times (1 + \text{Growth Rate})$$ $$\text{Projected Units} = 200 \times (1 + 0.15) = 230 \text{ units}$$
Step 4: Calculate basic projected revenue $$\text{Projected Revenue} = \text{Projected Units} \times \text{Average Selling Price}$$ $$\text{Projected Revenue} = 230 \times \$2,500 = \$575,000$$
Alternatively, you can calculate this directly using the growth-based formula: $$\text{Projected Revenue} = \text{Previous Period Sales} \times (1 + \text{Growth Rate})$$ $$\text{Projected Revenue} = \$500,000 \times 1.15 = \$575,000$$
To practice modeling different unit prices, costs, and margins, tools like this Sales Forecast Profit Predictor Excel & Sheets Template - Accounting by Ms Biz can help beginners build confidence using simple "napkin finance" frameworks.
Adjusting for Internal and External Variables
A basic formula is a great starting point, but business does not happen in a vacuum. To make your projections realistic, you must adjust your baseline calculations for both internal and external variables.
- Seasonality: Almost every industry has seasonal peaks and valleys. An e-commerce brand might make 40% of its revenue in Q4, while a B2B SaaS company might see sales freeze in July and August as buyers go on vacation. If you apply an annual growth rate evenly across all 12 months, your monthly cash flow projections will be wildly inaccurate.
- Market Trends and Competitor Actions: Keep a close eye on industry reports and search trends. If a major competitor launches a massive price-cutting campaign, your close rates may drop. Conversely, if a new regulation forces companies to adopt software like yours, your sales could spike.
- Macroeconomic Factors (Inflation & Pricing Shifts): If your suppliers raise prices or if inflation remains high, you may need to adjust your average selling price. For instance, many multi-year models apply a standard 2% annual price increase and a corresponding 2% expense inflation factor to keep their margins realistic over a five-year horizon.
To see how these variables interact over a longer timeframe, you can review a complete model like this 5-Year Financial Projection Overview | PDF | Finance & Money Management | Technology & Engineering to see how price increases and cumulative inflation are modeled across integrated financial statements.
A Real-World B2B SaaS Sales Projection Example
For subscription-based B2B SaaS startups, projecting sales is a bit more complex than simply multiplying units by price. We have to account for recurring revenue, pipeline stages, and the probability of closing deals at different phases of the sales funnel.
Let's build a real-world B2B SaaS sales projection example based on a weighted pipeline.

The Setup:
- Business Model: B2B SaaS (Enterprise Contract)
- Average Deal Size: $50,000 annual contract value (ACV)
- Active Deals in Pipeline: 115 deals
- Total Raw Pipeline Value: $5,750,000
If we simply projected that we would close all $5.75M in our pipeline, we would be out of business by next quarter. Instead, we must apply a Deal Win Probability to each stage of our Sales Pipeline based on historical conversion rates.
The Weighted Pipeline Projection Model:
| Pipeline Stage | Number of Deals | Raw Value ($) | Deal Win Probability (%) | Weighted Projection ($) |
|---|---|---|---|---|
| Discovery / Qualification | 45 | $2,250,000 | 10% | $225,000 |
| Demo Completed | 30 | $1,500,000 | 30% | $450,000 |
| Proposal Sent | 20 | $1,000,000 | 50% | $500,000 |
| Negotiation / Legal | 15 | $750,000 | 75% | $562,500 |
| Verbal Commit | 5 | $250,000 | 90% | $225,000 |
| TOTALS | 115 | $5,750,000 | - | $1,962,500 |
By calculating the Weighted Pipeline, we discover that our realistic, risk-adjusted sales projection is $1,962,500—not the raw $5.75M.
This gives us a clear picture of our expected ARR (Annual Recurring Revenue) and MRR (Monthly Recurring Revenue) growth. It also tells us if we have enough Pipeline Coverage. If our annual target is $3M, and our weighted pipeline is only $1.96M, we know we need to ramp up marketing efforts to generate more leads.
Building a Multi-Year Sales Projection Example for Investors
When you are raising capital, investors want to see how your SaaS metrics scale over a 3-to-5-year period. They will look for a logical flow between your revenue, your Cost of Goods Sold (COGS), and your operating expenses.
To see what a fully integrated, multi-year model looks like on paper, check out the ABC Company Projected Income Statement For the years ending on 2025 - 2029. This document illustrates how sales projections flow directly into your balance sheet and cash flow statements, including complex calculations like Net Present Value (NPV) and sensitivity analyses.
Additionally, you can examine this Year 2 and 3 Sales Projections | PDF | Business Economics | Financial Accounting to understand how to structure monthly and quarterly unit sales growth over a multi-year horizon.
If you are a founder looking for a clean, battle-tested framework, we highly recommend utilizing A Founder-Approved Sales Projections Template | Jumpstart Partners to build out your bottoms-up SaaS or service agency models with confidence.
Common Mistakes to Avoid in Sales Projections
Even the most experienced RevOps and finance leaders can fall into common forecasting traps. When building your models, make sure you actively guard against these mistakes:
- The Overoptimism Bias (The "Hockey Stick" Curve): We have all seen it—the projection chart where revenue flatlines for two years and then magically shoots straight up to the moon in year three. Investors call this the "hockey stick" projection, and they usually reject it on sight. Ground your growth rates in real-world operational changes, not wishful thinking.
- Operating in Data Silos: When marketing, sales, and finance do not talk to each other, projections break. Marketing might project a massive influx of leads, but if the sales team does not have the headcount to follow up on those leads, that projected revenue will never materialize.
- Ignoring Subscription Churn: In SaaS, it is easy to get hyper-focused on new customer acquisition. But if you are losing 5% of your customers every month, your growth will quickly plateau. Your projection models must account for customer churn and net revenue retention (NRR) to be accurate.
- Confusing Projections with Quota Attainment: Your sales team's quotas should be stretch targets designed to motivate them. Your sales projections, however, must remain grounded in conservative reality. If you build your financial budgets assuming 100% of your sales reps will hit 100% of their quota every month, you will quickly run out of cash.
Frequently Asked Questions About Sales Projections
How often should a startup update its sales projections?
A startup should formally review and re-forecast its sales projections quarterly to align with strategic planning and board meetings. However, you should track your actual performance against the projection monthly using a rolling forecast. This allows you to spot negative variances early and adjust your spending before it impacts your cash runway.
What is the difference between top-down and bottom-up projections?
- Top-down projections start with the total market size (TAM) and assume your business will capture a specific percentage of that market. It is highly aspirational and great for identifying long-term opportunities.
- Bottom-up projections start with your actual operational capacity and unit-level economics (e.g., website traffic, conversion rates, sales headcount). It is highly realistic and serves as the foundation for your daily business operations.
Can a sales projection be used for a bank loan application?
Yes. Lenders and commercial banks require detailed sales projections to assess your ability to repay debt. However, unlike informal spreadsheets, banks often require a formal, signed sales projection document.
This document establishes your financial covenants and defines specific variance thresholds (usually 10% to 15%). If your actual performance drops below these thresholds, it can trigger a technical default under your loan agreement, making clean, accurate data absolutely critical.
Conclusion
At the end of the day, a sales projection example is only as good as the data that feeds it. If your customer data, billing history, and pipeline metrics live across five different spreadsheets and three disconnected software platforms, your projections will always be an "educated guess."
That is why we built atSpark.
atSpark is an AI-powered conversational analytics platform designed specifically for SaaS companies. By unifying your billing, CRM, and subscription data into a single source of truth, atSpark eliminates data silos and spreadsheet errors.
Instead of spending days writing complex SQL queries or building fragile Excel models, you can simply ask atSpark plain-English questions like:
- "What was our average deal size by region over the last two quarters?"
- "Show me our weighted pipeline projection for next quarter compared to actuals."
- "What is our projected MRR for the next 12 months if our churn rate drops to 2%?"
In seconds, atSpark generates clean, accurate charts, tables, and predictive insights—giving your RevOps, finance, and sales teams the clarity they need to make confident decisions.
Ready to take the guesswork out of your revenue planning? Explore our Sales Forecast resources and see how atSpark can help you build a data-driven financial machine.