What ARPU Meaning Tells You About Your Business Health
ARPU meaning — Average Revenue Per User — is a financial metric that measures how much revenue your business generates from each active customer over a defined time period.
Quick answer:
ARPU = Total Revenue ÷ Number of Active Users (measured monthly, quarterly, or annually)
Here's what that looks like in practice:
- A SaaS company with $100,000 in monthly revenue and 5,000 active customers has an ARPU of $20/month
- A streaming platform with $50,000 in monthly revenue and 10,000 active users has an ARPU of $5/month
ARPU is one of those metrics that looks simple on the surface. Divide revenue by users, done. But for a finance or RevOps lead, it's actually one of the most revealing signals in your entire metric stack.
It tells you whether your pricing is working. It tells you whether growth is real or just a vanity number. A million new signups means nothing if each one generates pennies.
ARPU is especially critical in subscription-based businesses — SaaS, telecom, media, mobile apps — where the economics depend on squeezing sustainable revenue from an existing user base rather than selling a physical product at a one-time margin.
It's also worth knowing upfront: ARPU is not a GAAP measure. Companies are not legally required to report it, and different companies define it differently. That inconsistency matters, especially when you're benchmarking against competitors or making investor presentations.
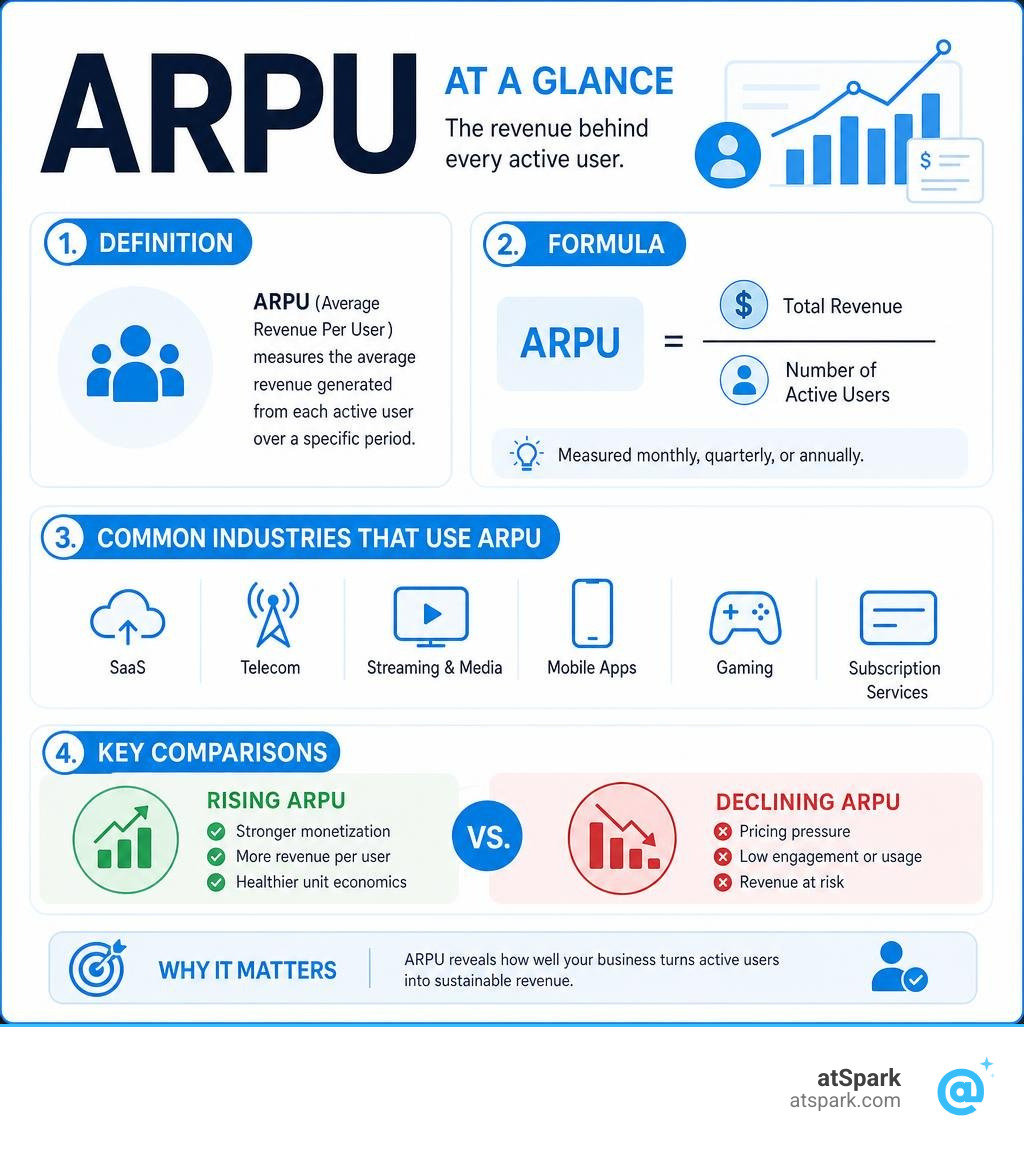
What is the ARPU Meaning?
To fully unpack the arpu meaning, we must look at both its literal definition and its historical origins. The formal ARPU | English meaning - Cambridge Dictionary definition specifies it as the average revenue generated per user or unit. In our own ARPU Glossary Definition, we highlight it as a cornerstone performance indicator for subscription-native businesses.
While SaaS companies treat ARPU as their North Star today, the metric actually originated in the telecommunications sector. Early telecom companies relied heavily on ARPU to measure the health of their massive, capital-intensive networks. They needed to understand if individual subscribers were generating enough cash to offset the immense costs of building cell towers and laying fiber-optic cables.
In telecom, the metric is often divided into two primary categories: prepaid and postpaid models.
- Prepaid ARPU represents "pay-as-you-go" customers who buy credits in advance.
- Postpaid ARPU represents contract-based customers who receive a bill at the end of each billing cycle.
A classic real-world example of this dynamic is T-Mobile. Between 2013 and early 2024, T-Mobile witnessed a fascinating structural shift. Their prepaid ARPU contribution rose steadily from 28.25% to 37.18%, while their postpaid ARPU declined from 54.5% to 48.79%. This shift highlights how consumer preferences can change over a decade, directly impacting how telecommunications giants package and price their services.

The Core ARPU Meaning in Subscription Businesses
In modern subscription and digital media businesses, the arpu meaning has evolved. It is no longer just about network usage; it is a measure of user monetization efficiency. For a detailed breakdown of how this operates at scale, the Average revenue per user Wikipedia entry illustrates how digital platforms rely on this metric to balance active user counts with recurring revenue.
For subscription models, ARPU represents the regular financial contribution of an active user. It connects pricing strategies directly to customer behavior. If you increase your prices, add premium tiers, or successfully upsell your existing user base, your ARPU will rise. Conversely, if you offer deep discounts to acquire a high volume of low-value users, your ARPU will drop—even if your total user count looks impressive on a slide deck.
Why Understanding ARPU Meaning Matters for Investors
If you want to know why Wall Street cares so much about ARPU, look no further than the social media landscape. For free-to-play or ad-supported platforms, ARPU is the ultimate proxy for monetization efficiency, and it has a massive, direct correlation with market capitalization.
Consider the stark contrast between two social media giants in 2024:
- Meta reported a Q2 2024 ARPU of $11.89 (up from $10.93 in Q2 2023). Backed by this highly efficient monetization machine, Meta's market capitalization reached a staggering $1.32 trillion as of September 2024.
- Snap reported a Q2 2024 ARPU of $2.86 (up from $2.69 in Q2 2023). Despite having hundreds of millions of highly engaged users, Snap's lower monetization rate per user contributed to a much smaller market capitalization of $15.49 billion as of September 2024.
This comparison demonstrates that a company's market valuation is not just about how many users you have; it is about how effectively you monetize them. Investors use ARPU as a foundational input for financial forecasting, using it to run scenario tests, evaluate expansion potential, and project future cash flows.
How to Calculate Average Revenue Per User
Calculating your ARPU is straightforward once you have the right data. The standard formula requires two inputs: your total revenue generated over a specific timeframe and the average number of active users during that same period.
The standard guides, such as the ARPU Meaning: How To Calculate Average Revenue Per User (2026) - Shopify Canada resource, emphasize that consistency in your timeframe is key. Most companies calculate ARPU on a monthly basis, aligning it directly with their MRR Glossary Definition (Monthly Recurring Revenue). However, you can also calculate it quarterly or annually to smooth out seasonal fluctuations.

The basic formula is:
$$\text{ARPU} = \frac{\text{Total Revenue Generated in Period}}{\text{Average Number of Active Users in Period}}$$
Step-by-Step ARPU Calculation Example
Let's walk through a practical scenario to see how this works, and why using a simple "end-of-month" user count can distort your metrics.
Imagine a B2B SaaS startup with the following metrics for the month of June:
- Monthly Recurring Revenue (MRR): $100,000
- Users at the start of June: 4,800
- Users at the end of June: 5,200
If you simply divide the $100,000 by the 5,200 users at the end of the month, you get an ARPU of $19.23. However, this fails to account for the fact that those 400 new users signed up gradually throughout the month, and did not contribute a full month's worth of revenue.
To avoid this denominator distortion, you should calculate the average number of active users during the period:
$$\text{Average Users} = \frac{\text{Starting Users} + \text{Ending Users}}{2}$$
$$\text{Average Users} = \frac{4,800 + 5,200}{2} = 5,000$$
Now, apply the true ARPU formula:
$$\text{ARPU} = \frac{\$100,000}{5,000} = \$20.00$$
By using the average user count, you get an accurate, undistorted view of your unit economics. Additionally, remember to strictly exclude free trial users and freemium accounts from this denominator—if they aren't paying, they shouldn't be diluting your paying user metrics.
Common Pitfalls in ARPU Calculations
While the math is simple, it is incredibly easy to make mistakes that render your ARPU data useless. According to the strategic guide on How To Use ARPU To Grow Subscription Revenue Per User - Zuora, businesses frequently stumble on three major pitfalls:
- Mixing Free and Paid Users: If you run a freemium model, including free users in your standard ARPU calculation will artificially deflate the metric. Keep your free users in a separate bucket and calculate a dedicated "Average Revenue Per Paying User" (ARPPU) instead.
- Combining One-Time Fees and Recurring Revenue: Including large, upfront, one-time setup fees or professional services in your core ARPU calculation creates temporary spikes that mask your true recurring monetization trends. For a pure subscription view, exclude these one-time fees, or track them in a separate "All-In ARPU" metric.
- Ignoring Segmentation: Relying solely on a single, company-wide ARPU average can hide dangerous underlying trends. For example, your overall ARPU might look stable because a few enterprise accounts are expanding, while your self-serve customer base is quietly churning. Always segment your ARPU by pricing tier, geographic region, and acquisition channel.
ARPU vs. Other Key SaaS Metrics
To understand your company's unit economics, you cannot look at ARPU in a vacuum. It must be analyzed alongside other critical SaaS Growth Metrics, SaaS Metrics to Track, and SaaS Business Metrics.
| Metric | What It Measures | Ideal Use Case |
|---|---|---|
| ARPU (Average Revenue Per User) | Average revenue generated per active user over a specific, short-term timeframe (usually monthly). | Evaluating immediate pricing tiers, monetization efficiency, and short-term trends. |
| LTV (Lifetime Value) | The total projected revenue a single customer will generate over their entire relationship with your business. | Long-term financial planning, forecasting, and calculating marketing ROI. |
| ARPPU (Average Revenue Per Paying User) | Average revenue generated strictly from paying customers, excluding free users. | Analyzing freemium software, mobile apps, and ad-supported platforms with free tiers. |
| ARPDAU (Average Revenue Per Daily Active User) | Average revenue generated from daily active users on a single day. | Tracking hyper-casual mobile games, ad-heavy social media, and highly transactional apps. |
ARPU vs. LTV and CAC
The relationship between ARPU, Customer Lifetime Value (LTV), and Customer Acquisition Cost (CAC) is the foundation of SaaS sustainability.
While ARPU provides a short-term snapshot of monetization (e.g., $50 per month), your LTV Glossary Definition projects the total value of that customer over their lifetime (e.g., $50/month multiplied by an average customer lifespan of 24 months = $1,200 LTV).
To ensure your business model is actually profitable, you must compare these metrics against your CAC Glossary Definition (the cost to acquire a customer). A healthy business requires a strong LTV to CAC Ratio, typically targeting 3:1 or higher. If your ARPU is too low, you will struggle to recover your CAC, forcing you to acquire an unsustainable volume of customers just to break even.
ARPU vs. ARPPU and ARPDAU
For businesses that offer free tiers, the standard ARPU metric can be highly misleading.
In a freemium model—such as a mobile gaming app or a collaborative SaaS tool—only a small percentage of users actually spend money. If you have 1,000,000 users but only 10,000 of them pay, your standard ARPU will look incredibly low.
By switching your focus to ARPPU (Average Revenue Per Paying User), you isolate your paying customer cohort to see if they are spending enough to support the infrastructure costs of your free users.
Similarly, ARPDAU (Average Revenue Per Daily Active User) is invaluable for highly transactional, ad-supported, or gaming apps where user engagement fluctuates daily. It helps product teams understand how immediate changes—like launching a weekend in-game event or tweaking ad placements—impact daily revenue generation.
Actionable Strategies to Increase Your ARPU
You are fighting an uphill battle if you are not actively working to increase your ARPU. Relying solely on raw user acquisition to grow is incredibly expensive. Increasing the amount of revenue you generate from your existing customer base is a much more efficient path to profitability.
According to the comprehensive guide on What Is Average Revenue Per User (ARPU)? | Stripe, optimizing your monetization requires a mix of strategic pricing, smart product packaging, and deep customer engagement.

To systematically lift your ARPU, we can categorize our monetization levers into three main pillars:
- Pricing Levers: Redesigning plans, introducing usage-based tiers, and localizing pricing.
- Monetization Levers: Offering modular add-ons, cross-selling complementary products, and feature-gating.
- Retention Levers: Reducing churn among high-value cohorts and converting free trials to paid.
Tiered Pricing and Upselling
One of the fastest ways to lift ARPU is to transition from flat-rate pricing to a tiered, value-based pricing structure.
Instead of charging everyone the same flat fee, create distinct tiers designed around specific customer personas. For example, you might offer:
- Starter Tier: Basic features for small teams or individuals.
- Professional Tier: Advanced features and automation for growing businesses.
- Enterprise Tier: Premium security, dedicated support, and custom integrations.
By highlighting a recommended "Professional" tier with visual cues, you create a natural upselling path. As your customers grow and their needs become more complex, they will naturally upgrade themselves to higher-value plans, lifting your average contract value without requiring manual sales intervention.
Cross-Selling and Add-Ons
You don't always have to force customers into a more expensive plan to increase their spend. Instead, offer modular, a la carte features or add-ons that users can buy to customize their experience.
For example, a project management tool might offer:
- Advanced time-tracking as a $5/month add-on.
- Extra cloud storage space for $10/month.
- Pre-built industry templates for a one-time fee.
This modular approach allows price-sensitive customers to stay on lower tiers, while power users can easily customize their setup with high-margin add-ons, steadily driving up your overall ARPU.
Optimizing Freemium and Trial Conversions
If you offer a free trial or a freemium version of your product, your trial-to-paid conversion rate is a massive lever for ARPU growth.
To optimize this flow:
- Audit your free plans: Ensure you aren't giving away too much value for free. If users can solve all their problems without ever paying you, they have no incentive to upgrade.
- Implement smart feature gating: Clearly show locked, premium features within the user interface to spark curiosity and highlight the value of upgrading.
- Gather continuous customer feedback: Use surveys to understand why trial users fail to convert, and use those insights to refine your onboarding and highlight your product's core value early in the user journey.
Frequently Asked Questions
What is a good ARPU for SaaS?
There is no single "good" ARPU benchmark because it depends entirely on your target market and sales model. A self-serve, consumer-facing SaaS (like a meditation app) might have a successful ARPU of $10 to $20 per month. Meanwhile, an enterprise-focused B2B SaaS company targeting large corporations might view $500 to $5,000 per month as a healthy ARPU range. A good ARPU is one that steadily improves over time, comfortably covers your CAC, and supports a highly profitable LTV-to-CAC ratio.
Should ARPU include one-time setup fees?
For a pure, predictable view of your subscription health, most finance teams exclude one-time setup, onboarding, or professional services fees from their core ARPU calculations. Including them can artificially inflate your metrics and make subscription forecasting difficult. However, many companies maintain two distinct views: a "Subscription ARPU" (which only includes recurring charges) and an "All-In ARPU" (which includes all commercial revenue streams) to get a complete picture of customer spend.
How does churn affect ARPU?
The relationship between customer churn and ARPU is highly dynamic and can sometimes produce counterintuitive results. For example, if you lose a large number of low-paying, high-churn customers while retaining your high-paying enterprise accounts, your overall ARPU will actually rise—even though your total user count and revenue are shrinking. This is why you must never analyze ARPU in isolation. Always track it alongside net customer additions, total revenue, and overall churn rates to ensure your growth is healthy.
Conclusion
Understanding the arpu meaning is only the first step. The real challenge lies in tracking, analyzing, and acting on this metric without getting bogged down in messy spreadsheets, complex SQL queries, or waiting days for your engineering team to build a custom dashboard.
That is exactly why we built atSpark.
atSpark is an AI-powered analytics platform designed specifically for SaaS companies. By unifying your billing, CRM, and subscription data into a single source of truth, we eliminate the friction of modern data analysis.
With atSpark, you don't need to write SQL or configure complex tracking models. You can simply ask plain-English questions like:
- "What was our ARPU by pricing tier last quarter?"
- "Show me a chart of our ARPU vs. CAC for our enterprise segment."
- "Which customer cohort has the highest ARPU growth this month?"
Our platform instantly generates the charts, tables, and actionable insights you need to make fast, data-driven decisions.
Ready to stop guessing and start optimizing your monetization? Explore our ARPU Glossary Definition to learn more, or get started with atSpark today to unlock conversational, governed analytics for your entire team.