Why the ARPU vs CLV Comparison Matters for SaaS Revenue Strategy
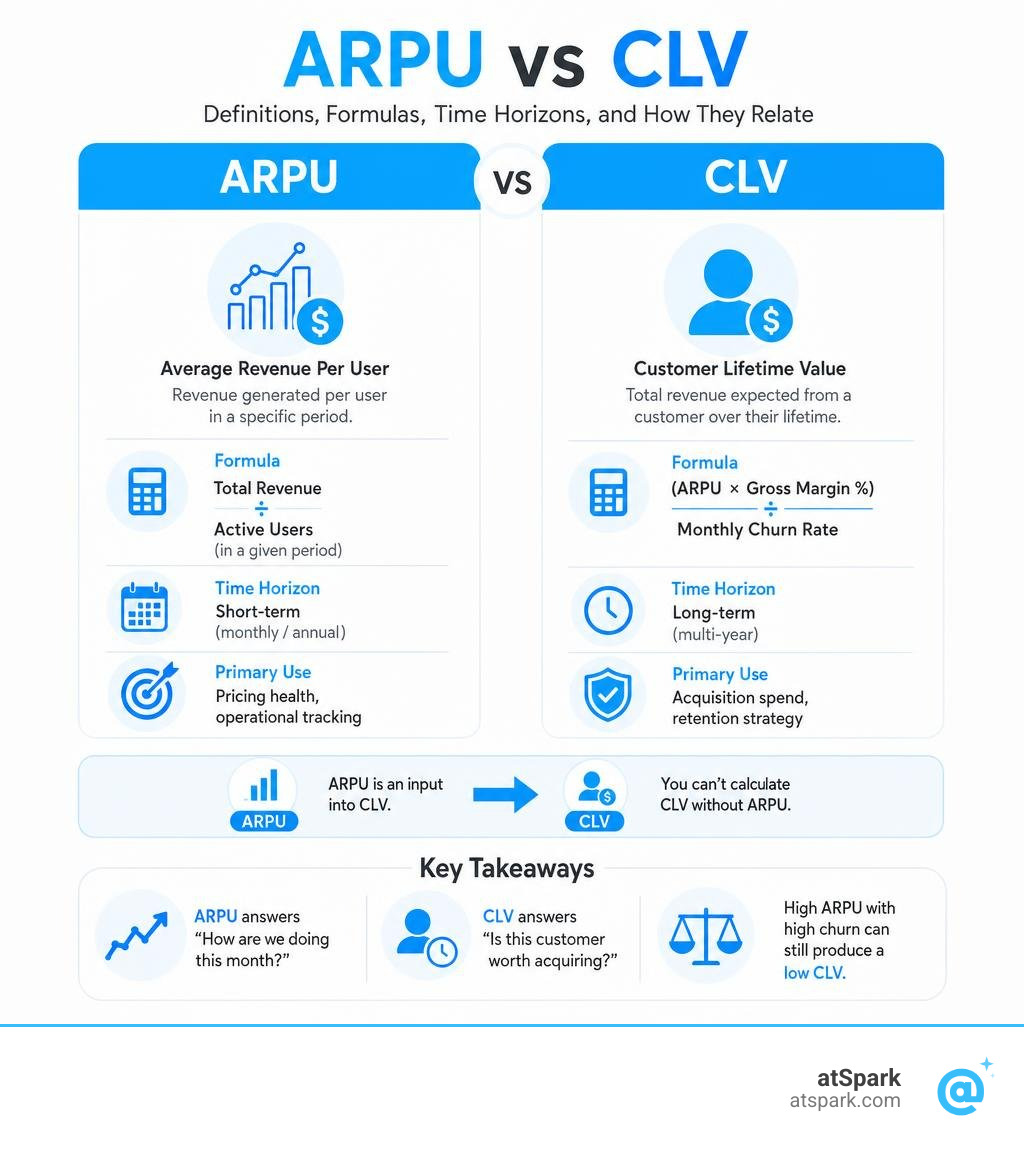
An ARPU vs CLV comparison reveals two fundamentally different ways of measuring customer value — one tells you what customers are worth right now, the other tells you what they're worth over their entire lifetime.
Here's the quick answer:
| Metric | What It Measures | Time Horizon | Primary Use |
|---|---|---|---|
| ARPU | Average revenue per user in a set period | Short-term (monthly/annual) | Pricing health, operational tracking |
| CLV | Total revenue expected from a customer over their lifetime | Long-term (multi-year) | Acquisition spend, retention strategy |
The key differences at a glance:
- ARPU = Total Revenue ÷ Active Users (in a given period)
- CLV = (ARPU × Gross Margin %) ÷ Monthly Churn Rate
- ARPU is an input into CLV — you can't calculate CLV without it
- ARPU answers "how are we doing this month?" — CLV answers "is this customer worth acquiring?"
- A high ARPU with high churn can still produce a low CLV
For RevOps and finance leads, both metrics are essential — but they answer different questions and drive different decisions.
Most teams track ARPU because it's easy to pull. Far fewer build a defensible CLV model. That gap is costly: without CLV, you can't set rational acquisition budgets, justify retention investments, or know which customer segments actually drive long-term profit.
This guide breaks down exactly how the two metrics differ, how they connect, and how to use both together to make smarter revenue decisions.
The Fundamental Differences in an ARPU vs CLV Comparison
When we look at our revenue dashboard, it is easy to treat every positive trend line with equal excitement. However, confusing immediate cash inflow with long-term enterprise value is one of the fastest ways to derail our growth strategy. To keep our unit economics balanced, we must establish a clear boundary between our short-term operational snapshots and our long-term strategic forecasts.
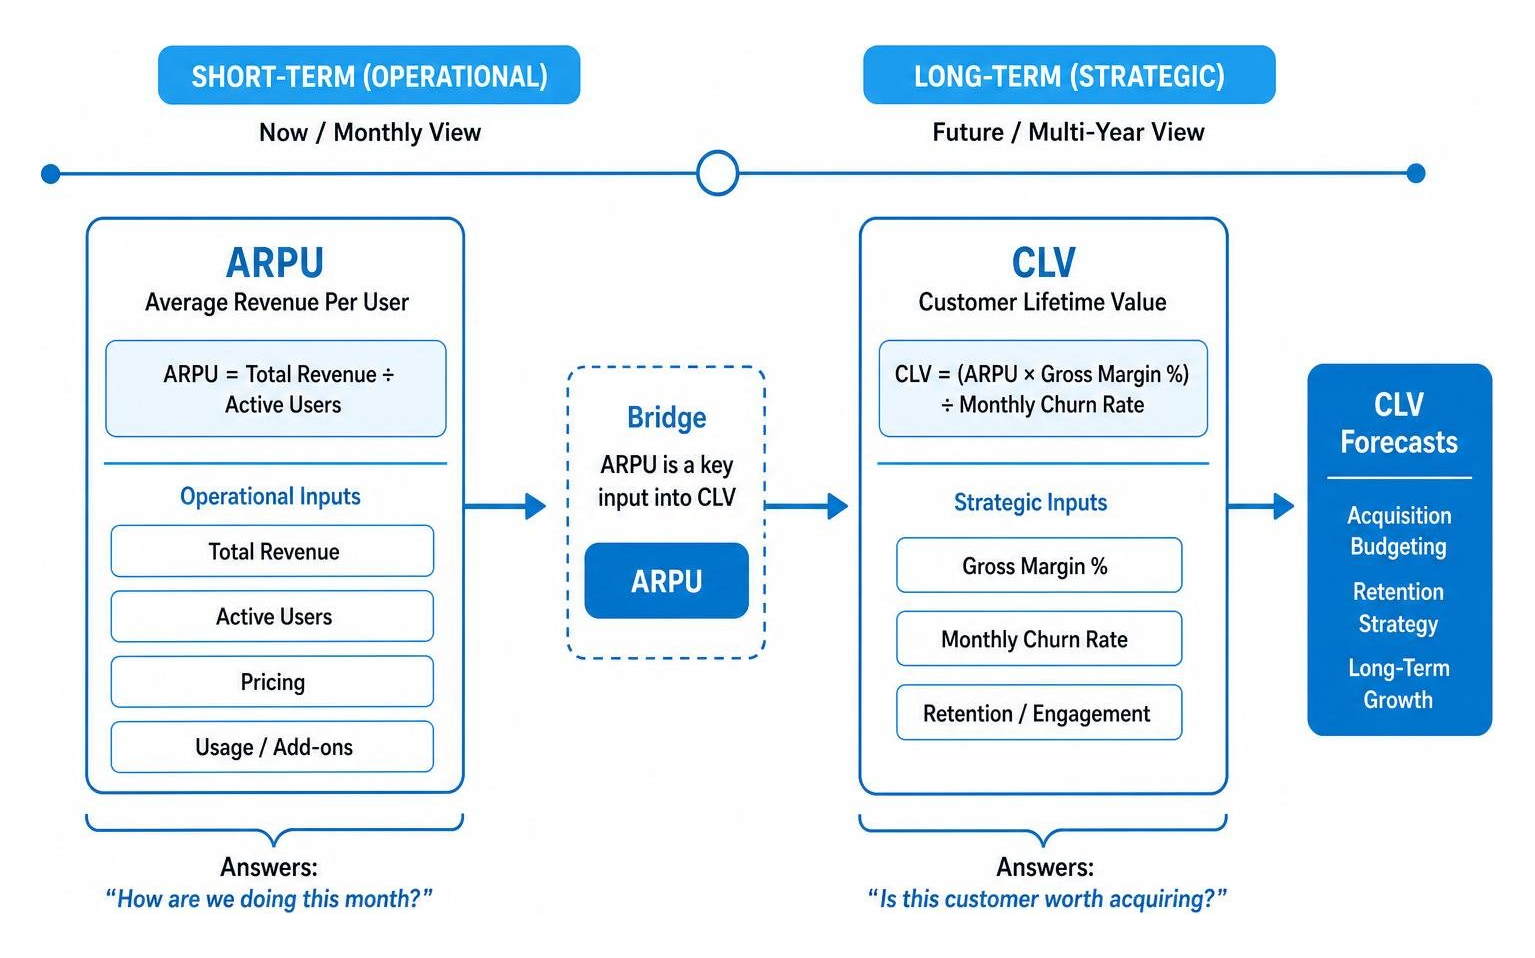
The core distinction in an arpu vs clv comparison lies in the time horizons they measure and how we act on them. As explored in the comprehensive guide on ARPU VS CLV Understanding The Differences And Implications , ARPU acts as a diagnostic health check of our current monetization mechanics, while CLV serves as a predictive compass for our future financial health.
ARPU: The Short-Term Operational Snapshot
Average Revenue Per User (ARPU) answers a simple but vital question: On average, how much revenue is an active customer generating for us within a specific, closed timeframe?
Because it focuses on a discrete period—usually a month or a year—it is highly sensitive to immediate operational changes. If we roll out a new pricing tier, successfully cross-sell a batch of add-ons, or run a seasonal discount campaign, we will see the impact on our ARPU (Average Revenue Per User) almost immediately.
For example, when Spotify reported its financial performance, they noted €15.62 billion in annual revenue with an average revenue per user (ARPU) of €4.62. This figure tells us exactly how much value they extracted per account on a monthly basis given their current pricing and subscription mix. It is a concrete, historical, and auditable calculation that does not rely on assumptions about how long those users will stay.
CLV: The Long-Term Strategic Forecast
Customer Lifetime Value (CLV, or often used interchangeably with LTV) shifts the focus from the present moment to the entire customer lifecycle. It answers: What is the total net revenue (or profit) we expect to generate from a customer account before they eventually churn?
Unlike ARPU, CLV is inherently predictive. It requires us to model future human behavior, estimating how long a customer will remain with us and how their spending might evolve over time. This makes CLV a cornerstone of strategic planning.
According to marketing industry polls, 81% of marketers say that monitoring LTV (Customer Lifetime Value) increases overall sales. Why? Because knowing your CLV allows you to set defensible limits on marketing spend, prioritize customer success resources, and identify which cohorts are truly profitable over multiple years rather than just the first 30 days.
Formulas and Calculations: How ARPU Feeds into CLV
We cannot calculate CLV in a vacuum. In fact, ARPU is the foundational building block upon which more complex lifetime value models are constructed. If our ARPU calculation is flawed or inconsistent, our entire CLV model collapses like a house of cards.
To see how these inputs interact, you can model your own numbers using our interactive LTV Calculator. Let’s take a look at how the math actually works under the hood.
Calculating ARPU: The Building Block
The basic formula for ARPU is straightforward:
$$\text{ARPU} = \frac{\text{Total Revenue in Period } T}{\text{Total Active Users in Period } T}$$
While the math is simple, the execution is where most teams run into trouble. As detailed in the analytical breakdown of All Things ARPU (and Why Most Teams Use It Wrong) , we must establish strict, shared rules with our finance team about what counts as "revenue" and who counts as a "user."
- The Revenue Denominator Problem: Do we include free trial users, freemium accounts, or inactive churned users in our denominator? If we include non-paying users, we artificially dilute our ARPU, making our monetization strategy look weaker than it is. Best practice dictates that we exclude non-paying users to get a true picture of active customer value.
- The Revenue Definition: Are we calculating ARPU based on recognized revenue under ASC 606 standards, or are we using bookings and invoiced amounts? To align with audited financials, always use recognized revenue and subtract refunds, chargebacks, and localized taxes.
For context, typical monthly ARPU benchmarks vary wildly by stage and model:
- Early-stage B2B SaaS: $50 to $200
- Growth-stage B2B SaaS: $100 to $500
- Enterprise B2B SaaS: $500 to $5,000+
- B2C SaaS / Consumer streaming: $10 to $50
Modeling CLV: The Advanced Formula
Once we have a clean, segmented ARPU figure, we can use it to calculate CLV. The simplest, most common SaaS formula is:
$$\text{CLV} = \frac{\text{ARPU} \times \text{Gross Margin \%}}{\text{Monthly Churn Rate}}$$
This "naive" formula is a helpful starting point, but it assumes a perfectly flat, exponential retention curve—something that rarely happens in the real world. In practice, customer cohorts show a "J-curve" behavior: high early churn followed by a highly stable, flat tail of loyal users.
To build a truly defensible model that survives board audits, we must account for two critical adjustments discussed in the resource on What's the difference between LTV and CLV, and which one matters… :
- Gross Margin Adjustment: Never use raw revenue to calculate CLV. If we have a 70% gross margin (accounting for hosting costs, customer support, and third-party APIs), our net ARPU is only 70% of our gross ARPU. Failing to adjust for margin leads to massive overestimations of customer value.
- The Discount Rate: Money received five years from now is worth less than money in our bank account today. At a conservative 10% annual discount rate, a dollar received in year 5 is worth only $0.62 today. If we do not discount future cash flows, we risk over-allocating capital to acquire long-lived but slow-paying customers.
How ARPU and CLV Interact with Other Unit Economics
Neither ARPU nor CLV should be analyzed in isolation. They exist within a delicate ecosystem of unit economics. If we pull one lever, the rest of the system moves in response. To monitor the overall health of our SaaS business, we must track how these metrics interact with other SaaS Metrics to Track.
The Role of Customer Acquisition Cost (CAC)
Customer Acquisition Cost (CAC) is the gravity that keeps our lifetime value metrics grounded. A high CLV is meaningless if it costs more to acquire the customer than they will ever return to us.
This relationship is measured by the LTV:CAC Ratio. While venture capital folklore insists that a 3:1 ratio is the golden standard, a very high ratio (like 8:1) can actually signal that we are underinvesting in growth and leaving market share on the table.
Equally important is the CAC Payback Period—the number of months it takes for a customer's net ARPU to cover their initial acquisition cost. If our monthly ARPU is $100 with a 80% gross margin ($80 net), and our CAC is $800, our payback period is 10 months:
$$\text{Payback Period} = \frac{\text{CAC}}{\text{ARPU} \times \text{Gross Margin \%}} = \frac{\$800}{\$80} = 10 \text{ months}$$
If our average customer churns at month 9, we lose money on every single acquisition, despite having a seemingly healthy monthly ARPU.
The Impact of Churn and Retention Curves
Churn is the silent killer of CLV. Because churn sits in the denominator of our lifetime value formula, even a tiny shift in retention has a compounding, non-linear impact on our customer lifetime value.
For instance, consider a company with a monthly ARPU of $100 and an 80% gross margin:
- At a 95% monthly retention rate (5% churn), the implied customer lifespan is 20 months, yielding a margin-adjusted CLV of $1,600.
- If retention drops slightly to 93% (7% churn), the lifespan drops to 14.3 months, shrinking the CLV to $1,142.
This non-linear sensitivity is why focusing on retention often yields a far higher strategic ROI than chasing minor improvements in ARPU.
Advanced Segmentation: Unlocking Deeper Insights
One of the biggest mistakes we can make is relying on a single, company-wide average for our metrics. A blended average hides the critical details of our most profitable and least profitable cohorts, leading to poor resource allocation.
Segmenting for an Accurate ARPU vs CLV Comparison
To get a true arpu vs clv comparison, we must slice our data by meaningful customer characteristics. As highlighted in the statistical guide on Comparing ARPU and ARPPU: Segmentation vs. Modeling Approaches | StatsTest Blog , segmenting our metrics helps us avoid classic analytical traps like Simpson's Paradox—where a metric appears to decline overall even though it is rising within every individual segment.
We recommend segmenting your data across three main pillars:
- Acquisition Channel: Customers acquired through organic search often have a 30% higher ARPU and significantly lower churn rates than those acquired through paid social ads. Segmenting helps us focus our ad spend on high-value channels.
- Pricing Tiers and Product Usage: Grouping customers by their plan levels (e.g., Enterprise, Mid-Market, SMB) prevents enterprise accounts from masking high churn rates in our self-serve tiers.
- Geographic Regions: Purchasing power and willingness to pay vary drastically across global markets. Localized pricing strategies will naturally result in different ARPU and CLV profiles per country.
Navigating ARPU, ARPPU, and ARPDAU
In high-frequency or hybrid business models, we often need to look at more granular revenue-per-user metrics. The guide on ARPU vs ARPPU vs ARPDAU — Difference + When to Use Each | MWM outlines how these variations differ based on their denominators:
- ARPPU (Average Revenue Per Paying User): This metric excludes all non-paying users from the denominator. It is highly useful for measuring the depth of our monetization strategies (like upsells and add-ons) among active spenders.
- ARPDAU (Average Revenue Per Daily Active User): Crucial for mobile apps, games, or consumption-based SaaS products, this tracks how effectively we monetize our daily active user base, capturing immediate engagement spikes.
Strategic Playbook: How to Simultaneously Increase ARPU and CLV
Now that we understand the math and the metrics ecosystem, how do we actively drive these numbers upward? The goal is to design strategies that lift our immediate revenue per period while simultaneously strengthening the customer relationship so they stay with us longer.
In his 6-month tracking study, I Tracked Revenue Per User for 6 Months — Here's Why ARPU Beats ARPPU for Channel Decisions 2026 - DEV Community , the author notes that focusing on the right acquisition channels is the most immediate way to lift ARPU without inflating CAC. Beyond acquisition, here are our core plays for driving expansion and retention.
Optimizing Pricing and Packaging
Pricing is our most powerful lever. Yet, many SaaS companies set their prices once and never revisit them.
- Implement Tiered, Value-Based Pricing: Ensure your pricing scales alongside a value metric that grows as your customer's business grows (e.g., number of active contacts, monthly tracked sessions, or seats). This creates built-in expansion revenue.
- Usage-Based Add-ons: Offer optional premium features or usage blocks that allow power users to spend more without forcing price increases on smaller, price-sensitive accounts.
- Proactive Upgrades: Monitor customer usage patterns. If a customer is consistently approaching 80% of their current plan limits, reach out with automated, contextual upgrade prompts.
Enhancing Customer Retention and Experience
Remember: the probability of selling to an existing client is between 60% and 70%, whereas the chance of selling to a new potential customer is only between 5% and 20%. Retaining and expanding our current customer base is far more cost-effective than constant customer acquisition.
- Focus on Early Onboarding Success: A customer's long-term retention is often decided in their first 14 days. Ensure your onboarding flow guides users to their "Aha!" moment as quickly as possible.
- Build Feedback Loops: Regularly run customer satisfaction surveys (like NPS) and act on constructive feedback. When customers see their input shape the product, their loyalty increases.
- Customer Success Initiatives: Use predictive analytics to flag accounts showing signs of dropping engagement. Proactive support intervention can save an account before they reach the point of churn.
Frequently Asked Questions about ARPU vs CLV Comparison
What is the main difference in an arpu vs clv comparison?
The main difference is the time horizon. ARPU measures the average revenue generated per user over a short, defined period (such as a month or a year). CLV is a long-term, predictive forecast of the total revenue (or profit) a single customer account will generate throughout their entire relationship with your business.
Can a business have a high ARPU but a low CLV?
Yes. If a business has an exceptionally high churn rate, customers will generate significant revenue in their first few months (high ARPU) but leave quickly. Because their lifetime is short, their overall Customer Lifetime Value (CLV) will remain low, making it difficult to recover high acquisition costs.
How does Customer Acquisition Cost (CAC) relate to ARPU and CLV?
CAC acts as the profitability threshold for both metrics. Your ARPU determines how quickly you can pay back your CAC (the payback period), while your CLV must comfortably exceed your CAC (ideally by a factor of 3 or more) to ensure your business model is sustainable and profitable in the long run.
Conclusion
Mastering our unit economics shouldn't require a PhD in mathematics or an army of data engineers writing endless SQL queries. When we look at an arpu vs clv comparison, we are looking at the vital signs of our SaaS business. ARPU tells us how well we are monetizing today; CLV tells us how sustainable our growth is for tomorrow.
At atSpark, we believe that every SaaS team should have instant, effortless access to these insights. Our AI-powered analytics platform unifies your billing, CRM, and subscription data into a single source of truth. Instead of wrestling with complex spreadsheets or building fragile internal dashboards, you can simply ask atSpark plain-English questions—like "What is our monthly ARPU segmented by acquisition channel?" or "Show me our 5-year discounted CLV curve"—and get beautiful, accurate charts and tables instantly.
Ready to take your revenue metrics to the next level? Schedule a demo with our team to see how seamless data integrations can transform your ARPU analysis strategy and unlock the true potential of your customer lifetime value.