The Leaky Bucket Problem: Why SaaS Customer Retention Strategies Determine Your Growth Ceiling
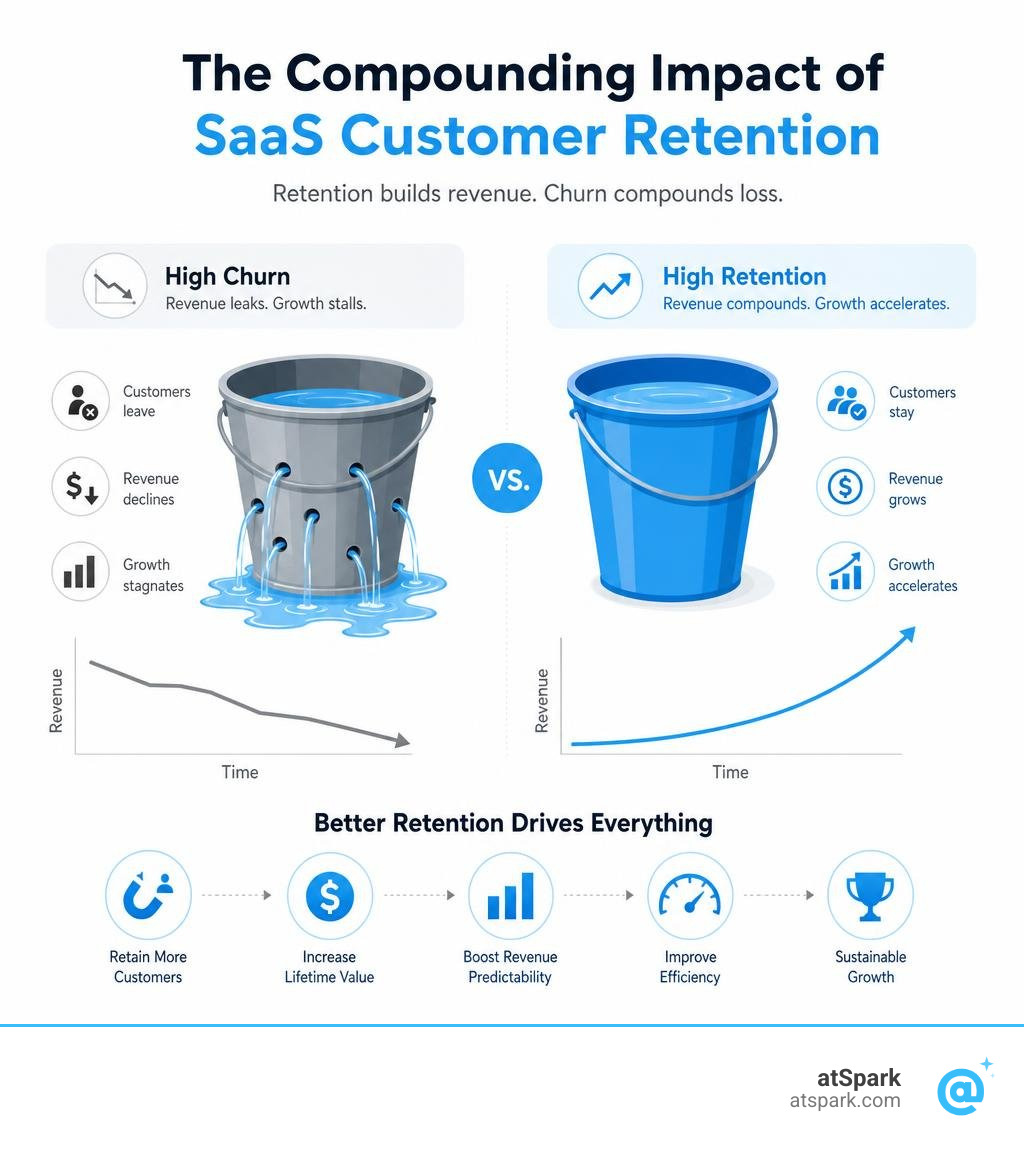
The most effective SaaS customer retention strategies share one trait: they treat existing customers as your most valuable growth asset, not a support cost.
If you're trying to reduce churn fast, here are the core strategies that move the needle:
- Fix onboarding first - Get customers to their "aha moment" within 7 days
- Build a customer health score - Flag at-risk accounts before they cancel
- Reduce involuntary churn - Set up payment retry logic and dunning sequences
- Create a cancel flow - Offer pauses or targeted discounts at the moment of cancellation
- Close the feedback loop - Collect, act on, and share customer insights across teams
- Align incentives company-wide - Make retention everyone's responsibility, not just Customer Success
- Segment your retention data - By plan, cohort, region, and acquisition channel
Now here's why this matters so urgently.
Imagine a bootstrapped SaaS founder watching their subscriber count fall from 210 to 88 — not because the product was bad, but because they never built any infrastructure to save customers who were on the fence. No cancel flow. No exit survey. No payment recovery. Just Stripe notifications quietly piling up.
That story is more common than most RevOps and finance leaders want to admit.
The math is unforgiving. A monthly churn rate of just 5% — which can feel manageable — compounds to a loss of nearly 46% of your customer base every year. And acquiring a replacement customer costs anywhere from 5 to 25 times more than keeping the one you already have.
Yet most SaaS companies still pour the majority of their growth budget into top-of-funnel acquisition while the retention engine leaks quietly in the background.
The good news: retention is highly fixable. A mere 5% improvement in retention can drive profit growth of 25% to 95% — and companies with retention rates above 85% grow 1.5 to 3 times faster than their peers.
This guide breaks down exactly how to get there.
What is SaaS Customer Retention and How Do You Measure It?
In SaaS, customer retention (often referred to as logo retention) is the percentage of paying accounts that remain active with your service over a given period. It is the ultimate metric for validating product-market fit. If customers stick around, it means you are delivering continuous value. If they leave, you have a leaky bucket.
Tracking this metric is non-negotiable for understanding your customer lifecycle. However, looking at logo retention in isolation doesn't tell the whole story. To get a complete financial picture, you must analyze your SaaS Customer Retention Metrics alongside revenue-based retention.
Before diving into the formulas, you can benchmark your current performance using our free Churn Rate Calculator to see where your business stands today.
The Customer Retention Rate Formula
To calculate your Customer Retention Rate (CRR), you must define a specific time period—typically a month, a quarter, or a year. To eliminate seasonal fluctuations and account for the full customer lifecycle, we recommend measuring it over a 12-month period.
To find your CRR, subtract the number of new customers acquired during the period from the total number of customers at the end of the period, then divide that by the number of customers you had at the start of the period. Multiply the result by 100 to get your percentage.
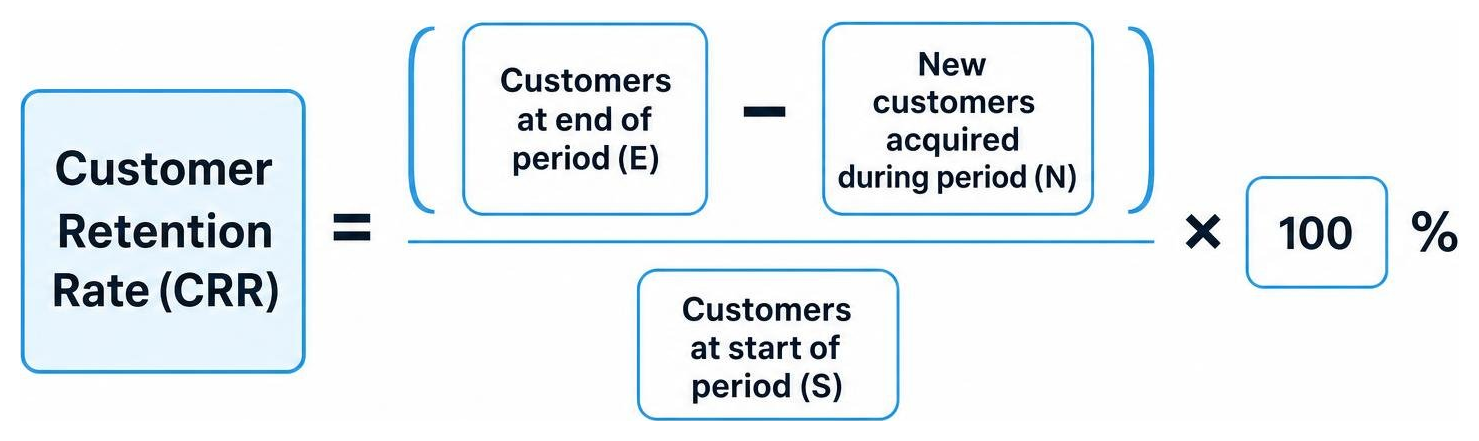
Let’s look at a quick example. Suppose you start the quarter with 500 paying customers. Over the next three months, you acquire 50 new customers, but you end the quarter with 490 total customers.
- Customers at start (S): 500
- Customers at end (E): 490
- New customers acquired (N): 50
Using the formula:
$$\text{CRR} = \left( \frac{490 - 50}{500} \right) \times 100 = 88\%$$
Your logo retention rate for the quarter is 88%. This means you retained 88% of your starting customer base while losing 12% to churn. To understand how to build on these calculations and design a long-term roadmap, check out our guide on How to Build a SaaS Customer Retention Strategy.
Logo Retention vs. NRR vs. GRR
While logo retention measures the count of accounts you keep, revenue retention measures the dollars you keep. To get a clear view of your company's financial health, you must track both. A business can lose several small logos (high logo churn) but still grow its revenue if its largest customers are expanding their accounts.
The three primary retention metrics are:
- Logo Retention (Customer Retention Rate): The percentage of customer accounts retained over a period. It can never exceed 100%.
- Gross Revenue Retention (GRR): The percentage of recurring revenue retained from your existing customer base, excluding any expansion revenue (upsells or cross-sells). It maxes out at 100% and shows how stable your core revenue is.
- Net Revenue Retention (NRR): The percentage of recurring revenue retained from existing customers, including expansion revenue (upgrades, add-ons, and seat expansions) and subtracting churn and downgrades. NRR can exceed 100%. To dive deeper into this metric, read our Glossary: Net Revenue Retention (NRR) or use our interactive NRR Calculator.
| Metric | Formula | Can it exceed 100%? | What it tells you |
|---|---|---|---|
| Logo Retention | $\frac{\text{End Customers} - \text{New Customers}}{\text{Start Customers}} \times 100$ | No | How well you keep individual accounts active. |
| Gross Revenue Retention (GRR) | $\frac{\text{Starting MRR} - \text{Churn} - \text{Downgrades}}{\text{Starting MRR}} \times 100$ | No | The baseline stability of your revenue without upsells. |
| Net Revenue Retention (NRR) | $\frac{\text{Starting MRR} + \text{Expansion} - \text{Churn} - \text{Downgrades}}{\text{Starting MRR}} \times 100$ | Yes | The overall growth and expansion potential of your existing base. |
Why Retention Beats Acquisition for Sustainable SaaS Growth
Many SaaS startups dedicate up to 80% of their growth budget to customer acquisition. While signing up new logos is exciting, growth-through-acquisition can almost never outrun high churn at scale.
In subscription models, a retained dollar is worth significantly more than a newly acquired dollar. Existing customers have already crossed the trust barrier, whereas new customers have yet to prove they will renew. To model the long-term value of your retained users, check out our Glossary: Lifetime Value (LTV) and play with our LTV Calculator.
The Real Cost of Customer Acquisition
Acquiring a new customer is 6 to 7 times more expensive than keeping an existing one. For most subscription businesses, the Customer Acquisition Cost (CAC) is significantly higher than the first monthly payment received.
If your CAC is \$400 and your average monthly contract value is \$50, it takes eight months of continuous subscription just to break even on your marketing and sales spend. If that customer churns in month six, you have actively lost money.
Strong SaaS customer retention strategies ensure that customers stick around long past their payback period, maximizing their Customer Lifetime Value (LTV) and establishing a healthy LTV:CAC ratio (ideally 3:1 or higher). For a step-by-step roadmap on aligning your data to track these balances, read Data-Driven Customer Retention for SaaS: A Complete Guide.

B2B vs. B2C SaaS Customer Retention Strategies Benchmarks
Retention benchmarks vary wildly depending on your target market and Average Revenue Per Account (ARPA).
- B2B SaaS Benchmarks: B2B companies typically see annual logo retention rates of 85% to 95% (a monthly churn rate of under 1% to 1.5%). Because B2B software is deeply integrated into business workflows, switching costs are high.
- B2C SaaS Benchmarks: B2C companies experience lower annual retention, ranging from 60% to 80% (a monthly churn of 2% to 4% or higher). Consumer products are easier to cancel and have lower switching costs.
ARPA is one of the strongest predictors of retention. For a SaaS business with less than \$10 ARPA, monthly churn can be relatively high at 6% to 7%. Conversely, for enterprise businesses with \$500 ARPA or more, monthly churn tends to drop to a stable 1% to 2%. To explore how these differences impact your overall success criteria, read our breakdown of SaaS Customer Success Metrics.
Diagnosing the Root Causes of SaaS Churn
Before you can fix churn, you must diagnose why it is happening. Churn is a lagging indicator; by the time a customer cancels, the underlying issue likely occurred weeks or months prior.
To help classify your churn types, review our Glossary: Customer Churn Rate. Generally, churn falls into two distinct categories: voluntary and involuntary.
Voluntary Churn: Why Customers Choose to Leave
Voluntary churn occurs when a customer makes a conscious decision to cancel their subscription. This usually stems from one of five root causes:
- Poor Fit / Wrong ICP: Selling to the wrong customer is an onboarding failure before it even starts. Customers outside your Ideal Customer Profile (ICP) churn at 3 to 5 times higher rates in their first 90 days.
- Low Product Engagement: If users aren't logging in, they aren't getting value. A drop-off in product usage typically occurs 30+ days before a formal cancellation.
- Budget Pressure: When economic conditions tighten, software budgets get slashed.
- Champion Departure: If your primary advocate at a customer company leaves, the incoming replacement has no emotional attachment to your tool and may bring in their own preferred stack. Champion departure churn typically materializes 60 to 90 days after the contact change.
- Poor Customer Service: Avoidable friction is expensive. U.S. companies lose an estimated \$75 billion annually to poor customer service, and 33% of Americans would consider switching brands after a single bad experience.
To build targeted plays for each of these scenarios, read Churn Reduction Strategies: A Root-Cause Playbook for SaaS.
Involuntary Churn: The Silent Revenue Killer
Involuntary churn occurs when a subscription is canceled without the customer's active intent. This is almost always caused by payment failures, such as expired credit cards, outdated billing info, or bank declines.
Involuntary churn is a silent assassin, accounting for 20% to 40% of all SaaS churn.
Fortunately, it is also the most preventable type of churn. Implementing a robust payment retry strategy, setting up automated dunning emails, and offering localized payment methods can recover a massive portion of this lost revenue. For a deeper look at managing billing friction, consult How to Reduce SaaS Churn: The Complete 2026 Playbook.
Actionable SaaS Customer Retention Strategies to Stop Churn
Improving retention requires a coordinated effort across product, customer success, and billing infrastructure. Here are the most effective, proven strategies to keep your customers engaged and paying.
For a comprehensive operational playbook on managing these workflows, check out Customer Retention Management: Strategy, Metrics, and Playbook.
Optimizing Onboarding for Early Value Realization
The first week of the customer journey is the most critical. If a customer doesn't realize the value of your product quickly, they will likely churn.
Your primary goal during onboarding is to minimize Time-to-First-Value (TTFV) and guide the user to their "aha moment"—the precise instance they realize how your software will make their life easier.
To optimize this experience:
- Simplify the signup flow: Remove any non-essential steps between signup and core product value.
- Use interactive, self-guided workflows: Implement step-by-step in-app guidance, tooltips, and checklist progress bars. Introducing onboarding experiences and in-app support boosted IBM's retention rate from 50% to over 70%, making engaged users 300% more likely to return to the product a week after their initial login.
- Leverage proactive support: Reach out early. SaaS customers who engage with support in their first three months are retained at a 26% higher rate.
To see how top companies structure their early-stage user journeys, read SaaS Customer Retention Strategies That Actually Work (2026 Guide).
Implementing Proactive Customer Success and Health Scoring
Don't wait for your customers to submit a support ticket or request a cancellation. By then, it's often too late. Instead, build a proactive Customer Success (CS) engine centered around a Customer Health Score.
A Customer Health Score combines multiple data points to grade an account's likelihood to renew. You can calculate this score by tracking:
- Product usage depth: Are they using your core features, or just logging in and out?
- Session frequency: How often are they opening your app?
- Support ticket sentiment: Are they filing a high volume of urgent tickets, or is their feedback generally positive?
- Commercial signals: Are they near their usage limits? Have they recently added new team members?
If an account’s health score dips below a set threshold (e.g., no logins for 14 days), trigger an automated alert for your CS team to reach out with personalized assistance. Maintaining this proactive rhythm is essential for stabilizing your Glossary: Renewal Rate.
Designing High-ROI Cancel Flows and Win-Back Campaigns
The "cancel" button shouldn't be a trap, but it shouldn't be an open door either. The cancel click is a definitive statement of intent and the single most valuable retention touchpoint in the customer lifecycle.
By building a structured, 30-second cancellation flow, you can save 25% to 45% of customers who attempt to leave.

A high-converting cancel flow should include:
- A brief feedback step: Ask a single, multi-choice question: "Why are you canceling?"
- Targeted conditional offers based on their answer:
- If they say "It’s too expensive": Offer a 20% to 30% discount for the next 2 to 3 months. (Note: Use discounts sparingly. Offering uncontrolled discounts can reduce lifetime value by over 30%, and discounted customers have just over double the churn rate of those who pay full price).
- If they say "I’m not using it enough": Offer a "pause subscription" option. Guilt-free pausing preserves their data and account settings, making it highly effective. In fact, 44% of consumers who are likely to cancel would instead pause their subscription if the option was available.
- If they say "I don't know how to use it": Offer a free 1-on-1 training session with a customer success specialist.
For those who do complete the cancellation, don't give up. Run a structured win-back campaign 30, 60, and 90 days post-cancellation, offering product updates, new feature announcements, or exclusive return incentives.
Tracking Retention with Cohort Analysis
To truly understand your retention trends, you must look past sitewide averages. A flat, company-wide monthly churn rate of 3% can hide the fact that 50% of your new signups are churning in Month 1, while your older, legacy customers are keeping your averages afloat.
This is where cohort analysis becomes essential.
Cohort analysis groups your customers based on a shared characteristic—most commonly their signup month—and tracks how that specific group retains over time.
By mapping your cohorts, you can build a customer retention curve. Over time, you want to see this curve flatten out, indicating that once a customer reaches a certain tenure (usually month 6), they tend to stay with your product for years.
Segmenting your cohorts by acquisition channel, subscription plan, or geographic region will reveal exactly which marketing campaigns bring in high-retention users and which ones are filling your bucket with leaky water. To master this analytical approach, read our MRR Cohort Analysis Complete Guide.
Frequently Asked Questions about SaaS Customer Retention
What is a good benchmark for SaaS customer retention strategies?
A best-in-class annual customer retention rate stands at 85% to 95% for B2B SaaS and 60% to 80% for B2C SaaS. Only 11% to 19% of SaaS businesses manage to sustain a customer retention rate above 85%.
Can customer retention rate exceed 100%?
No, customer (logo) retention rate and Gross Revenue Retention (GRR) can never exceed 100%. Only Net Revenue Retention (NRR) can exceed 100% because it accounts for expansion revenue (upsells, cross-sells, and seat upgrades) from your existing customer base.
How does involuntary churn impact SaaS customer retention strategies?
Involuntary churn (billing failures) accounts for 20% to 40% of total SaaS churn. SaaS businesses that implement automated payment retry strategies and proactive dunning workflows experience up to 10% less revenue churn.
Conclusion: Let atSpark Unify Your Retention Data
Building a world-class customer retention engine requires a deep, unified understanding of your customer data. If your billing information lives in Stripe, your customer interactions are locked in HubSpot, and your product usage data is trapped in a database, your team will always be reactive rather than proactive.
That is why we built atSpark.
atSpark is an AI-powered analytics platform for SaaS companies that unifies your billing, CRM, and subscription data into a single, comprehensive source of truth. Instead of waiting for data engineering resources or writing complex SQL queries, atSpark lets your team ask plain-English questions like:
- "Show me the 12-month retention curve for our January 2025 signup cohort."
- "Which accounts with an ARPA over \$100 haven't logged in for 14 days?"
- "What is our current NRR segmented by marketing acquisition channel?"
Within seconds, atSpark generates beautiful, interactive charts and tables, giving your Customer Success, Product, and Finance teams the exact insights they need to stop churn before it happens.
Ready to stop your customers from slipping away? Explore our Important SaaS Metrics Pillar Page or get in touch with us today to see how atSpark can transform your customer data into a compounding growth engine.