You can stare at a dashboard at 8:17 a.m., coffee in hand, and still miss the number that actually explains why growth feels harder this quarter. That’s the problem with most lists of saas metrics to track: they give you more boxes to fill, not better decisions. SaaS metrics are the numbers that show how your subscription business is growing, leaking, and paying for itself, and the smartest teams track fewer of them than you’d think.
In this guide, you’ll get a clear map of the metrics that matter, what each one actually tells you, and how to build a dashboard that helps you act instead of just report.
What you’ll learn:
- Which SaaS metrics matter first
- How revenue, retention, and CAC connect
- Which product signals show trouble early
- What changes by stage and business model
- How to build a dashboard people actually use
What SaaS Metrics Actually Do for You
Most SaaS teams do not have a metrics problem. They have a filtering problem.
It’s easy to track 40 numbers and still miss the one that should change your pricing, your onboarding, or your hiring plan. A good metric is not just something you can calculate. It’s something that helps you decide what to do next.
That’s why tracking fewer, better metrics leads to smarter decisions faster. If your MRR is growing but your churn is quietly getting worse, top-line growth can fool you. If free trials are rising but activation is weak, marketing is not really “working.” Numbers only help when each one points to a real lever in the business.
In plain English, SaaS metrics tell you four things: how much recurring revenue you have, how well you keep it, how much it costs to grow it, and whether your product is strong enough to hold customers over time. Everything else is detail around those core questions.
Start With the Core Metrics Every SaaS Team Should Track
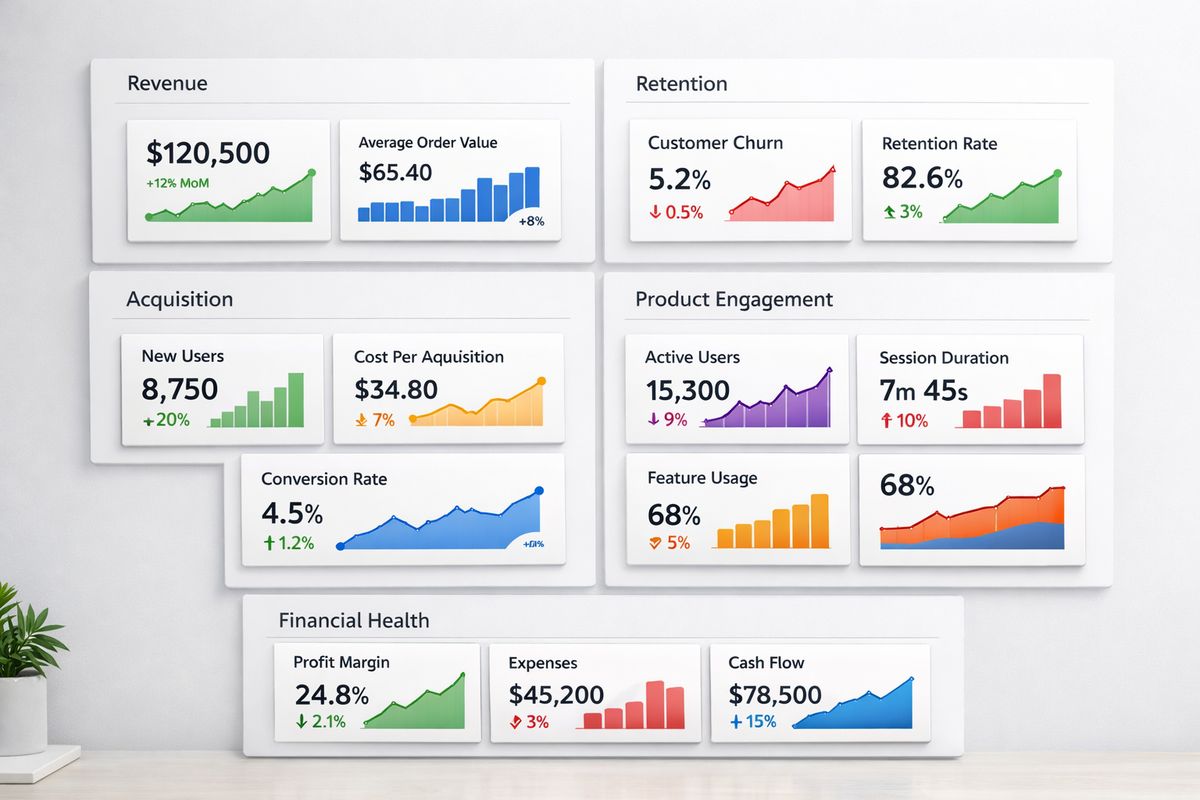
A simple way to think about SaaS metrics is by bucket. Most of the numbers worth watching fall into revenue, retention, acquisition, efficiency, product engagement, and overall financial health.
That framing matters because metrics are easier to use when you know what job each one does. Revenue metrics tell you how much repeatable income the business is producing. Retention metrics show whether that revenue sticks. Acquisition and efficiency metrics tell you if growth is affordable. Product and customer health metrics help you spot changes before revenue moves. Financial health metrics keep you honest about margins, cash, and concentration risk.
Revenue metrics
Revenue metrics answer a simple question: how much recurring money is the business generating right now, and how is that changing? MRR, ARR, ARPU or ARPA, and expansion revenue give you the backbone of that view.
Retention metrics
Retention metrics show whether new revenue is staying put or sliding out the back door. Customer churn, revenue churn, GRR, and NRR tell a much sharper story than top-line growth alone.
Acquisition and efficiency metrics
These metrics connect growth to cost. CAC, CAC payback period, LTV, LTV:CAC, and Magic Number help you see whether each dollar spent on sales and marketing is building a healthy business or just buying temporary momentum.
Product and customer health metrics
Product metrics often move before revenue metrics do. DAU, MAU, feature usage, activation, and NPS or satisfaction scores help you catch friction, weak onboarding, or fading account health early. If you want a broader view of the operating layer around these numbers, it helps to look at a wider set of business signals that shape SaaS growth.
Revenue Metrics: Track the Money That Repeats
Recurring revenue is the center of gravity in SaaS. Without a clean revenue picture, everything else gets fuzzy fast.
Monthly Recurring Revenue (MRR)
MRR is your normalized monthly subscription revenue. Not booked revenue, not cash collected, not one-time setup fees. Just the recurring subscription value you can reasonably expect each month based on active customers and plans.
That distinction matters more than it sounds. If you mix implementation fees, training, or one-off services into MRR, your trendline becomes less useful. MRR should stay boring and consistent.
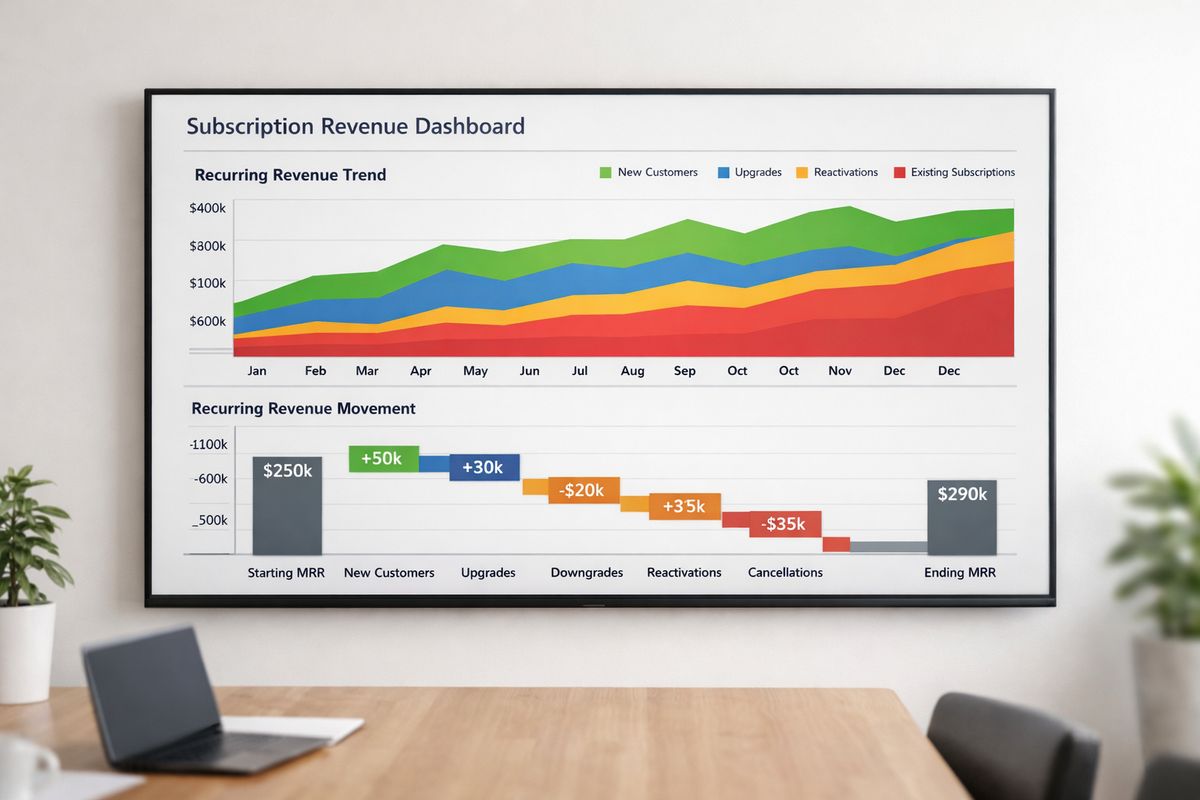
To make MRR useful, break it into movements. New MRR comes from brand-new customers. Expansion MRR comes from upgrades, added seats, or add-ons. Contraction MRR comes from downgrades or discounts. Reactivation MRR comes from previously churned customers returning. Churned MRR is the revenue lost from cancellations.
This movement view turns one headline number into a real operating readout. If MRR is up but almost all of the lift came from one sales push while contraction quietly worsened, you have a retention or pricing issue, not clean growth.
Annual Recurring Revenue (ARR)
ARR is simply recurring revenue annualized. For a business selling monthly contracts, ARR is often MRR multiplied by 12. For annual plans and longer B2B contracts, ARR can be a cleaner planning number because it reflects the revenue run rate on an annual basis.
ARR is especially useful in board conversations, fundraising, and long-range planning. It smooths out the month-to-month noise that can make MRR feel twitchy, especially in companies with a small number of larger accounts.
The catch is simple: ARR is only helpful if it is defined consistently. If you count signed contracts one quarter and live subscriptions the next, the trend stops meaning anything.
Average Revenue Per User or Account (ARPU/ARPA)
ARPU or ARPA tells you the average recurring revenue generated per user or per account in a given period. Use “user” if pricing is user-based and “account” if the customer relationship is account-based. The point is the same: this metric helps you understand customer mix and monetization depth.
If revenue is rising while ARPA stays flat, growth is mostly coming from more customers. If ARPA rises, your pricing, packaging, or expansion motion is doing some work. That difference matters because the playbook is not the same. One calls for stronger acquisition. The other suggests deeper monetization and upsell potential.
ARPA is also useful when evaluating market motion. SMB-heavy businesses usually look very different from enterprise-heavy ones here, and blending them together can hide what’s actually happening.
Annual Contract Value (ACV)
ACV measures the average annualized contract value of a customer agreement, usually excluding one-time fees. It matters most in sales-led B2B SaaS where deals vary meaningfully by segment and contract size.
ACV is not the same as ARR or ARPA. ARR is your run-rate recurring revenue. ARPA is the average recurring revenue per account in a period. ACV is the average annualized value of signed contracts. If your team closes multi-year deals, ACV helps normalize the comparison.
This metric becomes especially useful when you are planning headcount, quota, territory design, or sales compensation. A business with a $2,000 ACV needs a different sales motion than one with a $40,000 ACV. Pretty obvious, but easy to lose sight of in a crowded dashboard.
Expansion revenue and contraction revenue
Expansion revenue is the recurring revenue gained from existing customers through upgrades, added seats, add-ons, or plan changes. Contraction revenue is the opposite: revenue lost from downgrades, reduced usage, or discounts.
These are some of the most revealing numbers in SaaS because they show whether account value grows after the initial sale. Healthy expansion often points to good onboarding, strong product adoption, and pricing that leaves room to grow. Rising contraction usually points to poor fit, weak adoption, pricing pressure, or customer success gaps.
For product-led and usage-based models especially, this is where a lot of the story lives. If you want to go deeper into behavior signals behind this movement, it helps to understand which product usage patterns usually predict expansion.
Retention Metrics: Find Out Where Growth Leaks
Retention is where SaaS gets real.
You can add customers all day, but if accounts keep leaving or shrinking, growth gets expensive fast. Retention metrics show whether the business is compounding or constantly refilling a leaky bucket.
Customer churn rate
Customer churn rate is the percentage of customers who cancel during a given period. If you start the month with 200 customers and lose 10, your monthly customer churn is 5%.
Simple enough, but segmentation matters a lot here. A 3% churn rate among enterprise accounts and a 9% churn rate among SMB accounts tell very different stories than one blended 5% number. The same goes for plan tier, channel, geography, and contract type.
A “good” churn rate depends heavily on your model. Low-priced self-serve SaaS usually tolerates higher logo churn than enterprise SaaS with annual contracts and hands-on onboarding. The wrong benchmark can push you toward the wrong fix.
Revenue churn rate
Revenue churn measures the percentage of recurring revenue lost from existing customers in a period, usually from cancellations and contractions. This is where things get sharper.
Losing five tiny accounts may sting less than losing one large account. Customer churn counts logos equally. Revenue churn does not. That’s why revenue churn often gives you the cleaner strategic read, especially once account sizes vary.
Revenue churn also helps pricing and customer success teams speak the same language. If logo churn is steady but revenue churn suddenly jumps, the issue may be concentrated in larger accounts rather than spread across the base.
Gross Revenue Retention (GRR)
GRR measures how much recurring revenue you keep from existing customers before counting any expansion revenue. In practice, it tells you how well the business protects the revenue it already has.
That makes GRR one of the cleanest retention metrics in SaaS. It strips away the feel-good effect of upsells and asks a tougher question: absent expansion, how much revenue stayed in place?
If GRR is weak, expansion can hide the problem for a while, but not forever. For a closer look at the operating signals behind this number, it helps to review the retention measures that actually show customer staying power.
Net Revenue Retention (NRR)
NRR measures retained recurring revenue after churn, contraction, and expansion are all included. If you start with $100,000 in recurring revenue from an existing customer base and end with $108,000 after losses and upsells, your NRR is 108%.
This metric gets so much attention because it says a lot in one number. Above 100%, your existing base is expanding enough to offset losses. Below 100%, the base is shrinking before new sales enter the picture.
That matters to operators and investors for the same reason: high NRR usually means the product keeps delivering value after the sale. Low NRR means growth depends more heavily on constantly winning new business.
Customer retention rate
Customer retention rate is simply the percentage of customers you keep over a period. It is the flip side of churn, and often easier to use in internal communication because it feels more intuitive. Saying “you retained 92% of customers” lands differently from “you churned 8%.”
This is especially helpful in customer success reviews and board materials where the goal is quick comprehension. Just make sure the definition stays stable from month to month.
Cohort analysis
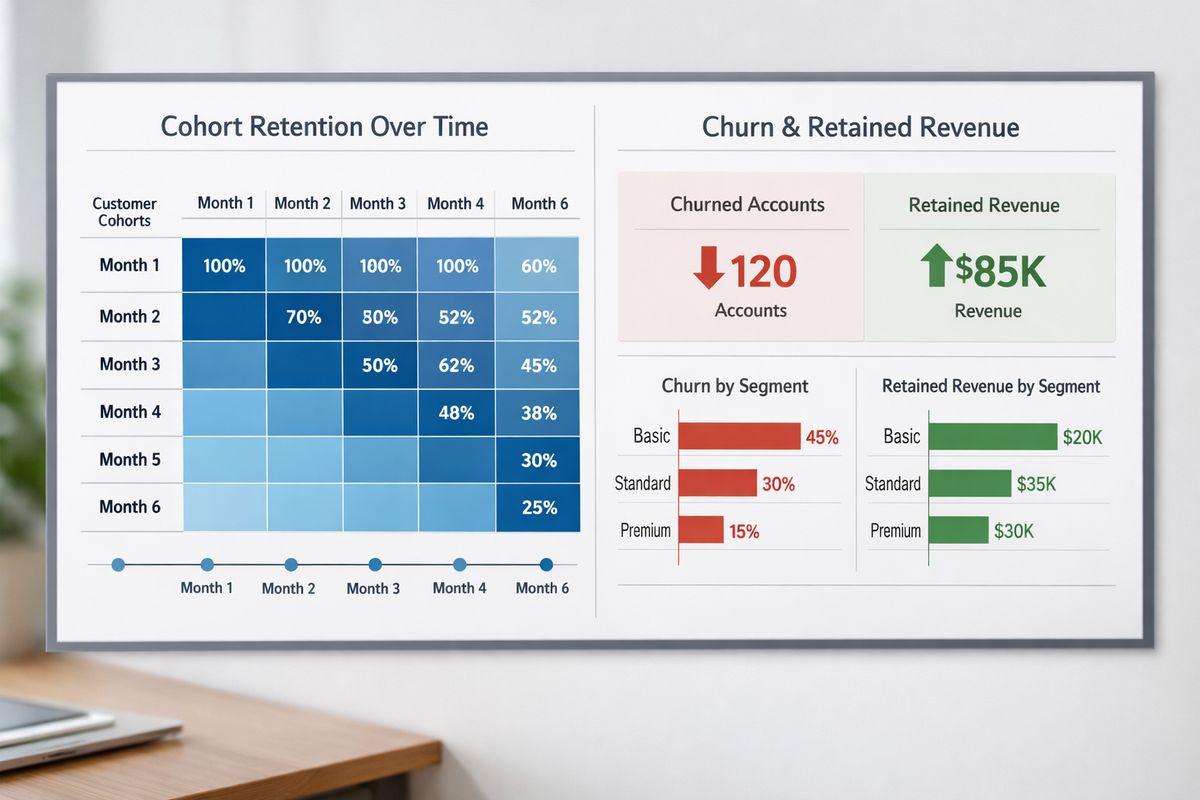
Cohort analysis groups customers by a shared starting point, usually signup month, acquisition channel, plan, or segment, and then tracks behavior over time. This is how you tell whether retention is actually improving.
Without cohorts, fresh growth can hide a retention problem. New customers keep replacing the ones who leave, and the blended numbers look acceptable. But cohort analysis shows whether customers from January are sticking better than customers from last summer, or whether paid acquisition cohorts churn faster than organic ones.
This is one of the few places where a chart can save you from a very expensive false sense of progress.
Acquisition Metrics: See What It Costs to Grow
Acquisition metrics tell you what it costs to turn interest into customers. That matters because growth can look great right up until cash gets tight.
Customer Acquisition Cost (CAC)
CAC is what you spend to acquire one new customer. In a basic form, it is total sales and marketing spend over a period divided by the number of new customers acquired in that same period.
The trap is undercounting. If you include ad spend but ignore salaries, commissions, software, agency fees, and other real go-to-market costs, CAC looks better than reality. Half-calculated CAC is worse than no CAC because it pushes bad budget decisions.
CAC should match your motion. A founder-led sales process, an inbound self-serve model, and an enterprise outbound team will all produce very different CAC patterns. That’s normal.
Lead-to-customer conversion rate
This metric shows the percentage of leads that become paying customers. It helps you see if the funnel is bringing in the right people and whether sales or onboarding friction is blocking progress.
If traffic and leads are climbing but conversions are flat or falling, your problem may not be top-of-funnel at all. It may be positioning, qualification, sales process, or product fit.
Conversion rate is most useful when segmented by source. Paid social leads, partner leads, and demo requests usually behave very differently.
Free trial-to-paid conversion rate
For product-led and hybrid SaaS, this is one of the clearest growth metrics you can watch. It measures the percentage of trial users who become paying customers.
A weak trial-to-paid rate usually points to one of four problems: the wrong users are entering the trial, onboarding is confusing, activation takes too long, or pricing does not line up with perceived value. Sometimes all four.
This number becomes much more useful when you pair it with activation. Plenty of products drive trial signups. Far fewer help users reach the moment where the value clicks.
Sales cycle length
Sales cycle length is the average time it takes to close a deal from first touch to signed customer. This matters because a healthy pipeline can still create cash flow stress if deals take forever to close.
Longer cycles affect hiring, forecasting, and how patient your business needs to be with new channel bets. In enterprise SaaS, shaving 20 days off a sales cycle can improve predictability almost as much as improving close rate.
CAC payback period
CAC payback period measures how many months it takes to recover acquisition cost from gross profit generated by a customer. This is one of the most practical metrics in SaaS because it connects growth to cash.
Shorter payback usually means a more efficient go-to-market motion. Long payback can be acceptable in certain enterprise models with strong retention, but it still creates cash pressure. Fast growth with slow payback is one of the easiest ways to look healthy on paper while making finance nervous.
Efficiency Metrics: Check Whether Growth Pays Back
https://www.youtube.com/watch?v=s8_Vax8VUmM
Acquisition tells you what growth costs. Efficiency tells you whether that cost is worth it.
Customer Lifetime Value (LTV)
LTV is the total gross profit you expect to earn from a customer over the full relationship. Keep it practical. You do not need a heroic spreadsheet with twelve assumptions and a sprinkle of fantasy.
A simple version uses average recurring revenue, gross margin, and expected customer lifespan based on churn. That is usually enough to guide decisions. Overcomplicated LTV models often create false confidence because tiny assumption changes can swing the answer a lot.
LTV to CAC ratio
This ratio compares what a customer is worth to what it costs to acquire that customer. It is a good pressure test for your growth model.
If the ratio is too low, acquisition is too expensive or retention is too weak. If the ratio is suspiciously high, check your assumptions. Sometimes it means you have real room to invest more aggressively. Sometimes it means your LTV model is flattering you.
For a more focused breakdown of the numbers operators return to most often, see this guide to the performance metrics that tend to drive startup decisions.
SaaS Magic Number
The SaaS Magic Number estimates how efficiently new sales and marketing spend turns into recurring revenue growth. In simple terms, it compares quarter-over-quarter subscription revenue growth to prior-period sales and marketing spend.
It is not magic, despite the name. But it is useful as a quick sales efficiency snapshot, especially for sales-led businesses. Strong revenue growth on sane go-to-market spend usually produces a healthier Magic Number. Weak growth on heavy spend does the opposite.
Quick Ratio
The SaaS Quick Ratio compares revenue gains from new, expansion, and reactivation MRR against losses from churn and contraction. It answers a straightforward question: how much new recurring revenue are you generating for every dollar of recurring revenue lost?
It is a useful snapshot because it highlights the balance between forward motion and leakage. Just do not mistake it for the whole story. A good Quick Ratio can still hide weak margins or ugly payback.
Burn multiple
Burn multiple measures how much cash you burn to generate each additional dollar of net new ARR. In tighter funding markets, this metric gets a lot more attention, for good reason.
It pushes discipline into growth conversations. If you are burning heavily to add modest net new ARR, the business may need pricing changes, spend control, or a different go-to-market mix.
Rule of 40
The Rule of 40 adds growth rate and profit margin together. The idea is simple: a SaaS company can justify lower profitability if growth is strong, or lower growth if profitability is strong, as long as the combined score is healthy.
This is more useful for mature planning and external benchmarking than for weekly operating reviews. You probably are not checking it every Monday morning, but it helps frame the bigger balance between growth and efficiency.
Product and Engagement Metrics: Catch Problems Before Revenue Drops
Revenue metrics tell you what already happened. Product and engagement metrics help you notice the shift sooner.
Daily Active Users (DAU) and Monthly Active Users (MAU)
DAU and MAU measure how many users actively use your product daily or monthly. The word “active” needs a real definition. Logging in and bouncing after six seconds should not count if the product’s value comes from meaningful work done inside it.
Used well, DAU and MAU help you understand product stickiness. The DAU/MAU relationship can show whether usage is habitual or occasional, which matters a lot for collaboration tools, workflow products, and anything meant to become part of a team’s daily rhythm.
Activation rate
Activation rate is the percentage of new users who reach the first meaningful success moment. That might be creating a project, inviting a teammate, connecting data, or publishing something live. It depends on the product, but the principle is the same.
Activation is one of the strongest early signals for retention because it tells you whether users got to value quickly enough. If activation is weak, churn often shows up later. By then, fixing it is harder.
Feature adoption
Feature adoption tracks how many users or accounts use specific capabilities over time. This helps you understand where value is concentrated, which features support upgrades, and where onboarding falls flat.
Feature adoption is especially useful when tied to outcomes. If customers who use a certain integration or workflow retain 2 times better, that feature deserves more attention in onboarding and customer success.
Customer engagement score
A customer engagement score combines a few meaningful behaviors into one simple health signal, such as logins, feature use, seats used, support activity, or task completion. This can be helpful, but only if it stays transparent.
The trick is not to build a mystery score no one trusts. If people cannot explain what moved the score, it stops being useful. Simple beats clever here.
Net Promoter Score (NPS) and customer satisfaction
NPS and satisfaction surveys can help, but only as directional signals. They are not truth machines.
A high NPS with rising churn should not comfort you. A low satisfaction score in one segment may matter more than a decent average across the whole base. Use these metrics alongside behavior and retention data, not in isolation. For teams tying product signals to account health, it also helps to understand which customer success numbers usually warn you first.

Financial Health Metrics That Keep Growth Grounded
At some point, every growth conversation runs into the same question: can your business actually afford the plan?
Gross margin
Gross margin shows how much revenue remains after direct costs required to deliver the product. In SaaS, that usually includes hosting, customer support, implementation tied to delivery, and other direct service costs.
This matters because gross margin tells you how scalable revenue really is. A software business with low gross margin may be more service-heavy than it looks. Rising infrastructure or support costs can quietly drag down the economics even while revenue grows.
Bookings, billings, and revenue
These three get mixed up constantly. Bookings represent contracted value. Billings represent invoices sent. Revenue represents what is recognized under accounting rules over time.
With annual contracts, you might book and bill a large amount upfront while recognizing revenue month by month. That distinction matters for forecasting, finance reviews, and board reporting. Clean reporting starts with clean definitions.
Cash runway and burn rate
Burn rate is how much cash you spend beyond what comes in. Runway is how long current cash lasts at that burn level. Not glamorous, but these numbers shape almost every real decision.
Hiring pace, pricing experiments, market expansion, and channel bets all feel different when runway is 22 months versus 6. The same strategy can look bold in one case and reckless in the other.
Customer concentration
Customer concentration measures how much revenue depends on a small number of accounts. If one or two customers make up a large share of ARR, growth can look safer than it really is.
This risk also distorts retention and forecasting. One renewal can swing the quarter. One lost account can wreck a seemingly solid churn number. Especially in enterprise SaaS, this deserves a regular seat in reporting.
How to Choose the Right SaaS Metrics for Your Stage
Not every company needs the same dashboard. The right metrics depend on your stage, motion, and current bottleneck.
Early-stage SaaS
Early on, focus on activation, retention, early MRR growth, churn, and basic CAC. Before scale, the real question is not “how do you optimize the funnel?” It is “do users get value and stick around?”
If retention is weak, more acquisition just pours traffic into a broken experience.
Growth-stage SaaS
Once the engine starts working, the focus shifts toward repeatability and efficiency. Payback period, NRR, expansion revenue, sales efficiency, and gross margin matter more because you are no longer proving the product. You are proving the model.
Enterprise or sales-led SaaS
Sales-led businesses should pay extra attention to ACV, sales cycle length, CAC payback, customer concentration, renewal rates, and revenue churn. A few large deals can make headline growth look strong while hiding concentration risk or a fragile pipeline.
Product-led SaaS
Product-led businesses live closer to behavior metrics. Activation, trial-to-paid conversion, DAU/MAU, feature adoption, and expansion paths matter because the product itself is doing a big part of the selling. If you need a cleaner shortlist to compare against your current reporting, this roundup of high-signal metrics worth keeping on one screen is a useful check.
Build a SaaS Dashboard That Helps You Decide, Not Just Report
A useful dashboard is not a prettier spreadsheet. It is a decision tool.
Group metrics by decision type
Organize metrics around decisions: pricing, retention, pipeline, onboarding, and cash planning. That way each section answers a real question. One long wall of numbers looks busy but rarely helps anybody act.
Track trends, not isolated snapshots
One month can mislead you. A large annual contract closes, churn slips into next month, and suddenly the story looks better than it is.
Look at month-over-month, quarter-over-quarter, and cohort trends. Direction matters more than one isolated spike or dip.
Segment everything that matters
Averages hide problems. Blended churn can mask weak SMB retention. Blended CAC can hide a paid channel that is quietly getting expensive. Break metrics out by plan, customer size, source, geography, or cohort when the difference changes a decision.
Set metric owners and review cadence
Every important metric should have an owner and a review rhythm. Otherwise the number sits in a tab, admired and ignored.
Ownership does not mean blame. It means someone notices movement, brings context, and helps drive action when the metric shifts.
Common SaaS Metrics Mistakes That Lead to Bad Decisions
Most metrics mistakes are not technical. They are operational. Small definition gaps and reporting habits create big confusion later.
Tracking vanity metrics over decision metrics
Traffic, raw signups, and total users can look exciting while activation, retention, and monetization stay weak. If a metric never changes a decision, it is decoration.
Using inconsistent definitions
If “active user” means one thing in January and another in April, the trendline is broken. The same goes for customers, churned accounts, and even MRR categories. Pick one definition and stick to it.
Looking at blended averages only
Blended CAC, churn, or retention can hide major gaps between SMB and enterprise, paid and organic, or new and mature cohorts. Averages are tidy. Real businesses usually are not.
Ignoring expansion and contraction
Top-line MRR alone does not explain movement. If you do not track upgrades, downgrades, reactivations, and churn separately, you lose the plot. Growth looks smoother than reality, and fixes get harder to find.
A Practical SaaS Metrics Stack to Start With
You do not need 25 metrics to run a better SaaS business. You need the few that actually sharpen decisions.
If you can only track 5 metrics
Start with MRR, customer churn, NRR or GRR, CAC payback, and activation rate. That gives you a strong read on growth, leakage, go-to-market efficiency, and whether new users reach value fast enough to stick.
If you can track 10 metrics
Add ARR, ARPU or ARPA, revenue churn, LTV:CAC, sales cycle length, feature adoption, or burn multiple depending on your model. At this point, your dashboard starts to show a fuller operating picture without turning into a junk drawer.
Your first next step
Audit the dashboard you already have and cut anything that never changes a decision. Keep the metrics that explain growth, leakage, payback, and product value. If you want one practical place to pull this together, try AtSpart and build a metrics view your team will actually use.
Frequently Asked Questions
What are the most important SaaS metrics to track first?
Start with MRR, churn, NRR or GRR, CAC payback period, and activation rate. Those five cover revenue, retention, efficiency, and early product health without overwhelming your team.
Which is more useful, customer churn or revenue churn?
Revenue churn usually tells the sharper story because not all customers are worth the same amount. Customer churn is still useful, especially in self-serve SaaS, but revenue churn shows the actual business impact more clearly.
How often should you review SaaS metrics?
Core operating metrics usually deserve a weekly or monthly review, depending on volume and sales cycle length. Board-level or strategic metrics such as Rule of 40 can be reviewed less often, usually quarterly.
What is a good NRR for a SaaS company?
Above 100% is a strong sign because your existing customer base is expanding enough to offset losses. What counts as “good” still depends on your model, pricing, and customer segment, but higher NRR almost always gives you more room to grow efficiently.
Why do so many SaaS dashboards fail?
Most fail because they collect numbers instead of supporting decisions. Too many metrics, weak definitions, no segmentation, and no clear ownership turn dashboards into reporting theater.
Should product metrics sit in the same dashboard as financial metrics?
Yes, at least at a high level. Product behavior often explains financial results before those results show up in MRR or churn, so keeping both in view gives you a much better operating picture.