Why SaaS Investor Reporting Makes or Breaks Your Funding
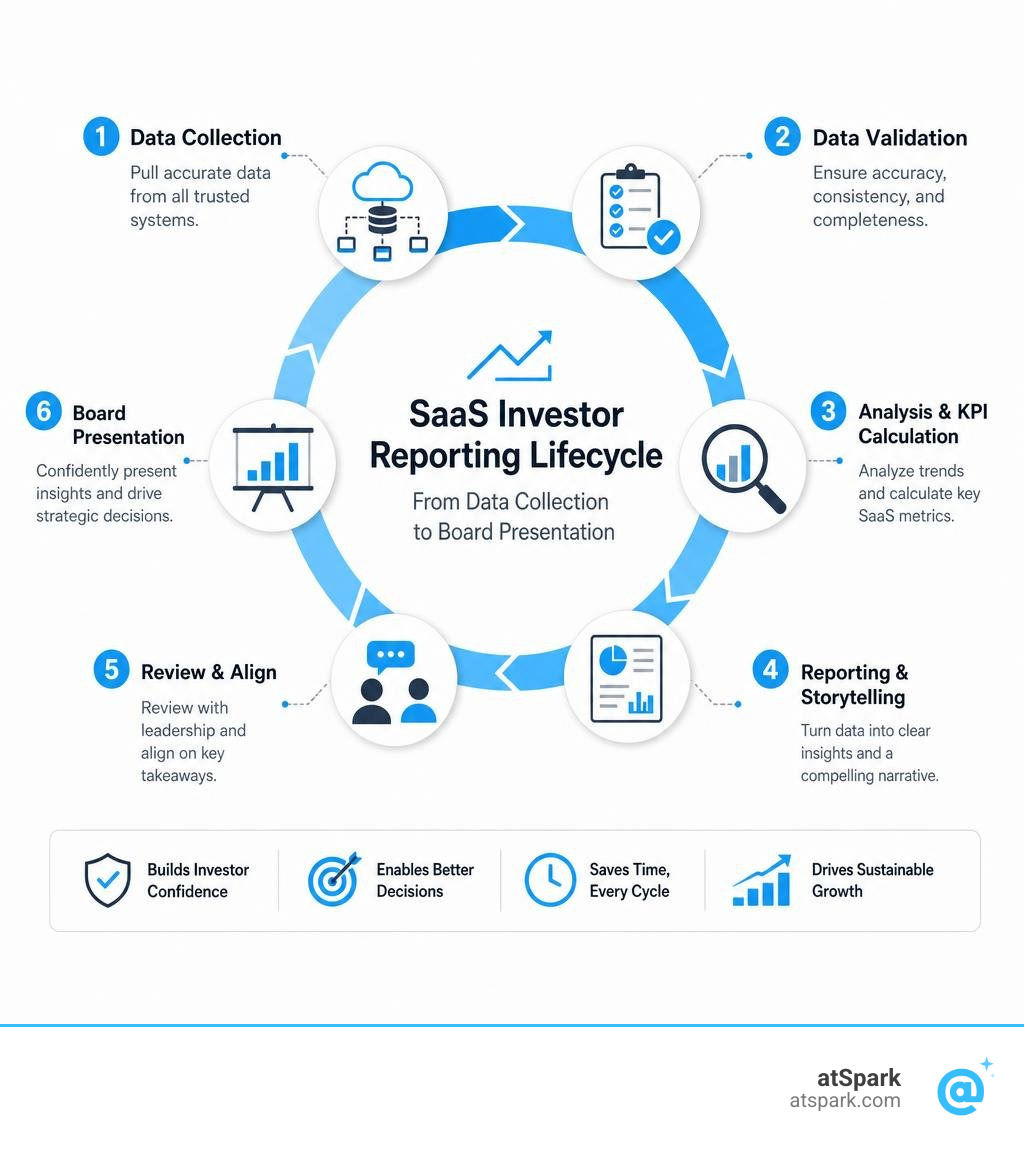
SaaS investor reporting is the process of collecting, analyzing, and presenting your company's key financial and operational metrics so that investors can accurately assess business health, growth trajectory, and return potential.
If you need a fast answer, here's what matters most:
What investors want to see in your SaaS reports:
| Category | Key Metrics |
|---|---|
| Revenue | MRR, ARR, Net New MRR |
| Efficiency | LTV:CAC ratio (target: 3:1+) |
| Retention | NRR, GRR, Churn Rate |
| Profitability | Gross Margin (target: 70-85%), Rule of 40 |
| Cash Position | Burn Rate, Runway |
| Compliance | ASC 606 revenue recognition |
Investors don't just fund businesses — they fund confidence. And confidence comes from clear, consistent, and accurate reporting.
The problem is that most finance and RevOps teams are drowning in spreadsheets, waiting on data teams, and manually reconciling numbers the night before a board meeting. One panelist with experience across more than 370 board meetings put it plainly: the best founders report the same high-quality operational data to their investors as they do internally — no separate, time-consuming investor-only packages.
That gap between what investors expect and what most teams can actually produce on time is exactly what this guide is designed to close.
Foundations of SaaS Investor Reporting
To build a reporting system that satisfies top-tier venture capitalists, we must first understand why investors find the Software-as-a-Service business model so incredibly attractive.
Unlike traditional business models where sales are transactional and one-off, SaaS relies on a predictable recurring revenue model. This predictability significantly reduces investment risk by enabling highly reliable calculations of return on investment (ROI).
Furthermore, SaaS businesses possess immense scalability. Once the core product is built, the cost of distributing it to the next thousand customers is minimal. This dynamic allows SaaS companies to maintain low operating expenses and achieve exceptionally high operating leverage as they scale.
What is SaaS Investor Reporting and Why Does It Matter?
At its core, SaaS investor reporting refers to collecting, analyzing, and visualizing key operational and financial metrics so that potential and current investors can assess business performance, cash requirements, and strategic progress.
Consistent reporting is the bedrock of investor trust. By presenting clean, auditable financial metrics on a predictable cadence, we demonstrate that we have our fingers on the pulse of the business. This transparency is crucial not only for retaining your current backers but also for securing subsequent rounds of funding. When institutional investors see a history of methodical, well-organized financial management, they are far more likely to write follow-on checks.
For a deeper look into what backers look for across their portfolios, check out our guide on For Investors.
SaaS vs. Cloud: Clarifying the Infrastructure for Investors
One common point of confusion—even among some early-stage angel investors—is the difference between SaaS and cloud computing. While these terms are frequently used interchangeably, they are fundamentally different concepts that we must clarify in our reporting.
- Cloud Computing: This is the underlying infrastructure. It refers to the on-demand delivery of IT resources (like servers, storage, databases, and networking) over the internet, typically on a pay-as-you-go basis.
- SaaS (Software-as-a-Service): This is a specific software delivery and business model. It is a complete application (such as a CRM or a collaboration platform) hosted on cloud infrastructure, managed by a provider, and accessed by users via subscription billing.
Understanding this distinction is critical when explaining our cost of goods sold (COGS). The fees we pay to cloud infrastructure providers to host our software directly impact our margins, which we will explore later in this guide.
Key Performance Indicators (KPIs) Investors Prioritize
When investors open our reports, they are looking for specific indicators that prove our unit economics are healthy and our growth is sustainable. They don't want vanity metrics; they want hard numbers that tell a cohesive story.

Core Financial and Growth Metrics
The absolute baseline of SaaS reporting centers on recurring revenue.
- Monthly Recurring Revenue (MRR): The predictable revenue we expect to receive every single month. To calculate this accurately, use our Tools/Mrr Calculator.
- Annual Recurring Revenue (ARR): The annualized value of our recurring revenue streams. It is important to note that ARR is not simply our current month's MRR multiplied by twelve if we have highly seasonal contracts or non-recurring setup fees. For a breakdown of these differences, see Why You Are Probably Confusing Annual Recurring Revenue With Run Rate and explore the glossary at glossary/arr and glossary/mrr.
- Net New MRR: The net change in our MRR from one month to the next. It is calculated as: $$\text{Net New MRR} = \text{New MRR} + \text{Expansion MRR} - \text{Churned MRR} - \text{Contraction MRR}$$ You can find detailed definitions of these components at Glossary/Net New Mrr, Glossary/Expansion Mrr, and Glossary/Contraction Mrr.
- MRR Growth Rate: The percentage growth of our MRR month-over-month, which you can calculate using the Glossary/Mrr Growth Rate reference. To see how your trajectory compares to the market, read How Does Your Saas Arr Growth Rate Stack Up Against The Best.
Customer Acquisition and Lifetime Value Metrics
Investors want to know if our customer acquisition engine is efficient and scalable. To prove this, we track:
- Customer Acquisition Cost (CAC): The total sales and marketing expenses required to acquire a single customer over a specific period. Use the Tools/Cac Calculator and see the definition at glossary/cac.
- Customer Lifetime Value (LTV): The total projected revenue a single customer will generate over their relationship with our business. Check out Customer Lifetime Value Forecasting Models And Heuristics That Actually Work and use the Tools/Ltv Calculator or refer to glossary/ltv.
- LTV:CAC Ratio: This measures the return on our marketing spend. The ideal LTV:CAC ratio for SaaS companies is 3:1 or higher. A lower ratio indicates we are spending too much to acquire customers, while a significantly higher ratio (e.g., 8:1) might mean we are underinvesting in growth. Learn more at Glossary/Ltv Cac Ratio.
- CAC Payback Period: The number of months it takes for a customer to generate enough gross profit to pay back their acquisition cost. Read more at Glossary/Cac Payback Period.
Retention and Churn Metrics
Acquiring customers is pointless if they immediately leave. Retention metrics prove our product-market fit:
- Net Revenue Retention (NRR): The percentage of recurring revenue retained from existing customers over a given period, including expansion and proration, but excluding new sales. NRR is one of the single most important metrics for investors because it demonstrates the compound growth potential of our customer base. Use our Tools/Nrr Calculator and check glossary/nrr.
- Gross Revenue Retention (GRR): This measures the revenue retained from existing customers excluding expansion. It can never exceed 100% and shows the raw stability of our revenue base. See glossary/grr.
- Customer Churn Rate: The percentage of customers who cancel their subscriptions over a specific period. You can calculate this using the Tools/Churn Rate Calculator and read our breakdown at How To Calculate Saas Churn Rate And Logo Retention Without Losing Your Mind or Glossary/Customer Churn Rate.
- Revenue Churn: The percentage of recurring revenue lost due to cancellations and downgrades. See Glossary/Revenue Churn.
To identify deep trends in retention, we highly recommend performing a Glossary/Cohort Analysis using our Mrr Cohort Analysis Complete Guide.
Profit Margins, ASC 606, and the Rule of 40
SaaS companies are unique because they can burn significant cash early on to fuel explosive growth, yet still remain highly valuable. However, as the market matured into July 2026, investors have placed an increasingly high premium on capital efficiency.
The Rule of 40 and Healthy SaaS Profit Margins
The gold standard for evaluating a SaaS company's financial health is the Rule of 40. This principle states that a healthy SaaS company's combined year-over-year growth rate and profit margin should exceed 40%.
$$\text{Growth Rate (\%)} + \text{Profit Margin (\%)} \ge 40\%$$
Depending on our growth stage, we can balance these two levers differently:
| Scenario | YoY Growth Rate | EBITDA Margin | Rule of 40 Score | Investor Perception |
|---|---|---|---|---|
| Hyper-Growth | 60% | -15% | 45% | Excellent (Healthy land-grab phase) |
| Balanced | 30% | 15% | 45% | Highly Efficient (Very stable) |
| Mature | 10% | 35% | 45% | Cash Cow (Great profit engine) |
| Underperforming | 15% | -5% | 10% | Critical Risk (Needs restructuring) |
To satisfy the profit margin side of this equation, we must maintain healthy gross margins. Healthy SaaS companies consistently maintain 70-85% gross margins.
Achieving this requires meticulous tracking of our Cost of Goods Sold (COGS). For a SaaS company, COGS must include direct costs to deliver the service: cloud hosting, payment processing fees, third-party APIs, and customer support. It must exclude sales, marketing, and product development expenses.
To learn more, see our glossary pages for Glossary/Rule Of 40 and Glossary/Gross Margin.
Revenue Recognition (ASC 606) and Deferred Revenue
Under the ASC 606 accounting standard, SaaS companies cannot recognize revenue simply because a customer paid cash upfront. Instead, revenue must be recognized over time as the service is delivered.
If a customer pays $12,000 upfront for an annual subscription, we must record that cash as a deferred revenue liability on our balance sheet. Each month, as we deliver the service, we recognize $1,000 of revenue and reduce our deferred revenue liability by the same amount.
Failing to comply with ASC 606 is one of the fastest ways to fail investor due diligence. It distorts our actual financial performance and can lead to severe accounting adjustments during an audit.
Best Practices for SaaS Investor Reporting
Structuring our reports correctly is just as important as the numbers themselves. A messy, hard-to-read deck suggests disorganized operations.
Tailoring SaaS Investor Reporting by Growth Stage
The metrics we emphasize must evolve as our business matures.
- Seed Stage: At this phase, investors are focused on survival and early signs of product-market fit. Our reporting should be simple and focus heavily on cash. Key metrics include monthly Glossary/Burn Rate and cash glossary/runway (warning: any runway below 6 months is a critical red flag). We also track basic customer counts and early MRR.
- Scaling Stage (Series A and Beyond): Once we hit this stage, investors expect institutional-grade reports. They want to see advanced unit economics, including the LTV:CAC ratio, NRR, GRR, and detailed data segmentation (such as churn broken down by customer plan size or industry vertical).
Storytelling and Context: Turning Raw Metrics into Narratives
Raw data without context is confusing. If our logo churn spiked by 5% this month, we shouldn't hope our investors don't notice. Instead, we should proactively explain why it happened and what we are doing to fix it.
For example, a sudden drop in MRR might look alarming on a chart. But if we add the narrative context that we intentionally offboarded low-value, high-churn customers to focus on our Ideal Customer Profile (ICP)—which actually improved our NRR—investors will praise our strategic focus rather than panic.
For strategies on how to present these operational reviews, read about running Customer QBRs for Investor Relations Teams | Starch.
Real-Time Dashboards vs. Static Quarterly Reports
Historically, investor relations relied on static quarterly PDF decks. While these still have their place for formal annual reviews, modern boards prefer continuous updates.
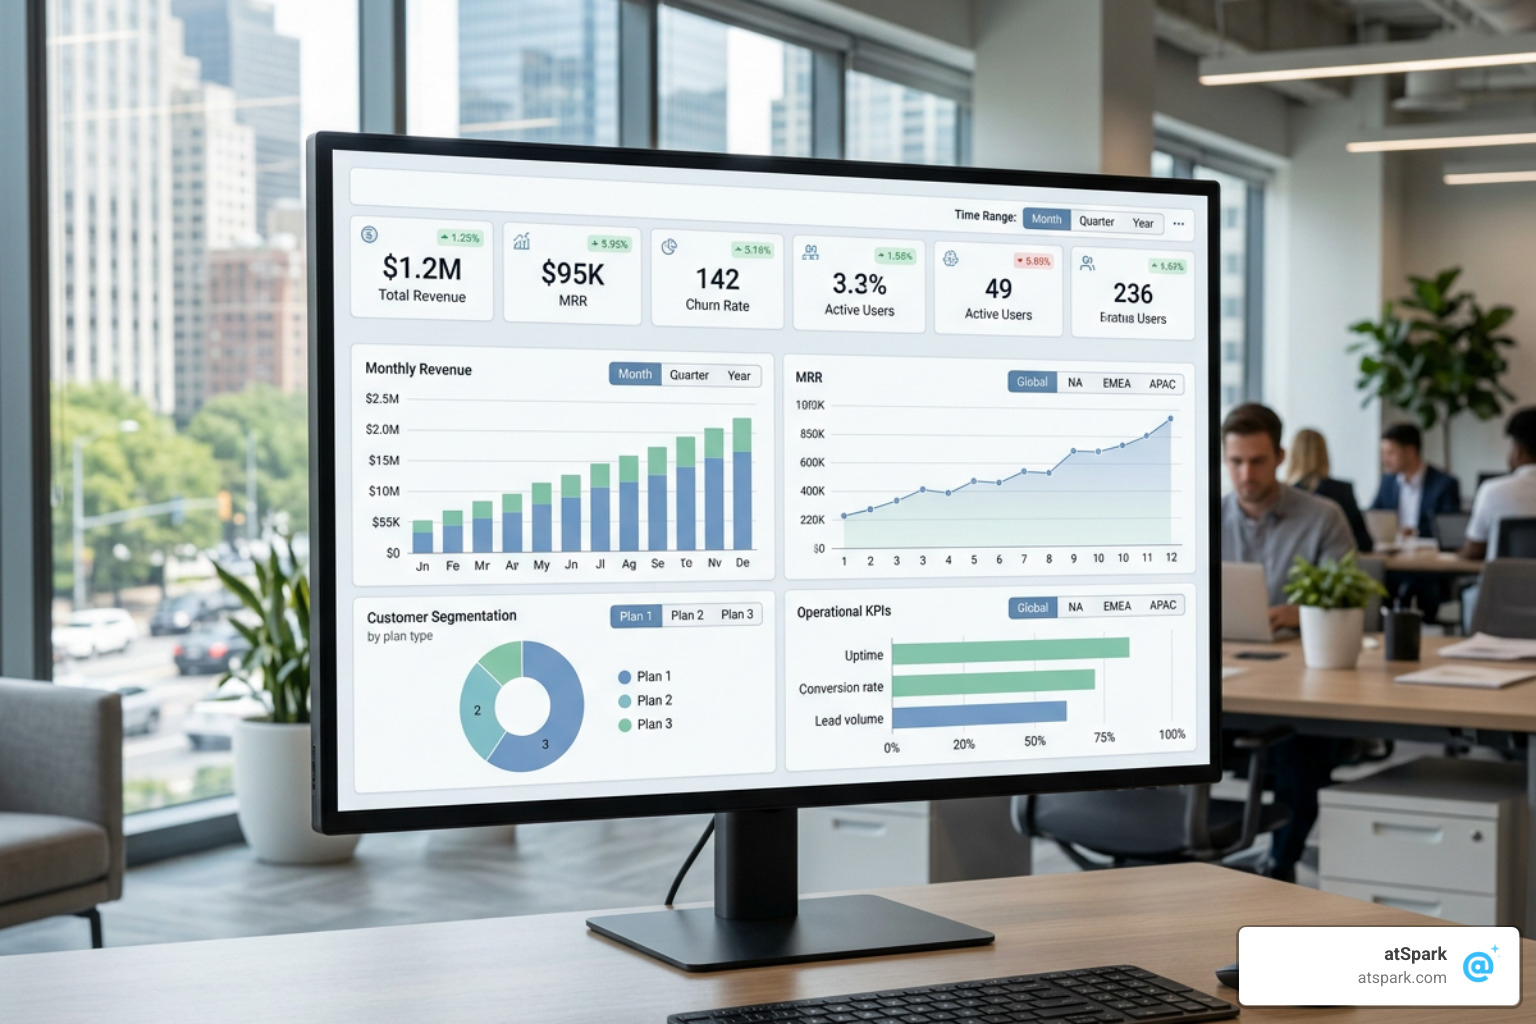
Real-time dashboards allow investors to monitor business health without waiting for the end of the quarter. This transparency builds immense trust. However, we must ensure our dashboard is a single source of truth, reconciling live billing data with our general ledger to prevent conflicting numbers.
To build a real-time reporting engine, check out our guide on creating a SaaS KPI Dashboard and learn how fund managers structure their views in this guide to building an LP Quarterly Report for Fund Managers | Starch.
Automating Reporting and Avoiding Common Mistakes
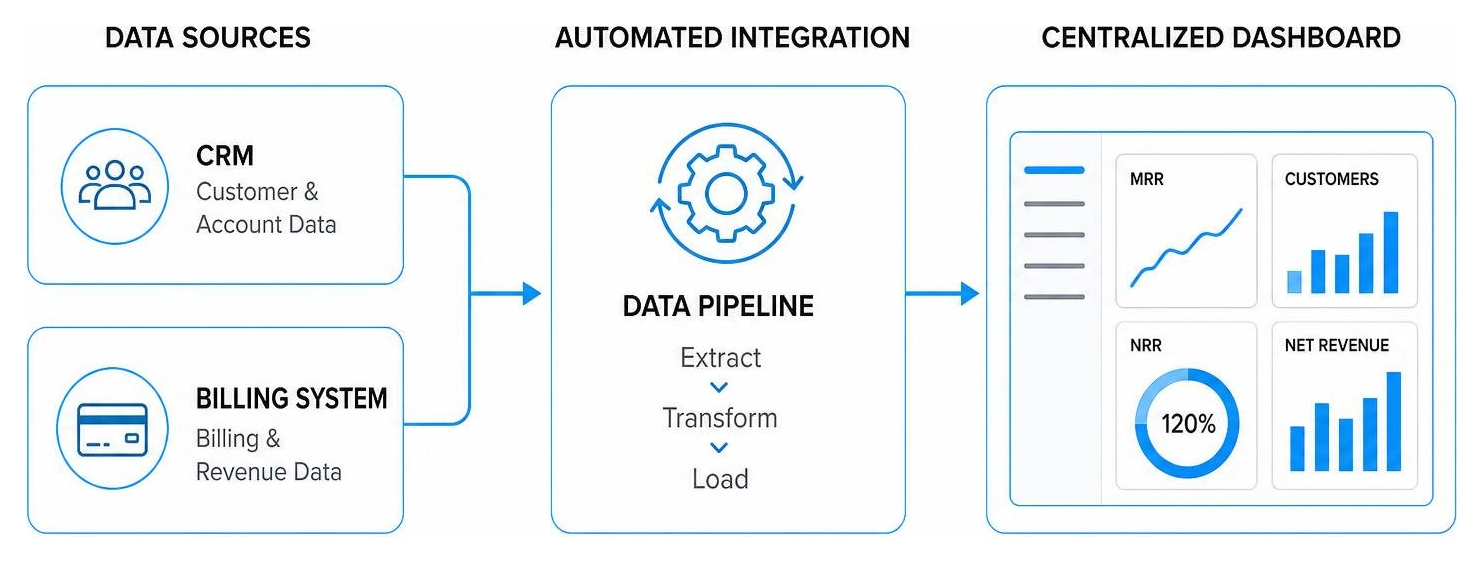
Manual reporting is a major bottleneck. The hours spent copy-pasting data from Stripe, Salesforce, and QuickBooks into Excel are hours we aren't spending growing the business.
Common Mistakes Founders Make with Financial Data
The most common reporting mistakes we see founders make include:
- Relying on Manual Spreadsheets: Manual spreadsheets are highly prone to version control issues. In fact, automated systems can cut the risk of manual spreadsheet errors by 80%.
- Confusing Bookings with Revenue: Bookings represent a contractual commitment, while recognized revenue is what we have actually delivered under ASC 606. Mixing these up destroys credibility.
- Inconsistent Metric Definitions: Changing how we calculate CAC or LTV from one quarter to the next to make the numbers look better is a massive red flag for investors during due diligence.
To ensure your team is tracking the right metrics consistently, review our comprehensive list of SaaS Metrics To Track.
Leveraging Automation to Reduce Month-End Close Time
By automating our data pipelines, we can completely transform our financial operations:
- 90% Reduction in Close Time: Modern SaaS platforms can reduce month-end close time by up to 90%, turning a multi-week ordeal into a quick validation exercise.
- Recovering Lost Revenue: Automated billing integrations can recover up to 5% of lost revenue by immediately detecting billing errors or omissions.
- Massive Prep Time Savings: Compiling investor reports that used to take 4 hours can be automated to take just 10 minutes.
For more information on setting up these automated pipelines, explore our resources For Finance Teams.
Frequently Asked Questions about SaaS Investor Reporting
What is a healthy gross margin for a SaaS company?
A healthy gross margin for a SaaS company is 70% to 85%. To maintain this, we must ensure that all hosting costs, third-party API fees, customer support salaries, and payment processing fees are accurately categorized under Cost of Goods Sold (COGS).
When should a SaaS startup hire professional accounting services?
Most SaaS startups should consider professional accounting services once they reach $10,000 to $20,000 in monthly recurring revenue (MRR) or when they begin raising venture capital. Early-stage bookkeeping is simple, but managing deferred revenue and ASC 606 compliance quickly becomes too complex for founders to handle alone. Professional SaaS accounting services typically range from $500 to $5,000+ per month depending on company stage.
How does ASC 606 impact SaaS revenue recognition?
ASC 606 requires SaaS companies to recognize revenue over the course of the subscription term as services are delivered, rather than at the point of payment. This means upfront annual payments must be placed into a deferred revenue account on the balance sheet and recognized month-by-month.
Conclusion
SaaS investor reporting shouldn't be a source of quarterly panic. When done right, it is a powerful tool for building investor trust, aligning your team, and securing your next round of funding.
But to get there, we have to move past the messy reality of disconnected spreadsheets.
That is why we built atSpark.
atSpark is an AI-powered analytics platform designed specifically for SaaS companies. We unify your billing, CRM, and subscription data into a single, secure source of truth. Instead of waiting days for engineering or SQL help, atSpark lets your finance, RevOps, and executive teams ask plain-English questions and get instant, investor-grade charts, tables, and insights.
Ready to see how conversational, governed analytics can transform your board meetings? Learn more about What Is AI Revenue Analytics and take control of your SaaS metrics today.