The One Acronym That Means Two Completely Different Things
The debate around annual recurring revenue vs annual run rate trips up even experienced finance leaders — and the reason is embarrassingly simple: both metrics share the exact same abbreviation, ARR.
Here is the quick answer most people need:
| Annual Recurring Revenue (ARR) | Annual Run Rate | |
|---|---|---|
| What it measures | Predictable revenue from active subscription contracts | Any recent revenue extrapolated to a full year |
| Includes one-time fees? | No | Yes (unless excluded manually) |
| Formula | Active subscription MRR × 12 | Recent period revenue × annualization factor |
| Reliability | High — based on committed contracts | Low — assumes nothing changes |
| Best used for | Investor reporting, valuations, SaaS health | Internal estimates, early-stage forecasting |
| Who uses it | SaaS companies, VCs, board decks | Any business needing a quick revenue projection |
The stakes are real. Imagine pitching a Series A investor and reporting $3M ARR — only to have them discover $800K of that figure came from one-time implementation fees. Your actual ARR is $2.2M. That gap can cost you the deal, or at minimum, your credibility in the room.
The confusion runs deeper than just a shared acronym. These two metrics can produce wildly different numbers from the same underlying revenue data, and mistaking one for the other leads to bad hiring decisions, inflated valuations, and forecasts that fall apart under scrutiny.
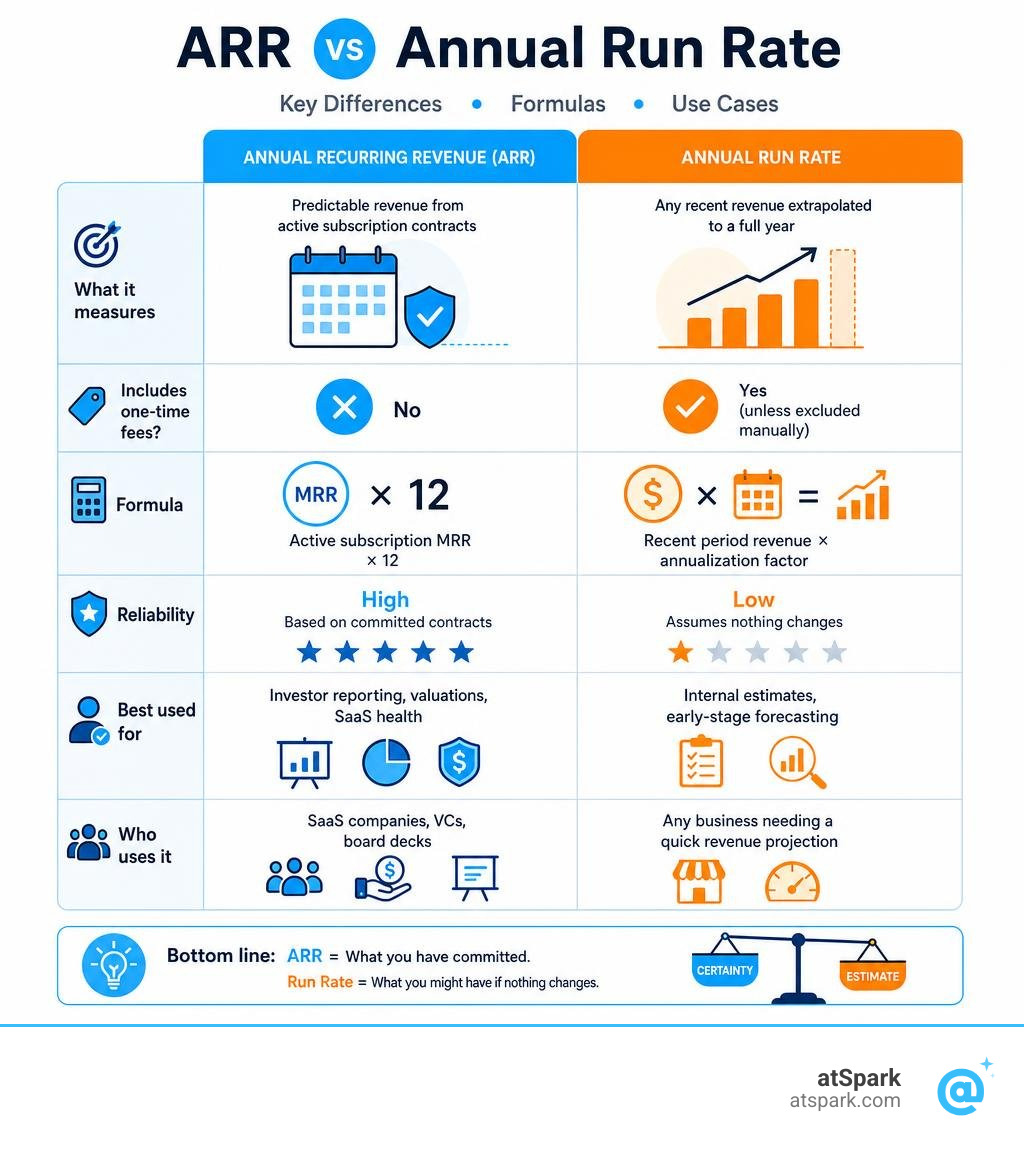
The Core Difference: Annual Recurring Revenue vs Annual Run Rate
To understand why so many founders mix these up, we have to look at the qualitative difference between predictable revenue and speculative projection.
ARR (Annual Recurring Revenue) is a measure of contractually committed, repeating subscription revenue over the next 12 months. It represents a highly stable, predictable baseline. If you stop acquiring new customers tomorrow, your ARR is the revenue you can reasonably expect to collect over the next year, assuming your churn stays at zero. It is the standard metric used to evaluate the financial health of Software-as-a-Service (SaaS) and subscription-based business models.
Annual Run Rate (often called Annualized Run Rate or Revenue Run Rate), on the other hand, is a forward-looking hypothesis. It takes a short window of financial performance — a week, a month, or a quarter — and multiplies it to project what a full year would look like if conditions remain completely constant. It is a "financial radar" that helps highly volatile or fast-growing sectors capture shifts early, but it is fundamentally speculative.
As we discuss in our breakdown of ARR vs Run Rate Revenue: Key Differences Explained | VC Beast, the core difference lies in predictability and what gets annualized. While ARR strictly annualizes your MRR (Monthly Recurring Revenue) from active subscriptions, the Annual Run Rate annualizes all revenue streams, including one-off sales, consulting fees, and transactional spikes.
How to Calculate and Compare Both Metrics
To get an accurate picture of your business, you must separate your recurring and non-recurring revenue streams. This requires looking closely at your contract terms and how billing cycles are structured. In our guide on SaaS Metrics to Track, we emphasize that mixing these inputs is the most common reason financial models break.
Calculating ARR: What to Include and Exclude
When calculating your true Annual Recurring Revenue, you must be disciplined about what enters the equation.
What to include:
- Ongoing subscription fees (monthly, quarterly, or annual plans normalized to their annual value).
- Contractually committed minimum usage fees.
- Upgrades and expansion revenue from active customers.
What to exclude:
- Professional services and consulting fees.
- One-time setup and implementation fees.
- Variable, uncommitted usage overages.
- Hardware sales or non-recurring training fees.
Including professional services or setup fees in your ARR calculations artificially inflates your recurring health. While these services bring in cash, they carry a much lower Gross Margin than software, require manual labor to deliver, and do not repeat automatically. To keep your metrics clean, track these non-recurring streams in a separate bucket. For a deeper look at managing these streams, check out Stripe's resource on Understanding Recurring Revenue: MRR and ARR | Stripe.
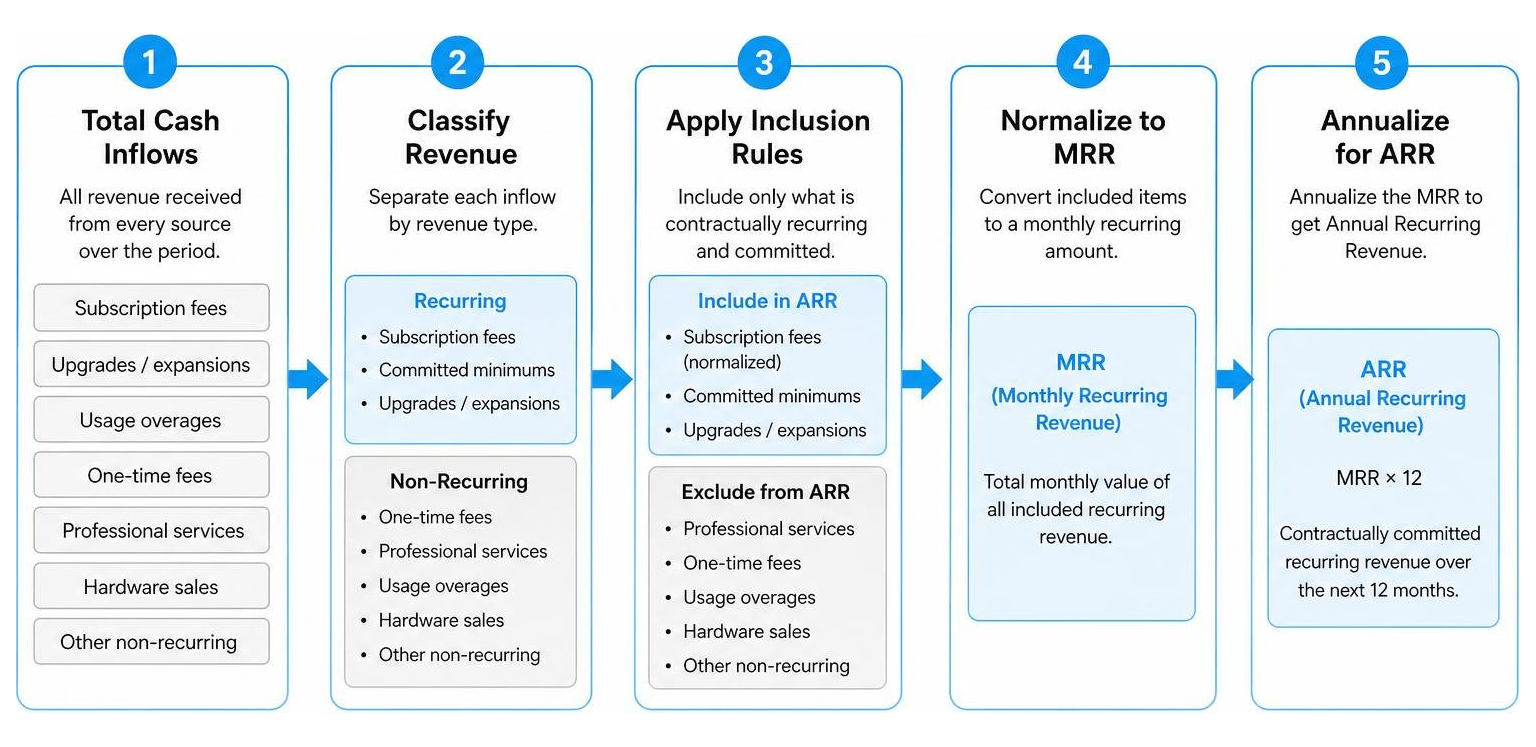
Calculating the annual recurring revenue vs annual run rate Formulas
Let's look at the mathematical formulas.
To calculate Annual Recurring Revenue (ARR), you must first normalize all your subscription contracts to a monthly equivalent to find your Monthly Recurring Revenue (MRR). You can use our MRR Calculator to do this automatically. Once you have a clean MRR figure, the formula is:
ARR = MRR × 12
If you have a mix of contract terms, you should annualize each subscription individually. For example, a customer paying $100/month, a customer on a $300/quarter plan, and a customer on a $1,200/year plan all contribute exactly $1,200 to your ARR.
To calculate Annual Run Rate, you take the total revenue from a recent period and multiply it by an annualization factor:
- Monthly Extrapolation:
Monthly Run Rate = Current Month Revenue × 12 - Quarterly Extrapolation:
Quarterly Run Rate = Current Quarter Revenue × 4 - Daily Extrapolation:
Daily Run Rate = (Revenue in Period / Days in Period) × 365
As highlighted in The Annualized Run Rate Formula Every SaaS CEO Misuses (And the Fix) - SaasCEO.com, the danger is that CEOs often use the monthly extrapolation formula on their total revenue (including one-time spikes) and call the result "ARR" in front of investors. This is a fast way to lose credibility during due diligence.
Limitations of Annual Run Rate and When to Use Each Metric
While Annual Run Rate is incredibly simple to calculate, it has major limitations. Because it assumes a business will neither add nor subtract any customers for the next 12 months, it is highly sensitive to timing and volatility.
Mitigating the Risks of Speculative Run Rates
The biggest risk of using run rate is growth overestimation. If you sign a massive one-off enterprise contract or experience a temporary post-launch surge, annualizing that single month will paint a wildly unrealistic picture of your future performance.
Similarly, if your business is seasonal, run rate can be highly deceptive. Imagine a tax preparation SaaS annualizing its April revenue; the resulting projection would suggest the business is massive, while annualizing its August revenue would make it look like it is on the verge of bankruptcy.

To mitigate these risks, businesses should:
- Use Trailing Averages: Instead of annualizing a single month, use a trailing-3-month (T3M) or trailing-6-month (T6M) average multiplied by 12. This smooths out short-term volatility.
- Track the Burn Rate and Runway: Ensure your run rate projections are paired with metrics like Burn Rate and Runway to monitor how fast you are actually spending cash relative to your baseline.
- Analyze the Burn Multiple: Use the Burn Multiple to evaluate how efficiently your cash burn is generating net new recurring revenue.
- Apply the Rule of 40: High-performing SaaS companies balance growth and profitability. Use the Rule of 40 (Growth Rate + Free Cash Flow Margin) as a health check alongside your run rate.
Choosing the Right Metric: annual recurring revenue vs annual run rate by Stage
When is it more appropriate to track MRR, ARR, or Run Rate? It largely depends on your company's stage and billing model.
- Early-Stage SaaS (Under $1M ARR): When you are in the pre-revenue or early-growth phase, your historical data is limited. Early-stage SaaS companies typically see as much as 68% growth in their first year, or roughly 4.4% growth in MRR each month. At this stage, MRR is your best friend because it is sensitive to weekly product and pricing changes. Run rate is useful here for quick internal planning or early-stage angel pitches where you need to show directional scale.
- Scaling SaaS ($1M to $10M ARR): This is the transition zone. Top-quartile bootstrapped companies reach $1M ARR in 2 years (which is only 4 months slower than VC-backed businesses). Here, you should track both ARR for high-level board planning and MRR for operational decisions. Most Series A investors look for $1M to $5M in ARR, and they will expect a clean, contract-backed ARR figure rather than a speculative run rate.
- Mature SaaS ($10M+ ARR): At this scale, month-to-month fluctuations feel like noise. ARR is the canonical metric for external reporting, annual budgeting, and investor valuations.
For a practical decision framework on which metric to lead with, refer to ARR vs MRR vs Run Rate: Formulas and Uses.
Reconciling ARR with GAAP Revenue and Building an ARR Bridge
One of the most common points of confusion for founders and boards is why their ARR does not match the revenue on their GAAP income statement.
Why GAAP Revenue and ARR Reconcile to Different Numbers
GAAP (Generally Accepted Accounting Principles) revenue is backward-looking. Under ASC 606, revenue must be recognized ratably over the life of the contract as the service is delivered.
ARR, however, is a forward-looking snapshot. It reflects the annualized value of active contracts right now.
This creates significant timing differences:
- Mid-Year Contracts: If a customer signs a $120K annual contract on July 1st, your ARR instantly increases by $120K on that day. However, your GAAP income statement will only recognize $60K of that revenue by December 31st (representing the 6 months of service actually delivered).
- Non-Recurring Streams: Professional services and onboarding fees are recognized under GAAP but must be excluded from ARR.
- Timing of Churn: If a customer submits a cancellation notice in October but their contract runs through December, they immediately drop out of your ARR (or are flagged as Revenue Churn), but they continue to generate GAAP revenue until their active service period officially concludes.
For a detailed reconciliation framework, see ARR vs Revenue: Differences and Reconciliation | DualEntry.
How to Build an ARR Bridge for Your Board
To explain how your recurring revenue changes over time, you should build an ARR bridge. This is a critical tool for board meetings and investor relations, showing exactly how new business, expansions, and churn compound to create your ending ARR.
The bridge is built using the following components:
- Beginning ARR: Your starting point.
- New ARR: Recurring revenue added from brand-new customers.
- Expansion MRR (Annualized): Additional revenue from existing customers upgrading their plans or buying more seats.
- Contraction MRR (Annualized): Revenue lost from existing customers downgrading their plans.
- Churned ARR: Revenue lost from customers cancelling their subscriptions entirely.
By combining these, you calculate your Net New MRR (annualized) to find your Ending ARR:
Ending ARR = Beginning ARR + New ARR + Expansion ARR - Contraction ARR - Churned ARR
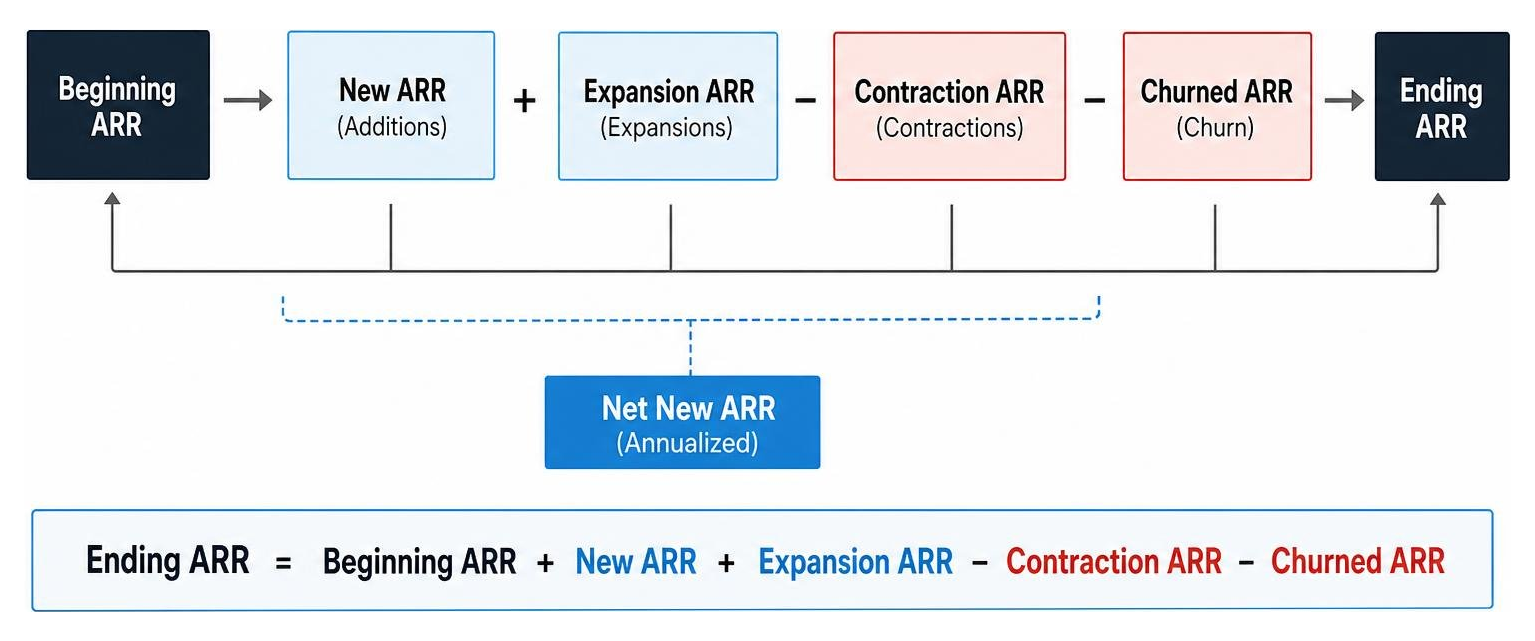
From this bridge, you can also calculate your Net Revenue Retention and Gross Revenue Retention. Companies with an NRR of 100% or higher grow significantly faster than those below 100%, as customer retention compounds year over year.
Frequently Asked Questions about SaaS Revenue Metrics
Can ARR be higher than GAAP revenue?
Yes, ARR is frequently higher than trailing 12-month GAAP revenue for fast-growing SaaS companies. Because ARR represents a real-time, annualized snapshot of your current contract base, it immediately captures the full value of recently signed contracts. GAAP revenue, by contrast, only reflects the portion of those services that have already been delivered over the past year.
Conversely, ARR can be lower than GAAP revenue if a company has significant non-recurring revenue streams (like professional services or one-time setup fees) that are recognized on the GAAP income statement but excluded from ARR.
Does ARR include one-time setup or professional services fees?
No. ARR strictly measures predictable, recurring subscription revenue. One-time setup charges, implementation fees, professional services, and training costs must be excluded. Including them is one of the most common calculation mistakes founders make, and experienced investors will quickly strip them out during due diligence.
What is the difference between MRR and ARR?
MRR (Monthly Recurring Revenue) and ARR are mathematically direct relatives—ARR is simply MRR multiplied by 12. However, they are used in different contexts. MRR is an operational metric used by product and growth teams to track short-term momentum, while ARR is used for long-term planning, budgeting, and investor valuations. For a breakdown of how companies transition between the two, check out What is the difference between MRR and ARR? · AskedWell.
Conclusion
Understanding the distinction between annual recurring revenue vs annual run rate is not just about keeping your accounting clean—it is about building trust with your board, your investors, and your team. Relying on a speculative run rate can lead to over-hiring and unrealistic planning, while tracking a clean, contract-backed ARR gives you a solid foundation for sustainable growth.
But keeping these metrics accurate should not require your finance team to spend hours wrestling with complex SQL queries or building fragile spreadsheets that break every time a customer upgrades.
This is why we built atSpark.
atSpark is an AI-powered analytics platform for SaaS companies that unifies your billing, CRM, and subscription data into a single source of truth. Instead of writing database queries, you can ask plain-English questions like "What was our expansion ARR last quarter?" or "Show me our ARR bridge for the past 12 months," and get instant, board-ready charts and tables.
Ready to simplify your SaaS metrics and unlock real-time insights? Explore What is AI Revenue Analytics? or dive deeper into our ARR glossary to master your subscription metrics today.