The Best MRR Tracking Analytics Platforms Compared (2026)
Choosing the right MRR tracking analytics platform can be the difference between making confident revenue decisions and flying blind with a Stripe dashboard open in 10 browser tabs.
Here are the top options at a glance:
| Platform Type | Best For | Key Strength |
|---|---|---|
| Legacy Subscription Analytics | Growth-stage SaaS | Out-of-the-box SaaS metrics & charts |
| Payment Processor Dashboards | Early-stage bootstrappers | Free, built-in transaction tracking |
| Custom BI Stacks | Enterprise with data teams | Highly customizable, SQL-based |
| AI-Powered Revenue Analytics | Modern RevOps & Finance | Conversational queries, unified data layer |
Most SaaS finance and RevOps teams hit the same wall: their billing tool processes payments, but it doesn't actually explain what's happening to revenue. Is growth accelerating? Is churn compounding quietly? Which customer segments are expanding?
Generic tools don't answer those questions. Dedicated platforms do.
And the stakes are real. Subscription companies can lose up to 9% of MRR every single month from failed payments alone — before a single customer intentionally cancels.
This guide compares the leading platform types across cost, accuracy, and fit so you can stop reconciling spreadsheets and start making decisions with clean numbers.
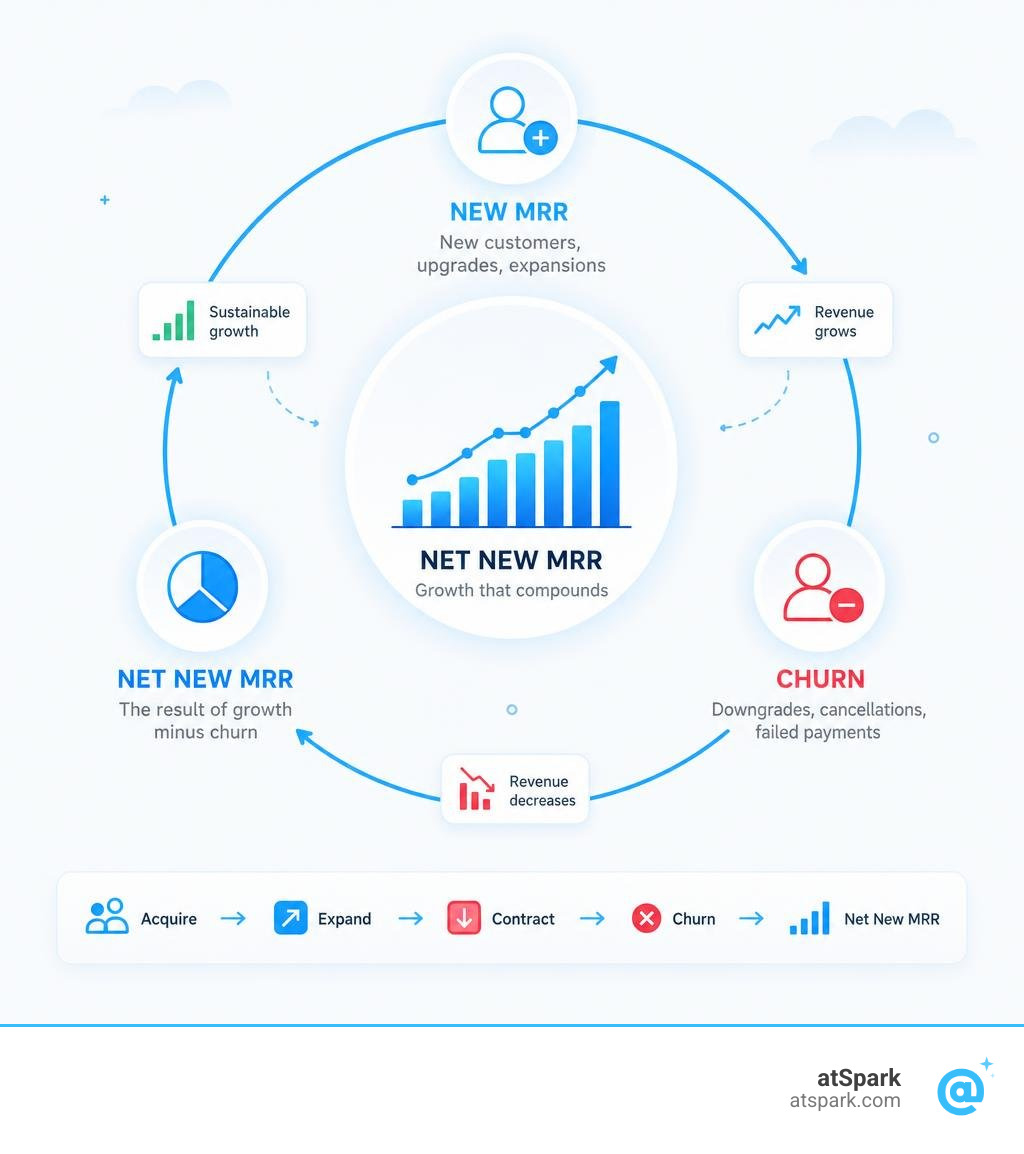
Why Your SaaS Needs a Dedicated MRR Tracking Analytics Platform

Every SaaS business owner knows that MRR (Monthly Recurring Revenue) is the ultimate health metric. It represents the predictable, normalized baseline of your subscription business. But calculating it accurately is surprisingly difficult.
Many early-stage founders rely on their payment processor's default dashboard. While Stripe is an exceptional tool for processing credit cards, its native analytics are secondary features. Stripe is built for transaction processing and accounting, not for deep customer lifecycle analysis.
This is where a dedicated MRR tracking analytics platform steps in. Without one, you are highly likely to base strategic decisions on skewed metrics. For instance, payment gateways often struggle to distinguish between a mid-cycle upgrade (which is true expansion revenue) and a brand-new customer sign-up. They also frequently fail to align with ASC 606 Revenue Recognition Standards when dealing with complex multi-month contracts or deferred revenues.
Relying on raw payment logs means your ARR (Annual Recurring Revenue) can easily be inflated by one-time setup fees, or deflated because your system failed to normalize an annual plan. If you are preparing for a funding round or looking to list your business on acquisition databases like TrustMRR (which sees over 180K monthly visitors looking for verified SaaS metrics), clean, auditable financial records are non-negotiable.
To build a sustainable business, you must look beyond the surface. Understanding SaaS Metrics to Track requires a dedicated system that unifies your billing lifecycle with customer behavior. If you don't, you run the risk of committing the classic error explained in Why You Are Probably Confusing Annual Recurring Revenue With Run Rate—a mistake that can derail board meetings and sink investor trust.
Understanding the Core Components of MRR
To truly understand your revenue momentum, you cannot view MRR as a single, static figure. A dedicated analytics platform breaks your revenue down into five moving parts:
- New MRR: The recurring revenue added from entirely new customers acquired during the month.
- Expansion MRR: Additional revenue generated from existing customers who upgrade their plans, buy add-ons, or cross over usage thresholds.
- Contraction MRR: The revenue lost when existing customers downgrade to lower-tier plans or remove add-ons without canceling entirely.
- Churn MRR: The revenue lost when customers cancel their subscriptions completely.
- Reactivation MRR: Revenue from previous customers who had churned but have now returned to a paid plan.
When combined, these components give you your Net New MRR, which is the true driver of your growth velocity.
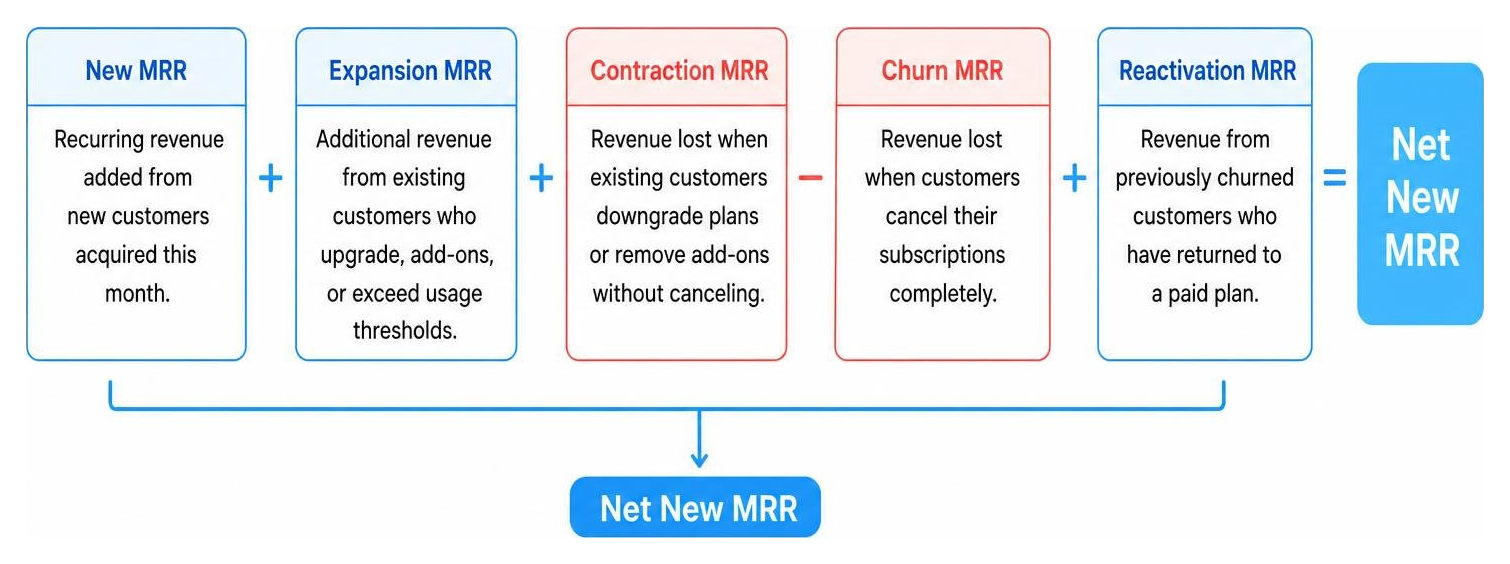
By monitoring how these pieces shift, you gain immediate operational feedback. For example, if your New MRR is skyrocketing but your Net New MRR is flat, you have a leaky bucket. Conversely, if your Expansion MRR is high, it proves you have strong product-market fit and a highly successful upsell strategy. These core components are the building blocks of all vital SaaS Growth Metrics.
Common Pitfalls in Manual MRR Calculations
If you are still using spreadsheets to calculate your revenue, you are likely falling into several common calculation traps:
- Failing to Normalize Multi-Month Plans: If a customer purchases a $1,200 annual plan in January, your manual tracker might record a $1,200 spike in January and $0 for the next 11 months. In reality, that plan must be normalized to contribute exactly $100 to your MRR every month.
- Including Non-Recurring Fees: Setup fees, custom development charges, and one-off consulting sessions are great for cash flow, but they are not recurring. Including them artificially inflates your MRR and skews your valuation.
- Ignoring Failed Payments and Delinquent Accounts: Many basic dashboards continue to count paused, delinquent, or retrying credit cards as active MRR. This creates a false sense of financial security until the accounts are finally written off as churn.
- Multi-Currency Mishandling: If you bill in USD, EUR, and GBP, simply converting them at today's exchange rate can make your MRR fluctuate wildly due to foreign exchange (FX) movements, rather than actual customer growth.
To see how these errors impact your bottom line, you can use our interactive MRR Calculator to quickly test different subscription intervals and isolate true recurring figures from one-off spikes.
The Core Features of a Modern Revenue Analytics Tool
A modern revenue analytics tool does more than just display a line chart of your revenue growth. It acts as a central command center for your entire subscription business.
To guide strategic growth, the platform must offer robust data segmentation. You should be able to segment your subscribers by pricing tier, acquisition channel, sign-up cohort, or geographical region. This level of granularity allows you to identify your most profitable cohorts and double down on what works.
Furthermore, a comprehensive SaaS KPI Dashboard should tie your financial metrics to SaaS Product Usage Metrics. When you can see that customers who use a specific feature three times a week have a 90% lower churn rate, you can align your product development and customer success teams around those high-value actions.
Key Capabilities of an Enterprise-Grade MRR tracking analytics platform
As your SaaS scales, your billing logic inevitably becomes more complex. An enterprise-grade MRR tracking analytics platform must handle:
- Complex Billing Models: Hybrid setups combining tiered flat fees, usage-based overages, and seat-based add-ons.
- Multi-Currency Support: The ability to isolate FX-driven revenue changes from actual customer expansion, ensuring your growth metrics aren't distorted by global currency markets.
- Advanced Unit Economics: Native, automated calculations for ARPU (Average Revenue Per User). Understanding this metric is vital for tracking lifetime value trends, as detailed in our guide on Mastering the Average Revenue Per User Calculation for Your Business.
Reducing Churn with Automated Recovery and Insights
Revenue leaks are a silent killer. Churn doesn't just happen when a customer decides to click "cancel." In fact, subscription companies can lose up to 9% of their MRR monthly due to failed payments, expired cards, and network declines. This is known as involuntary churn.
An advanced revenue analytics platform combats this by integrating automated dunning and payment recovery systems. These tools automatically email customers before their cards expire and execute smart retry logic when payments fail.
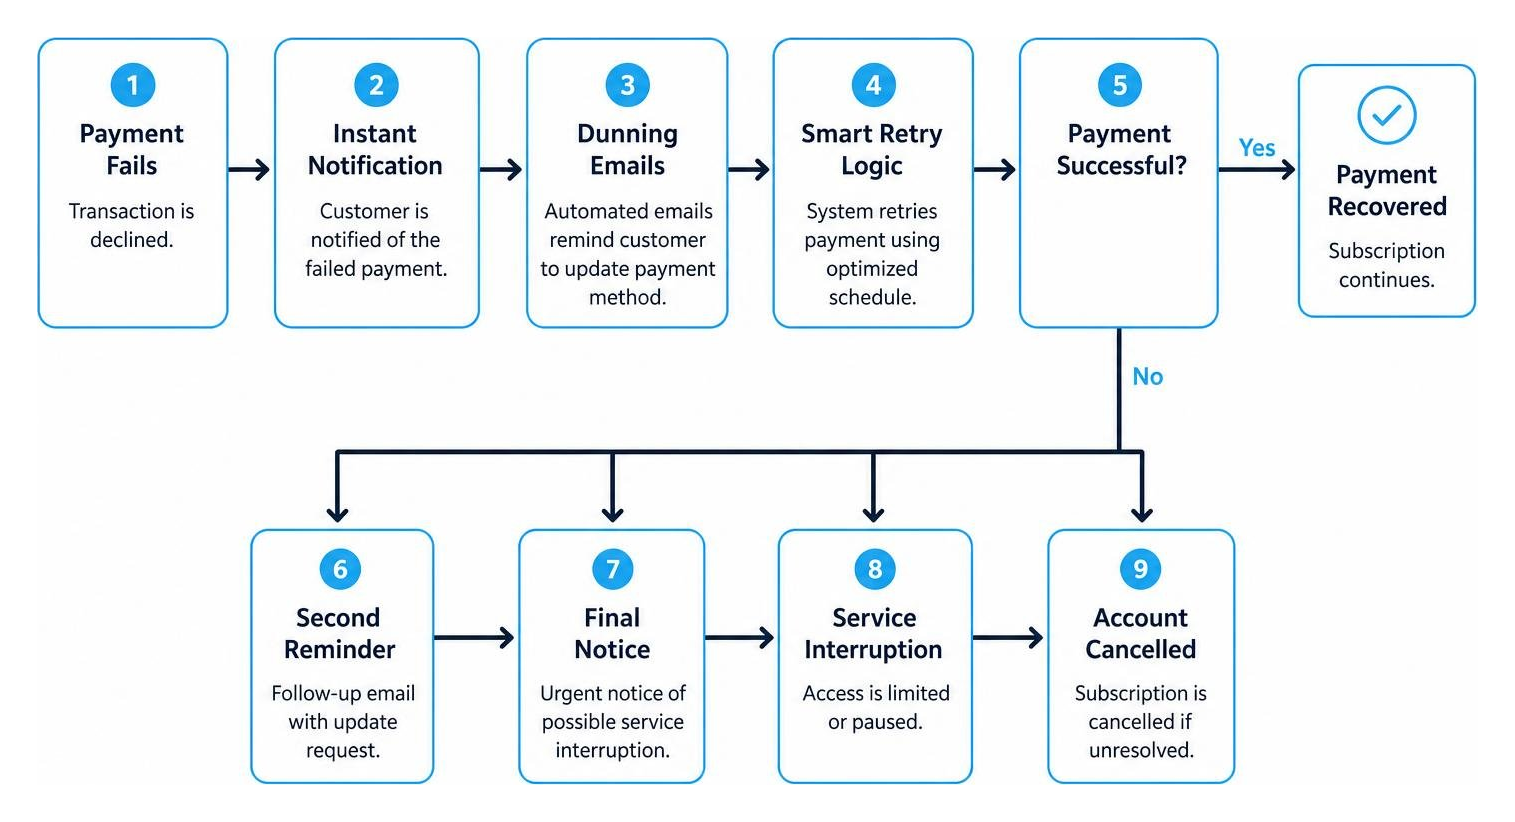
Additionally, the platform should track your overall Customer Churn Rate and distinguish it from Revenue Churn. If you lose 5% of your low-tier customers but 0% of your enterprise accounts, your customer churn looks high, but your revenue churn remains healthy.
To calculate your exact losses, use our Churn Rate Calculator and explore actionable playbooks in How to Stop Your SaaS Customers From Slipping Away to plug the leaks in your revenue bucket.
Comparing Platform Types: How to Choose the Right Fit
Not all analytics platforms are built the same way. Depending on your size, technical resources, and billing setup, the ideal tool will vary.
| Feature / Capability | Billing Dashboards (e.g., Stripe Native) | Dedicated Legacy Analytics | AI-Native Platforms (e.g., atSpark) |
|---|---|---|---|
| SQL / Engineering Needed | None | Low (requires initial setup) | None (Plain-English queries) |
| Data Unification | No (Billing data only) | Limited (Some CRM integrations) | Yes (Unifies Billing, CRM, & Product) |
| Accrual P&L Support | No | No | Yes |
| Multi-Currency Accuracy | Low (Basic conversion) | Medium (Translates but lacks FX isolation) | High (Isolates FX fluctuations) |
| Price Point | Free / Low | Medium ($100 - $500+/mo) | Value-driven |
When evaluating these options, look at how they calculate critical health ratios like NRR (Net Revenue Retention), GRR (Gross Revenue Retention), and the SaaS Quick Ratio. A healthy Quick Ratio (typically above 4.0) indicates that your new revenue and expansion are comfortably outpacing your churn and contraction.
Selecting the Best MRR tracking analytics platform for Your Business Model
The right fit depends heavily on your stage and operational complexity:
- Solo Founders & Bootstrappers: Lightweight, budget-friendly tools provide clean, daily email digests without the enterprise price tag.
- Product-Led Growth (PLG) Startups: Specialized PLG analytics platforms excel at connecting free trial activity to downstream revenue events, helping you optimize conversion funnels.
- Enterprise & Complex Sales: Enterprise-grade billing analytics platforms are designed to handle customized enterprise invoices, manual payment terms, and multi-currency reconciliations that break standard PLG billing software.
To quickly model your retention health, you can run your numbers through our NRR Calculator and Quick Ratio Calculator to see where your business stands.
Traditional BI vs. Dedicated Subscription Analytics
Many growing companies assume they need to build a custom business intelligence (BI) stack using a data warehouse (like Snowflake or BigQuery) and a visualization tool (like Tableau).
However, building a custom BI stack requires significant engineering resources, ongoing maintenance, and advanced SQL knowledge. If your metric definitions change, someone has to rewrite the SQL queries, which often leads to conflicting numbers across different departments.
Dedicated subscription analytics platforms bypass this headache. They have built-in billing models that understand the subscription lifecycle out of the box. For example, setting up a cohort analysis to see how customer retention behaves over time is a one-click process in a dedicated tool, whereas it would require a highly complex SQL query in a traditional BI tool. To understand how to leverage these cohorts, check out our MRR Cohort Analysis Complete Guide.
Frequently Asked Questions about MRR Tracking
Why is Stripe's native MRR calculation often inaccurate?
Stripe’s native calculations are often approximations because they are primarily based on active subscription price objects rather than actual invoice reconciliations. Stripe does not always normalize annual plans correctly over a 12-month period, and it can easily misclassify mid-cycle upgrades, trial periods, or manual discounts, leading to inflated or deflated metrics.
What is the difference between tracking MRR and total revenue?
MRR is an operational metric designed to measure the predictable momentum of your recurring subscription business. It normalizes all subscription intervals and strictly excludes non-recurring items like setup fees, consulting, and taxes. Total revenue, on the other hand, is an accounting metric that records all cash collected or recognized in a given period, including one-time payments and variable fees.
How does churn impact long-term cash flow forecasting?
Churn has a devastating compound effect on your cash flow. A seemingly small 5% monthly churn rate compounds to a massive 46% annual revenue loss. This compounding erosion directly drains your cash runway, making it incredibly difficult to scale. To model these long-term impacts and map out sustainable customer lifespans, read our guide on Customer Lifetime Value Forecasting Models and Heuristics That Actually Work.
Conclusion
At the end of the day, your SaaS metrics shouldn't require an entire data engineering team to exist. While legacy platforms force you to choose between rigid, over-engineered dashboards or writing manual SQL queries, modern teams are moving toward intelligent, unified solutions.
At atSpark, we believe in giving you instant financial clarity. Our AI-powered analytics platform unifies your billing, CRM, and subscription databases into a single, secure semantic layer. Instead of wrestling with complex tools, you can simply ask plain-English questions—like "What was our Expansion MRR by product tier last month?"—and get instant, board-ready charts and insights.
Ready to get clean, trustworthy numbers and align your team? Supercharge Your RevOps Growth with atSpark today.