Why Your Subscription Mix Analysis Is the Key to Hidden SaaS Profits
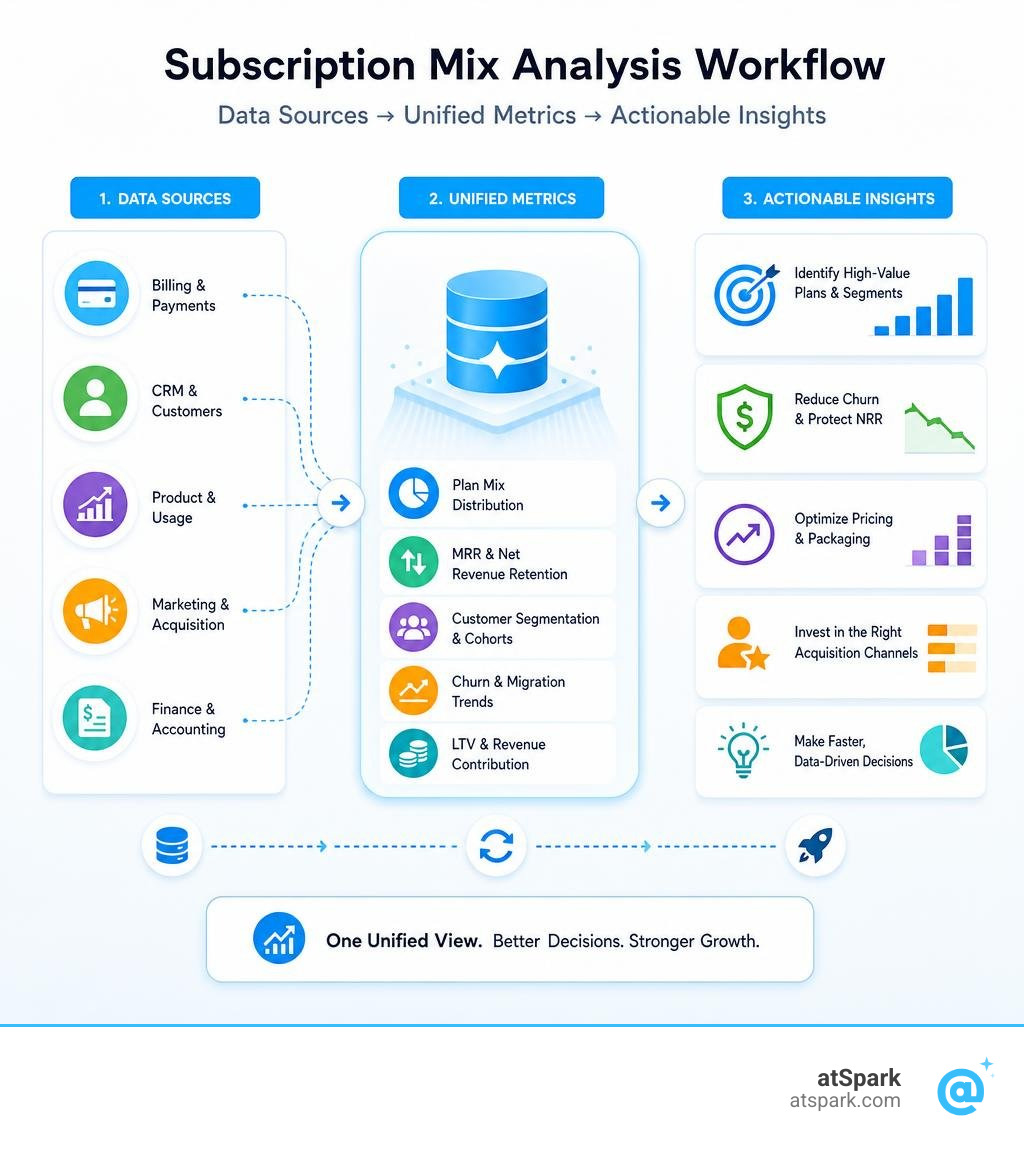
atSpark subscription mix analysis gives revenue and finance teams a clear, real-time picture of how different subscription plans, pricing tiers, and acquisition channels contribute to overall revenue — without waiting on data engineers or stitching together spreadsheets.
Here's what subscription mix analysis tells you at a glance:
- Which plans generate the highest LTV and lowest churn
- Which acquisition channels bring subscribers who actually stick around
- How tier migrations (upgrades, downgrades, cancellations) shift your MRR over time
- Where your Net Revenue Retention (NRR) is at risk — and from which customer segments
Most SaaS dashboards can tell you that revenue beat plan last quarter. What they can't tell you is why — or more importantly, who is about to leave and which plan mix is quietly eroding your margins.
Think about this scenario: a CEO asks at 3:55 p.m., right before a 4:00 p.m. board call, "What happens to NRR if we lose our bottom decile of customers?" A static dashboard built around anticipated questions has no answer. That gap — between the metrics you have and the decisions you actually need to make — is exactly where subscription mix analysis lives.
For finance and RevOps leads at venture-backed SaaS companies, fragmented data across Stripe, HubSpot, QuickBooks, and Salesforce makes this problem worse. You end up reconciling the same numbers manually, quarter after quarter, before you can even start the analysis.
atSpark is built to close that gap — connecting your billing, CRM, and accounting data into a single source of truth, so subscription mix analysis becomes a daily habit rather than a quarterly fire drill.
Unifying Fragmented Data for a Complete Subscription View
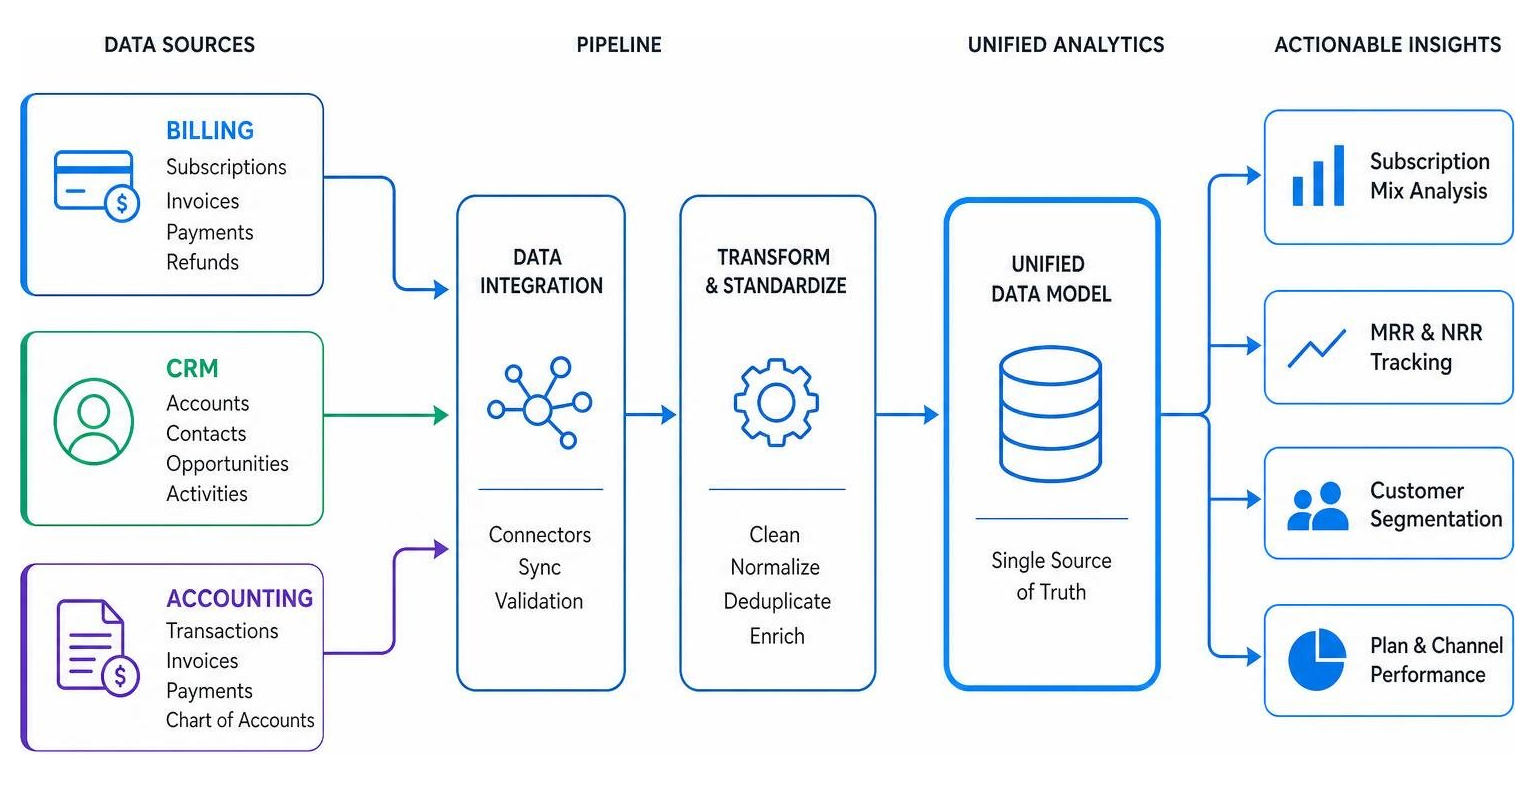
In modern SaaS companies, subscription data is rarely in one place. It is scattered across billing platforms (like Stripe), CRM systems (like HubSpot or Salesforce), and accounting software (like QuickBooks or Zoho). When you try to analyze your subscription performance, you are forced to export several CSV files, run complex VLOOKUPs, and hope that your formulas don't break.
We built our platform to eliminate this manual spreadsheet stitching. By connecting to over 300 native data sources via automated pipelines (powered by reliable sync engines like Airbyte), we bring all your disparate data into a single, unified analytics warehouse. This gives you a complete, real-time view of your customer journey from the first touchpoint in your CRM to the latest invoice cleared in your accounting ledger.
When you unify your revenue stack, you can trust that your metrics are based on a single source of truth. This makes it possible to track Important SaaS Metrics accurately and consistently across your entire organization.
The Core Metrics of Subscription Health
To run a successful subscription business, you must look beyond basic revenue numbers and understand the core metrics that drive your health. Our platform automatically calculates and standardizes over 150 metrics, including:
- Monthly Recurring Revenue (MRR): The normalized monthly measure of your predictable revenue. We track how this moves over time, breaking down the components of MRR Glossary into new business, expansion, contraction, and churn.
- Annual Recurring Revenue (ARR): The annualized value of your recurring revenue, helping you project your long-term growth. We help you track ARR Glossary to keep your board and investors aligned.
- MRR Growth Rate: The speed at which your recurring revenue is scaling. Understanding your MRR Growth Rate Glossary allows you to evaluate the success of your go-to-market strategies.
- Customer Lifetime Value (LTV): The total revenue you expect to earn from a single customer account over their lifetime. We break down the LTV Glossary by plan, acquisition channel, and cohort.
- Churn Rate: The percentage of your customers or revenue lost over a given period. Tracking your Churn Rate Glossary is critical to identifying product-market fit and customer success issues.
- Expansion and Contraction MRR: The revenue gained from existing customers upgrading their plans versus the revenue lost when they downgrade. We monitor both Expansion MRR Glossary and Contraction MRR Glossary to help you understand your account expansion dynamics.
- Net New MRR: The net change in your recurring revenue, calculated as (New MRR + Expansion MRR) - (Contraction MRR + Churn MRR). You can read more about how this is structured in our Net New MRR Glossary.
To calculate these metrics accurately, we also track your Average Revenue Per User (ARPU). You can explore how we calculate this metric in our ARPU Glossary, read our comprehensive ARPU Meaning Guide, and dive into Mastering ARPU Calculation to optimize your pricing.
B2B SaaS vs. D2C Subscription Analytics Approaches
While both B2B SaaS and Direct-to-Consumer (D2C) companies rely on recurring revenue, their analytics strategies are completely different.
In B2B SaaS, the focus is on multi-seat accounts, complex contract terms, expansion revenue, and high-touch customer success. Metrics like Net Revenue Retention (NRR) and Net Negative Churn are the primary indicators of health.
On the other hand, D2C subscription analytics platforms focus heavily on transactional, cohort-level revenue tracking. In D2C, acquisition costs keep rising while retention remains a constant battle. Most D2C brands make the mistake of optimizing solely for first-order Return on Ad Spend (ROAS). However, the real profit margin in D2C lives in months 3 through 12 of the subscriber lifecycle. D2C analytics must connect marketing spend directly to subscriber-level revenue over time to identify which ad sets bring high-LTV customers and which ones result in quick churn.
Understanding these differences is crucial when evaluating your revenue metrics. To see how these monetization strategies compare, you can read our guide on How ARPU Compares to CLV.
Optimizing Revenue with atSpark Subscription Mix Analysis
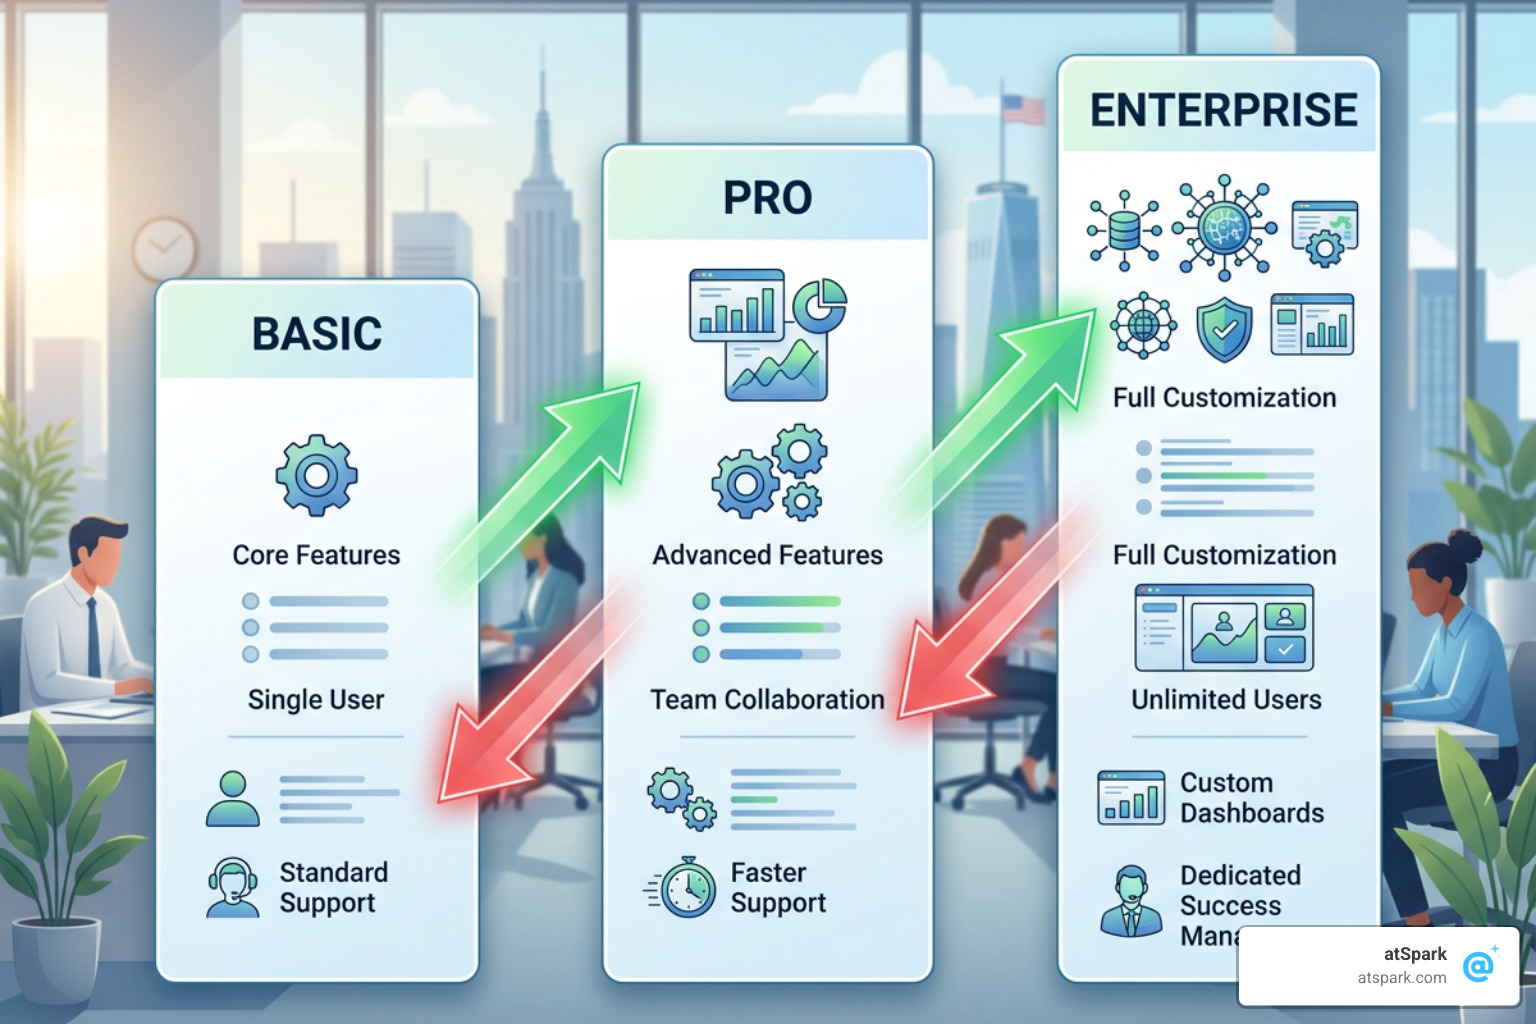
An optimized subscription mix is the secret weapon of high-growth SaaS companies. If all of your customers are on your lowest-priced tier, you are leaving substantial revenue on the table. Conversely, if your highest-tier plan has a massive churn rate, your pricing structure may be misaligned with the value you deliver.
With atSpark subscription mix analysis, you can easily break down your revenue performance by plan, pricing tier, and acquisition channel. This analysis helps you answer critical strategic questions:
- Which pricing tiers drive the highest customer lifetime value?
- Are customers on annual plans significantly more loyal than those on monthly plans?
- Which marketing channels bring in customers who upgrade over time?
By analyzing plan migrations—how often customers move between tiers—you can identify exactly where your pricing model is succeeding or failing. This continuous optimization is one of the most important SaaS Metrics to Track to ensure sustainable, profitable growth.
How Cohort Analysis Powers atSpark Subscription Mix Analysis
Cohort analysis is the foundation of subscription mix optimization. Instead of looking at your customer base as a single, static group, cohort analysis groups your subscribers by the month or week they signed up. This allows you to track their behavior, retention, and revenue contribution over time.
By combining cohort analysis with subscription mix metrics, you can see how changes to your product, pricing, or onboarding flow affect different groups of customers. For example, if you raised your prices in January 2026, you can compare the retention curve of the January cohort against the December 2025 cohort to see if the price change impacted churn.
To master this technique, check out our Cohort Analysis Glossary and our step-by-step MRR Cohort Analysis Guide.
Simulating Churn Scenarios Using atSpark Subscription Mix Analysis
One of the most powerful features of our platform is the ability to run predictive churn simulations. Instead of waiting for churn to happen and viewing it as a lagging indicator, your team can proactively model the impact of losing specific customer segments on your overall revenue.
For example, you can simulate what would happen to your Net Revenue Retention (NRR) if a specific industry segment contracted, or if a competitor targeted your mid-tier plan subscribers. By running these scenarios, you can prepare contingency plans, adjust your customer success focus, and protect your core revenue.
To learn more about how churn impacts your business, review our NRR Glossary and our Revenue Churn Glossary.
Advanced Analytics: AI Querying and Enterprise Security
As your SaaS company grows, your data needs become more complex. You need an analytics platform that is both incredibly easy for non-technical team members to use and secure enough to satisfy your enterprise security compliance.
We solve this problem by combining an advanced conversational AI analyst with enterprise-grade data governance. Our platform supports multi-tenant row-level security, ensuring that users only see the data they are authorized to access. Whether you are embedding BI dashboards (from Power BI, Tableau, QuickSight, or Metabase) into your team portal or sharing reports with external stakeholders, your sensitive financial data remains completely protected.

Comparing Dedicated Platforms to Basic Native Billing Dashboards
Many early-stage companies rely on native dashboards provided by their billing platforms, such as Apple's App Store Connect Analytics. While these tools are useful for basic tracking, they have significant limitations when it comes to comprehensive subscription lifecycle tracking.
For instance, Apple's Subscriptions - Monetization - App Store Connect Analytics - Help - Apple Developer tracks mobile app subscription states (like active, billing retry, grace period, and churn), but it does not connect that data to your web-based Stripe billing, your HubSpot CRM records, or your marketing spend. Additionally, Apple only retains churned subscription data for two years, making long-term historical cohort analysis difficult.
Furthermore, relying on native, isolated platforms often leads developers to make costly mistakes. As highlighted in the guide on How to build analytics for your subscription app in one week with Claude Code , many teams turn off highly profitable marketing campaigns prematurely because they lack cohort-based ROAS tracking. They look at day-7 performance and assume a campaign is failing, failing to realize that based on historical cohort curves, those same subscribers will achieve full payback by day 180. A unified platform like atSpark combines all of these touchpoints to prevent these blind spots.
Avoiding Common Pitfalls in Subscription Analytics
When building out your subscription analytics, there are several common mistakes that can lead to poor decision-making:
- Relying on manual spreadsheets: Static spreadsheets are prone to human error, quickly become outdated, and require hours of manual work to maintain.
- Ignoring contraction and expansion: Focusing only on new business MRR while ignoring why existing customers are downgrading or upgrading will give you an inaccurate picture of your product's health.
- Failing to track efficiency ratios: To understand if your subscription model is scaling efficiently, you must track metrics like the SaaS Quick Ratio, which measures your ability to grow recurring revenue relative to your churn. You can learn more about this in our SaaS Quick Ratio Glossary.
- Attempting to build complex custom pipelines: Many engineering teams spend months building custom data pipelines only to struggle with maintaining them. A no-code setup with native connectors is faster, more reliable, and allows your developers to focus on your core product.
Frequently Asked Questions about Subscription Mix Analysis
To help you understand the key differences in how subscription metrics are tracked across different business models, we have compiled a comparison table:
| Metric | B2B SaaS Focus | D2C Subscription Focus |
|---|---|---|
| Primary Goal | High account retention, seat expansion, contract value growth | High volume acquisition, long-term subscriber retention |
| Key Performance Indicator | Net Revenue Retention (NRR), LTV:CAC | Month 3-12 margin, Cohort-level ROAS, Payback Period |
| Expansion Driver | Upselling seats, cross-selling features, usage-based pricing | Cross-selling physical products, add-on boxes, frequency increases |
| Churn Type Focus | Voluntary churn (account cancellations, downgrades) | Involuntary churn (failed credit cards), high early-stage drop-offs |
How does atSpark secure sensitive financial data?
We take data security incredibly seriously. Our platform utilizes industry-standard AES-256 encryption for all data at rest and in transit. We also employ strict multi-tenant isolation and role-based access control (RBAC), meaning your team members only see the specific subscription metrics and dashboards relevant to their roles.
What is the difference between voluntary and involuntary churn?
Voluntary churn occurs when a customer actively decides to cancel their subscription (for example, if they no longer need the software or are switching to a competitor). Involuntary churn occurs when a subscription ends due to payment failures, such as expired credit cards or bank declines.
In mobile ecosystems like Apple's, there is a 60-day billing retry window to recover these failed payments before a subscription is officially marked as churned. Monitoring both types of churn separately is essential for identifying whether your losses are due to product satisfaction issues or simple billing friction.
How can teams use conversational AI to query subscription data?
Our built-in AI analyst allows anyone on your team to ask questions about your subscription performance in plain English. Instead of writing SQL queries or waiting days for a business analyst to build a custom report, you can simply type: "Show me our MRR growth rate by plan tier for the last three quarters." The platform instantly generates the exact charts, tables, and insights you need in seconds.
Conclusion
Optimizing your subscription mix is one of the fastest ways to unlock hidden profits in your SaaS business. By moving away from static, fragmented dashboards and unifying your billing, CRM, and accounting data, you gain the clarity needed to make confident, data-driven decisions.
With atSpark, you get a unified revenue stack, predictive churn simulations, and an intuitive conversational AI that makes deep subscription analytics accessible to your entire team.
Ready to transform your subscription data into actionable growth? Optimize your revenue with our Sales Forecast Guide and see how easy it is to scale your business with atSpark.