Why Your Pipeline Number Is Lying to You Right Now
Your weighted pipeline growth rate is one of the most important numbers you're probably not tracking correctly — and it's costing you forecast accuracy every single quarter.
Here's the quick answer if you need it fast:
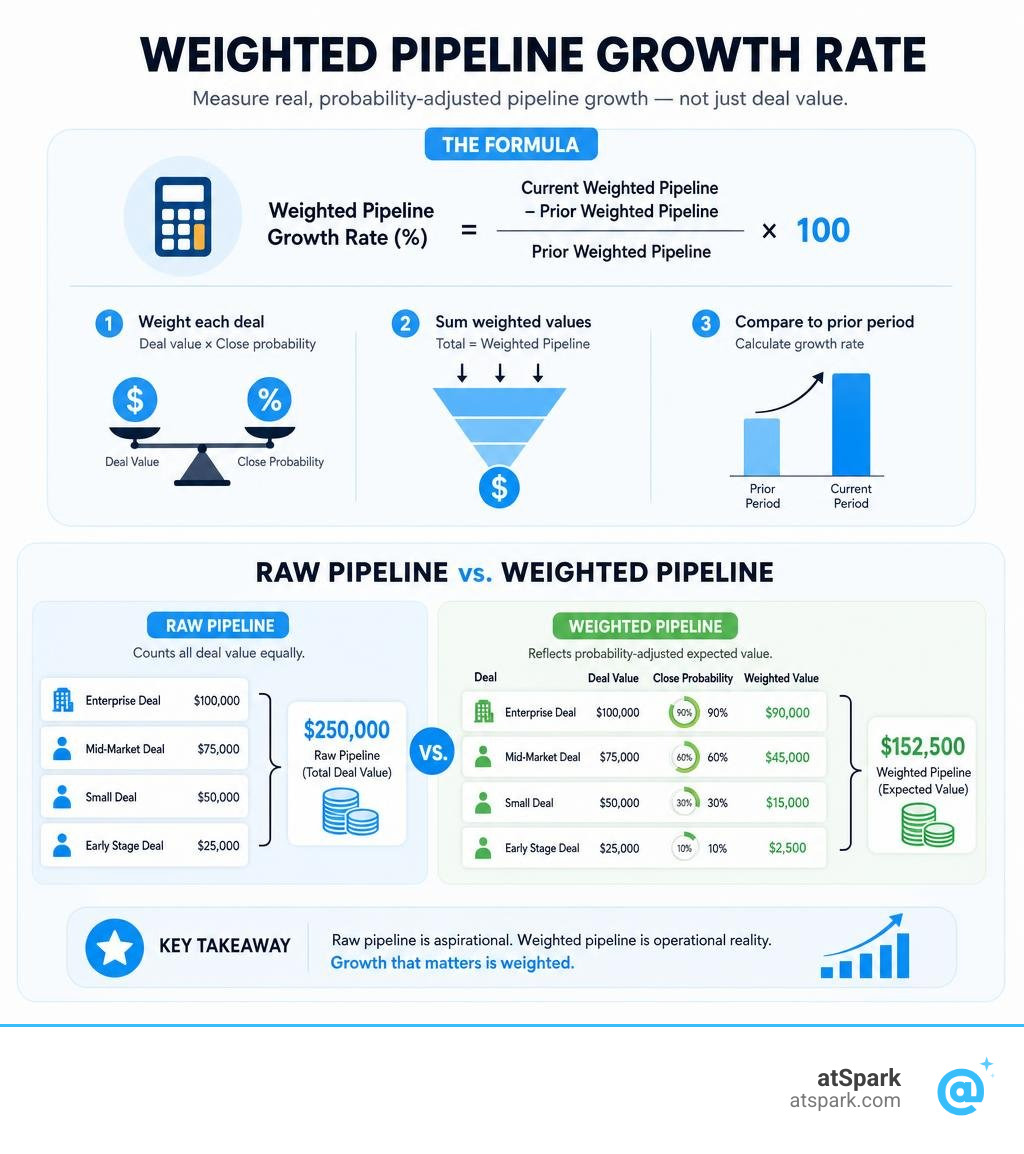
Weighted Pipeline Growth Rate measures how your probability-adjusted pipeline value changes over time (month-over-month or quarter-over-quarter). It tells you whether your real, expected revenue is expanding — not just whether your raw deal count is going up.
How to calculate it:
- Multiply each open deal's value by its stage close probability to get its weighted value
- Sum all weighted values to get your total weighted pipeline for the period
- Compare to the prior period:
(Current Weighted Pipeline - Prior Weighted Pipeline) / Prior Weighted Pipeline × 100
Why it matters more than raw pipeline growth:
| Metric | What It Shows | The Problem |
|---|---|---|
| Raw pipeline growth | Total deal value added | Treats a 10% deal the same as a 90% deal |
| Weighted pipeline growth rate | Probability-adjusted expansion | Reflects actual expected revenue growth |
Here's how bad the gap can get in practice. A founder walked into an investor meeting with $250,000 in raw pipeline. The weighted value was only $95,000 — a 62% difference that directly affected the outcome of that conversation. And this isn't unusual. Gartner data shows 93% of sales leaders miss their number by more than 10%, often because they're steering with unweighted pipeline totals.
For a RevOps or finance lead, this is the core problem: raw pipeline looks healthy right up until the quarter closes wrong. The total dollar figure in your CRM is aspirational. The weighted number is operational reality.
This guide walks you through exactly how to calculate weighted pipeline growth rate, calibrate it with real historical data, and use it to build forecasts your board will actually trust.
What is a Weighted Pipeline and Why Does Raw Pipeline Lie?
To understand how our pipeline is truly expanding, we must first look at the difference between raw, unweighted pipeline and a weighted pipeline.
Raw pipeline represents the absolute face value of every open opportunity in your CRM. If you have ten deals in your sales pipeline worth $50,000 each, your raw pipeline is $500,000. It is a simple, comforting number. It is also highly deceptive.
A unweighted pipeline treats every opportunity as equally likely to close. It makes no mathematical distinction between a lead that was created ten minutes ago and a contract that is currently sitting with the prospect’s legal team. When we rely solely on this unweighted number, our sales forecast becomes a guessing game based on optimism rather than historical performance.
A weighted pipeline, on the other hand, converts this aspirational total into an operational revenue estimate. It does this by applying a probability multiplier to each deal based on its current stage. If that $50,000 deal is only in the initial discovery phase (with a historical 10% chance of closing), it contributes just $5,000 to your weighted pipeline. If another $50,000 deal is in the final negotiation stage (with a 80% chance of closing), it contributes $40,000.
For a deep dive into the mechanics of probability-based forecasting, check out the "Weighted Pipeline: Probability-Based Opportunity Valuation and Forecasting - 2026 Guide".
The Danger of Unweighted Pipeline Metrics
Relying on unweighted pipeline metrics creates a false sense of security. When we look at a massive gross pipeline number, we often assume we have plenty of runway to hit our targets. This is where "phantom opportunities" creep in—early-stage deals that are highly unlikely to convert but continue to inflate the total pipeline value.
This inflation introduces severe risks into our board reporting and financial planning. Uncalibrated pipelines typically experience 20% to 40% erosion from commit to close. If we make hiring decisions, territory adjustments, or cash flow projections based on unweighted numbers, we are building our business on a foundation of air.
Furthermore, raw coverage ratios can be highly misleading. For many B2B organizations, high-ICP (Ideal Customer Profile) accounts make up only 23% of the total pipeline. The remaining 77% consists of lower-quality, out-of-ICP opportunities that skew our unweighted metrics and lead to missed targets.
Transitioning from Subjective Gut Feel to Statistical Reality
Moving from gut-feel forecasting to a statistical model requires shifting how we evaluate deal progress. Traditional pipelines rely on seller-driven milestones (e.g., "demo completed"). However, these milestones reflect our actions, not the buyer's readiness.
To build a highly accurate weighted pipeline, we must ground our stage probabilities in actual historical conversion rates. Many revenue teams have successfully improved their forecast accuracy from 68% to 91% simply by replacing arbitrary stage weights with objective, buyer-centric readiness questions. Instead of assuming a deal in the "Proposal" stage has a 50% chance of closing, they ask:
- Has the buyer clearly articulated their core problem?
- Is there a documented agreement on our solution fit?
- Has a concrete timing urgency been established?
By combining these buyer-readiness metrics with a standardized pipeline health score, we can flag stagnant deals, apply time-decay factors to aging opportunities, and establish clear risk tiers across our entire forecast.
How to Calculate Your Weighted Pipeline Growth Rate
To accurately measure how our pipeline is expanding, we need to look beyond static snapshots. We must track the rate at which our probability-adjusted pipeline is growing period-over-period.
Let's look at how raw and weighted calculations differ across a typical mid-quarter pipeline:
| Opportunity Name | Raw Value | Pipeline Stage | Historical Probability | Weighted Value |
|---|---|---|---|---|
| Acme Corp | $100,000 | Discovery | 10% | $10,000 |
| Beta Tech | $150,000 | Proposal | 40% | $60,000 |
| Gamma Industries | $200,000 | Negotiation | 70% | $140,000 |
| Delta Labs | $50,000 | Verbal Commit | 90% | $45,000 |
| Total | $500,000 | $255,000 |
In this scenario, our raw pipeline is $500,000, but our actual, risk-adjusted pipeline value is $255,000. If we need to close $200,000 this quarter, our raw pipeline makes us feel completely safe (2.5x coverage). However, our weighted pipeline tells a more honest story: we are much closer to our actual target than the raw numbers suggest, leaving very little room for error.
For more details on calculating your baseline values, see Pipeline Value: How to Calculate & Fix It (2026).
The Basic Weighted Pipeline Formula
To calculate the weighted value of an individual opportunity, we use the following formula:
Weighted Value = Opportunity Value × Close Probability
The close probability should represent your historical deal win probability for that specific stage. To calculate the total weighted pipeline for a given period, we sum the weighted values of all open opportunities:
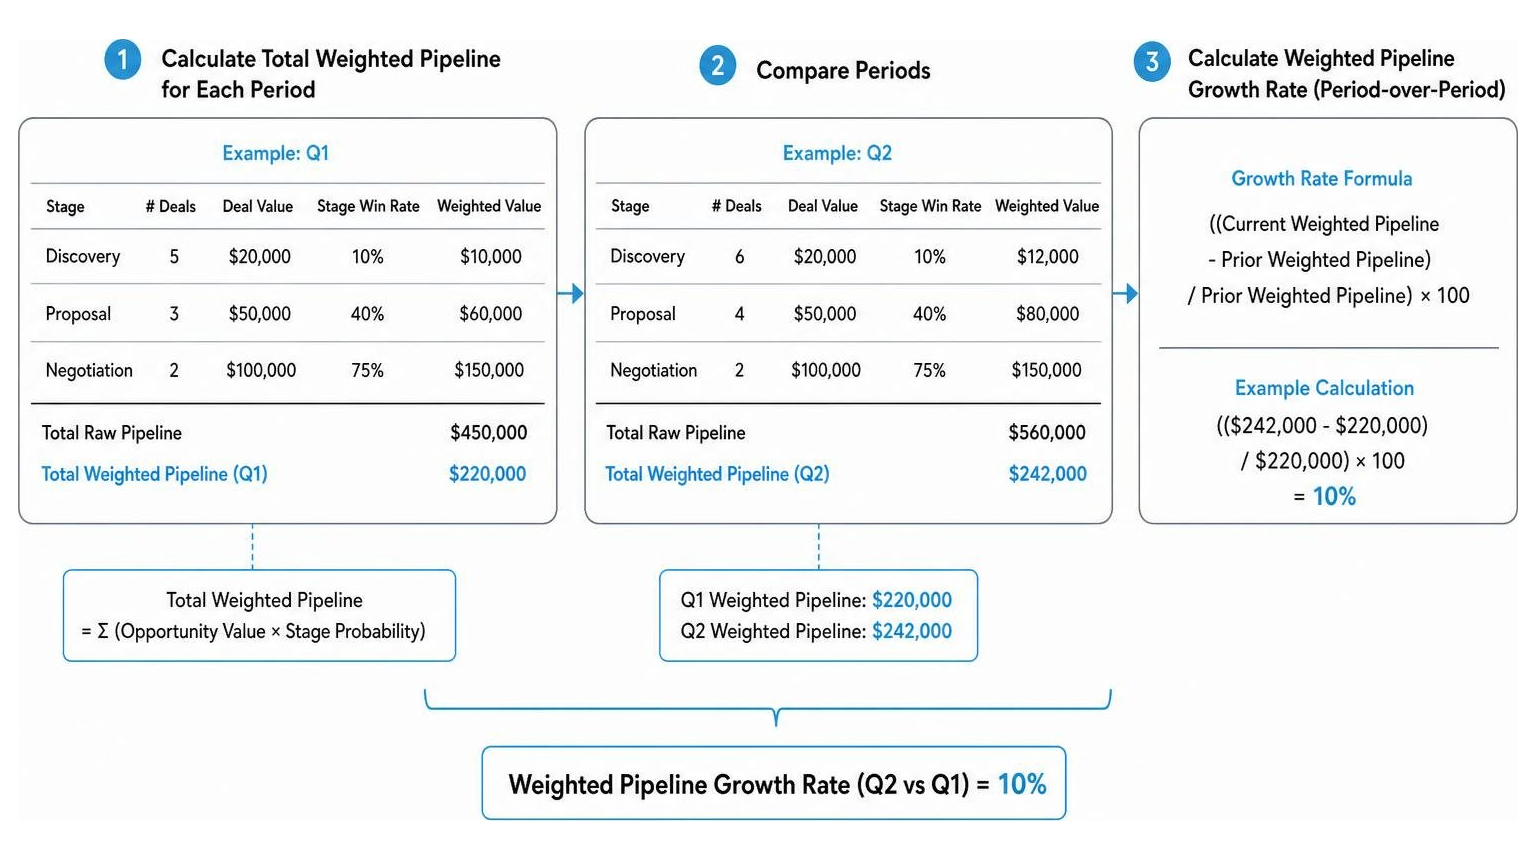
Total Weighted Pipeline = Σ (Opportunity Value × Stage Probability)
Let's walk through a quick mathematical example. If we have:
- 5 deals in Discovery ($20,000 each) at a 10% win rate = $10,000
- 3 deals in Proposal ($50,000 each) at a 40% win rate = $60,000
- 2 deals in Negotiation ($100,000 each) at a 75% win rate = $150,000
Our total raw pipeline is $450,000, but our total weighted pipeline is $220,000 ($10,000 + $60,000 + $150,000).
Calculating the Growth Rate Period-over-Period
Once we have our total weighted pipeline for two different periods, we can calculate our weighted pipeline growth rate. This metric is essential for forecasting our future MRR growth rate and identifying early-stage pipeline bottlenecks before they impact our bookings.
The formula for period-over-period growth is:
Weighted Pipeline Growth Rate = ((Current Weighted Pipeline - Prior Weighted Pipeline) / Prior Weighted Pipeline) × 100
For example, if our weighted pipeline at the end of Q1 was $200,000, and at the end of Q2 it is $250,000, our calculation is:
(($250,000 - $200,000) / $200,000) × 100 = 25% growth
This tells us that our real, probability-adjusted pipeline expanded by 25% over the quarter. If our raw pipeline grew by 50% during that same period, but our weighted pipeline only grew by 25%, it indicates that our top-of-funnel is filling up with early-stage, low-probability deals that aren't progressing through the sales cycle.
Key Metrics That Feed a Reliable Weighted Pipeline Model
A weighted pipeline model is only as accurate as the data we feed into it. To build a highly reliable forecasting engine, we must track several foundational metrics alongside our pipeline growth.

To build a comprehensive picture of pipeline health, we focus on four primary metrics:
- Opportunities Created: The raw number of new deals entering our pipeline.
- Win Rate: Our historical ability to convert open opportunities into closed-won revenue.
- Stage Conversion Rate: The percentage of deals that successfully progress from one stage to the next.
- Sales Cycle Length: The average time it takes for a deal to move from creation to closed-won.
When we combine these metrics, we get a clear view of our sales velocity—the speed at which our pipeline is generating revenue. For a deeper understanding of how these metrics interact, see Weighted Pipeline Definition: Formula & How to Use It.
Tracking Weighted Pipeline Growth Rate Over Time
To get the most value out of our weighted pipeline growth rate, we should analyze it using cohorted win rates. Instead of looking at a static monthly snapshot, cohorted analysis tracks a group of opportunities created in a specific month and monitors their progression over time.
This approach reveals critical patterns in our sales cycle. For example, we might discover that while many opportunities are lost in month two, those that survive past day 60 close at an 80% rate. By applying these time-based insights to our weighted model, we can adjust our probabilities dynamically, making our forecasts much more accurate.
Calibrating Stage Probabilities with Historical Data
One of the most common mistakes revenue teams make is using default CRM probabilities (such as 10%, 25%, 50%, 75%, 90%) without validating them. These round numbers are almost always based on assumptions rather than historical performance.
To calibrate your stage probabilities accurately, we recommend pulling 12 to 24 months of historical closed-won and closed-lost opportunity data. Calculate the actual percentage of deals that entered a specific stage and ultimately ended up as closed-won.
For example, if 100 deals entered your "Proposal" stage over the past year, and only 35 of those were won, your true stage probability is 35%—not the 50% default in your CRM. Recalibrating these probabilities quarterly ensures your weighted pipeline reflects your team's current performance and market dynamics.
Maintaining Forecast Accuracy: Hygiene, Slippage, and Coverage
Even with perfectly calibrated stage probabilities, your weighted pipeline forecast will break down if you don't maintain strict CRM hygiene.
Pipeline hygiene is a leadership priority, not a rep administrative task. To keep our data clean, we must watch out for three primary risk factors:
- Deal Slippage: Opportunities where the close date is repeatedly pushed to future quarters.
- Zombie Deals: Stagnant opportunities with no recorded activity in 14 to 30 days.
- Inaccurate Close Dates: Close dates based on sales rep optimism rather than concrete buyer actions.
To combat these risks, establish a weekly pipeline hygiene checklist. Move any deal with no activity in 30 days to a "stalled" status, and remove deals with no activity in 60 days from your active pipeline entirely.
How Weighted Pipeline Growth Rate Informs GTM Strategy
Tracking your probability-adjusted pipeline growth is essential for shaping your broader go-to-market (GTM) strategy. It directly impacts how we set quotas, design territories, and plan capacity.
Traditionally, organizations rely on the "3x rule"—the idea that you need three times your sales quota in raw pipeline to hit your targets. However, this rule of thumb is outdated and risky. It assumes a flat 33% win rate across all deals, ignoring differences in deal quality, sales cycle length, and stage distribution.
By calculating your pipeline coverage using weighted values, you can set much more realistic targets. Healthy organizations typically aim for a 1.5x to 2.0x weighted pipeline coverage ratio. If your weighted coverage drops below this threshold, it is an early warning sign that you will miss your revenue targets in the coming quarters, giving you time to adjust your marketing and outbound strategies.
For a deeper look at how weighted coverage changes your GTM planning, read Weighted Pipeline Coverage | Revenue Analytics Glossary | ORM.
Common Mistakes in Weighted Pipeline Management
Even experienced RevOps leaders can run into pitfalls when managing a weighted pipeline. Here are the most common mistakes and how to avoid them:
- Using Static Probabilities: Market conditions, product updates, and sales team changes all affect your win rates. Failing to recalibrate your stage probabilities quarterly will make your model less accurate over time.
- Allowing Unregulated Manual Overrides: While reps should have some flexibility to adjust deal probabilities based on unique circumstances, these overrides must be governed. Require manager approval for any manual probability increases over 20%.
- Ignoring Deal Size and Segment Differences: Enterprise deals typically have longer sales cycles and lower win rates than SMB deals. Applying the same stage probabilities to both segments will skew your forecast. Always segment your probabilities by deal size, lead source, and sales motion.
To model your coverage metrics and identify gaps, you can use the Pipeline Coverage Ratio Calculator — Stage-Weighted Forecast (Free).
Frequently Asked Questions about Weighted Pipeline Growth Rate
What is a good weighted pipeline coverage ratio?
For most B2B SaaS organizations, a weighted pipeline coverage ratio of 1.5x to 2.0x of your sales quota is the standard target for a healthy, predictable quarter. Because weighted coverage already discounts your opportunities based on their close probability, you need a much lower multiple than you would with raw pipeline (which typically requires 3x to 5x coverage).
How often should we recalibrate our stage probabilities?
We recommend recalibrating your stage probabilities every quarter. This cadence allows you to account for seasonal variations, changes in your sales team's execution, shifts in buyer behavior, and updates to your product packaging or pricing.
When should we transition from weighted pipeline to AI-driven forecasting?
While a weighted pipeline is an excellent, scalable method for most growing B2B teams, you should consider transitioning to AI revenue analytics once you have high data maturity. If you are managing a high volume of deals, have clean historical CRM data, and want to incorporate complex variables (like buyer engagement signals, email sentiment, and historical rep performance), AI-driven models can help improve your forecast accuracy even further.
Conclusion
Measuring your weighted pipeline growth rate is the key to moving from unpredictable, stressful quarters to consistent, predictable ARR. It bridges the gap between raw CRM data and the financial reality your executive team and board expect.
But manually pulling CRM data, calculating stage-by-stage win rates, and building these reports in spreadsheets is a time-consuming, error-prone process.
That is where we can help. atSpark is an AI-powered analytics platform that unifies your billing, CRM, and subscription data into a single source of truth. Instead of writing complex SQL queries or building fragile spreadsheet models, you can ask plain-English questions like:
"What is our weighted pipeline growth rate this quarter compared to last quarter, segmented by sales motion?"
atSpark instantly generates the precise charts, tables, and insights you need to make confident, data-driven GTM decisions. Ready to bring complete predictability to your revenue forecasting? Explore our weighted pipeline glossary or connect with our team today.