Why Your MRR Churn Rate Exit Interview Program Could Be the Most Valuable 30 Minutes in Your Quarter
Using an MRR churn rate exit interview is one of the fastest ways to stop bleeding subscription revenue — but most SaaS teams either skip it entirely or do it wrong.
Here's the short answer if you need it now:
- Calculate your MRR churn — separate gross from net, and voluntary from involuntary
- Send an exit interview invite within 24 hours of cancellation, from a real person's name
- Ask layered questions — primary reason, then drill-down, then open-ended context
- Match qualitative answers to usage data — find the moment engagement dropped before cancellation
- Segment churned customers by profile — not all churn has the same cause or fix
- Turn patterns into a prioritized action plan — route findings to product, CS, and pricing teams
- Track win-back rate and cohort churn to measure whether your changes actually worked
A founder once told their team that "too expensive" was the top cancellation reason for two straight quarters. They cut prices by 15%. Churn didn't move. The real problem? Customers never completed onboarding and never got value from the product. The exit survey lied — not maliciously, but because customers take the path of least resistance when they're already out the door.
That's the core problem with most exit programs. They collect answers. They don't uncover reasons.
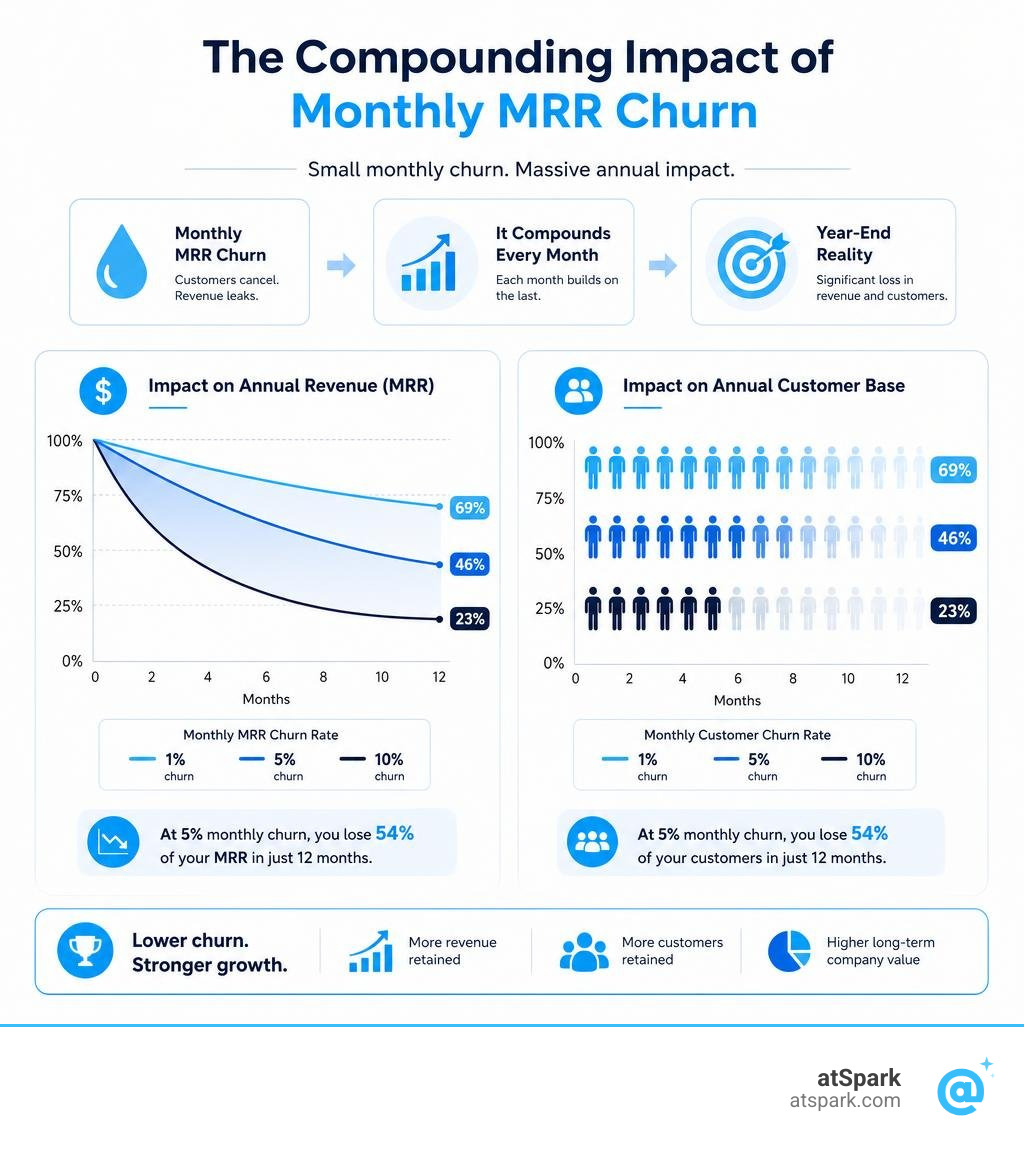
And when your business runs on recurring revenue, the cost of that blind spot compounds fast. A 5% monthly churn rate doesn't sound catastrophic — until you realize it wipes out nearly half your customer base every year. For a RevOps or Finance lead watching MRR, that's not a retention problem. It's a valuation problem.
This guide walks you through how to build an exit interview program that actually surfaces the real drivers of MRR churn — and what to do with what you learn.
Understanding MRR Churn vs. Customer Churn

When we look at subscription health, it is easy to get distracted by the sheer number of customers leaving. This is what we call customer churn (or logo attrition). However, in B2B SaaS, not all customers are created equal. If we lose ten customers paying $15 a month, that is a minor annoyance. If we lose one enterprise customer paying $5,000 a month, that is a board-level emergency.
This is why tracking your Monthly Recurring Revenue (MRR) churn rate is far more critical than simply counting lost logos. Logo churn tells us how many customers we lost, but MRR churn tells us the exact financial impact of those departures.
To understand our business health, we must break down our revenue losses into two distinct metrics: Gross MRR Churn and Net MRR Churn.
- Gross MRR Churn: This measures the total absolute revenue lost due to cancellations and downgrades during a specific period. It is a pure reflection of how well our product and customer experience are retaining the revenue we have already acquired.
- Net MRR Churn: This takes the revenue lost from cancellations and downgrades and subtracts expansion revenue (such as upsells, cross-sells, and plan upgrades) from our remaining customer base.
If we want to dive deeper into these calculations, we can check out our guide on How to Calculate SaaS Churn Rate and Logo Retention or brush up on key terms in our Revenue Churn Glossary.
To understand what these metrics reveal about our business, let's look at how they compare:
| Metric | Formula | What It Reveals About Business Health |
|---|---|---|
| Gross MRR Churn | (Lost MRR + Downgraded MRR) / Starting MRR of the Period | The true leak in our bucket. If this is high (e.g., >5% monthly), it indicates fundamental product, onboarding, or market-fit issues. |
| Net MRR Churn | (Lost MRR + Downgraded MRR - Expansion MRR) / Starting MRR | The overall financial viability of our model. If this is negative, it means our expansion engine is outgrowing our customer losses — the "Holy Grail" of SaaS growth. |
Relying solely on Net MRR Churn can be dangerous. A highly successful sales team might mask a massive churn problem by aggressively upselling remaining customers. If our Gross MRR Churn is high, we are still filling a leaky bucket. Eventually, we will run out of customers to upsell.
Designing the Perfect Exit Interview Framework

Most SaaS exit surveys are built to fail. They consist of a single generic dropdown menu asking, "Why are you leaving?" with options like Too expensive, Missing features, or No longer need it.
These forms fail because they invite polite deflections. In fact, research shows that 47% of open-ended exit survey responses are polite deflections that provide zero actionable insight. Customers choose "too expensive" because it is the fastest, least confrontational way to complete the paperwork and get on with their day.
Furthermore, we must distinguish between voluntary and involuntary churn:
- Voluntary Churn: The customer actively decides to cancel their subscription because they are unhappy, outgrew the tool, or switched to a competitor. This is where qualitative exit interviews are gold.
- Involuntary Churn: The customer's subscription cancels due to payment failures, expired credit cards, or billing system issues. Up to 40% of total SaaS churn is involuntary, requiring zero product changes to prevent.
To uncover the real truth behind voluntary churn, we need a structured, multi-step framework. We cannot rely on superficial forms. Instead, we must design a conversational, layered approach that moves past politeness. For a deeper look at this strategy, explore the insights in Churn Exit Surveys: The Framework That Uncovers Truth (Not Politeness) – Remery Blog and find out how to analyze these patterns in Churn Analysis: The Complete Guide (2026) .
Why the MRR Churn Rate Exit Interview Beats Standard Surveys
To get to the root of why a customer is leaving, we use a psychological technique called laddering. Standard exit surveys collect surface-level symptoms. A structured mrr churn rate exit interview digs five to seven levels deep to find the root cause.
For example, if a customer selects "Too expensive" as their primary cancellation reason, a standard survey stops there. A laddering approach asks:
- Why does the price feel high relative to the value? (The customer answers: "We didn't use it enough.")
- What kept your team from using it daily? ("We couldn't get our data synced properly.")
- What blocked the data sync? ("We needed a direct integration that we couldn't set up.")
Suddenly, a pricing objection is revealed to be an onboarding and integration failure. By asking open-ended questions and utilizing conversational follow-ups, we turn polite lies into product roadmaps.
To understand how these terms fit into your broader customer success metrics, refer to our Customer Churn Rate Glossary. If you are curious about how conversational research can scale, you can read about Why Your Exit Survey Is Lying: Case for AI Interviews and explore Customer Churn Analysis: The Conversational Approach to Understanding Why Customers Leave | Blog | Perspective AI .
Step-by-Step Guide to Conducting an MRR Churn Rate Exit Interview
To build a high-converting, honest exit interview process, we recommend a four-layer approach:
- Layer 1: The Primary Reason (Multiple Choice): Force the user to select one broad category (e.g., product complexity, budget cuts, competitor migration). This gives us clean quantitative data to segment our churn.
- Layer 2: The Drill-Down (Conditional Logic): If they select "competitor," immediately ask which competitor and what specific feature won them over.
- Layer 3: The Open-Text Context: Ask, "What could we have done differently to keep you?" By placing this after the specific drill-down, the customer has already bypassed their polite defenses and will write more candidly.
- Layer 4: The Win-Back Opportunity: Ask if they would be open to returning in the future if their primary issue was resolved.
Timing is everything. We have two main windows to initiate this process:
- Immediate (Inside the App): Ask the first few layered questions directly inside the cancellation flow. Their feelings are fresh, and the context is top of mind. For tips on setting this up, check out How to Run a Churn Survey That Actually Tells You Why People Left | Formaly .
- Delayed (7 Days Later): For high-value accounts, send a personal email from a real customer success manager (or even the CEO) seven days after cancellation. This delay allows their emotions to cool, often resulting in a 34% increase in highly detailed, objective feedback.
To incentivize busy customers to complete this interview, offer a 30-day grace period of extended access. It costs us nothing, demonstrates immense goodwill, gives them time to reconsider, and can boost survey response rates from a generic 12% to an impressive 47%.
For more tips on keeping your customers engaged before they reach this point, read our guide on How to Stop Your SaaS Customers From Slipping Away.
Combining Quantitative Data and the MRR Churn Rate Exit Interview
Qualitative exit interviews are incredibly powerful, but they only represent one side of the coin. To build a truly predictive retention engine, we must combine the why of exit interviews with the what of quantitative subscription and usage data.
When a customer cancels, the formal cancellation is rarely the moment they actually decided to leave. In most SaaS businesses, a visible drop in login frequency, feature usage, or team adoption predates formal cancellation by 3 to 6 weeks. The cancellation is simply the administrative paperwork catching up to a psychological decision made a month prior.
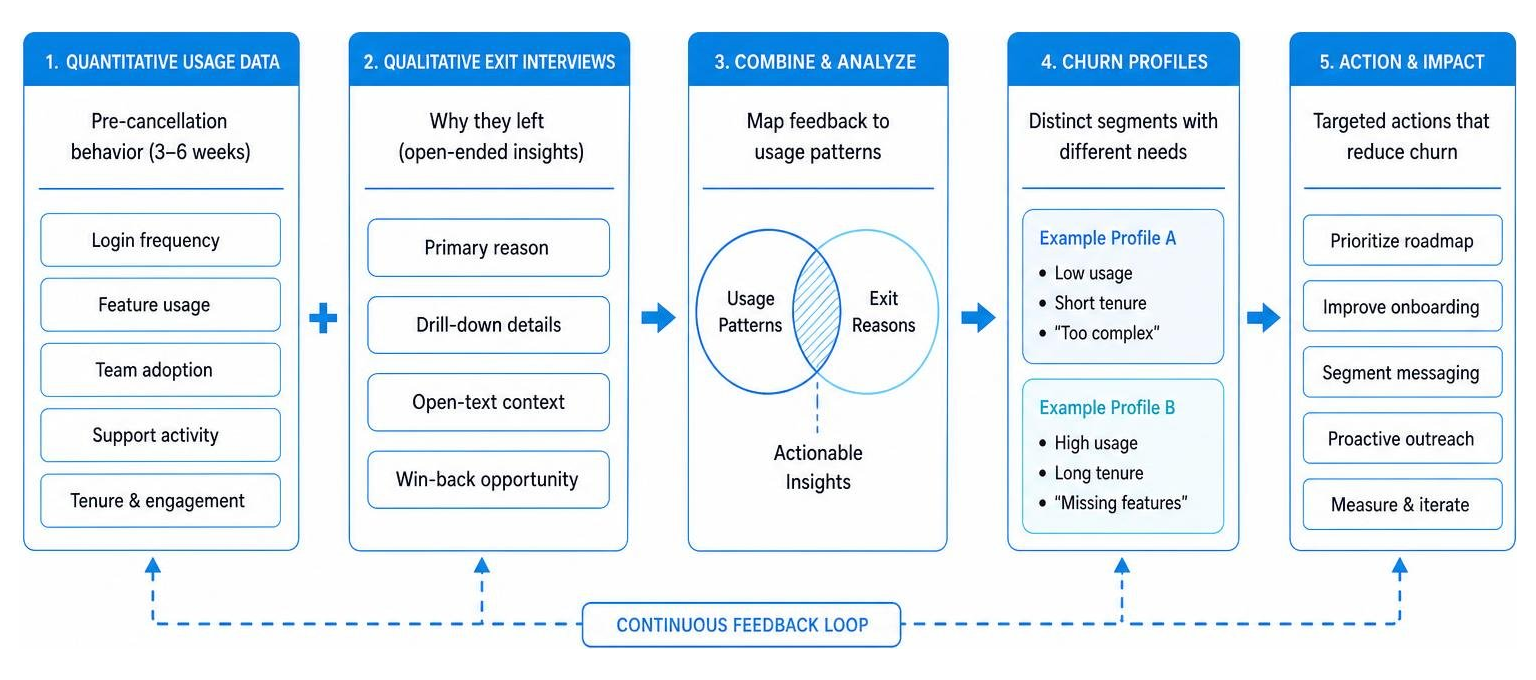
By mapping our exit interview feedback directly against historical usage data, we can build distinct customer churn profiles. For example, in a classic B2B project management SaaS case study, the team observed an overall monthly churn rate of 4.2%. On the surface, it looked like a single, uniform problem. But when they combined exit interview transcripts with 90-day pre-cancellation usage data, they discovered two completely opposite customer profiles:
- The "Too Complex" Profile: These were mostly small business accounts with an average tenure of just 5.5 months and a low feature adoption rate of 13%. In their exit interviews, they stated the product was "overwhelming."
- The "Missing Features" Profile: These were larger enterprise accounts with an average tenure of 35 months, a high feature adoption rate of 83%, and an average of 47 support tickets. In their exit interviews, they stated they were leaving because of a lack of advanced API access and custom fields.
If the product team had designed a single, blanket solution to address their aggregate 4.2% churn rate, they would have failed. Simplifying the product would have alienated their high-value, long-term power users. Adding more advanced features would have overwhelmed their early-stage users even faster.
By segmenting our churned customers by tenure, plan tier, and usage patterns, we can deploy targeted retention playbooks for each profile. To learn more about setting up these tracking metrics, check out our resource on SaaS Customer Retention Metrics and read the analysis in You Are Losing Customers and You Do Not Actually Know Why. .
Turning Qualitative Insights into a Prioritized Action Plan
Once we have collected qualitative feedback and matched it with our quantitative data, we must avoid letting our exit transcripts sit in an unread folder. We need a systematic way to turn these insights into a prioritized product and customer success roadmap.
We recommend setting up a Root Cause Matrix on a monthly cadence. Group your exit interview findings into 8 to 12 top-level themes (e.g., Onboarding Drop-off, Missing Integrions, Competitor Pricing, System Instability).
To prioritize our engineering and customer success resources, we calculate the exact MRR at risk for each theme.
For instance, consider a real-world B2B SaaS company that redesigned its exit program. They discovered that 41% of their total churned MRR over a quarter was driven by a single issue: a missing Salesforce integration. Armed with this exact dollar figure, the product team prioritized building the integration. They shipped it in four weeks. In the following quarter, their overall churn rate dropped by 38%, saving hundreds of thousands of dollars in recurring revenue.
Even better, they emailed 89 of the customers who had previously churned citing that missing integration, letting them know it was now live. This simple, targeted outreach resulted in a 53% win-back rate, proving that exit interviews can actively fuel customer acquisition.
To calculate your own metrics and run scenario planning, use our interactive Churn Rate Calculator.
Frequently Asked Questions about MRR Churn and Exit Interviews
What is a good monthly MRR churn rate benchmark for B2B SaaS?
A "good" churn rate depends heavily on your customer segment (ARPA) and company stage (ARR):
- Early-Stage (<$300k ARR): The median monthly customer churn rate is around 6.5%. At this stage, teams are still finding product-market fit.
- Established (>$8M ARR): The median monthly churn rate drops to 3.1%, with best-in-class enterprise SaaS companies maintaining a Gross MRR churn rate of under 1% monthly.
- By Deal Size: Companies with an Average Revenue Per Account (ARPA) under $25 experience a median monthly churn of 6.1%, whereas high-touch enterprise accounts (ARPA >$1,000) see a median churn of just 1.8%.
How many exit interviews should we conduct each month?
At an early stage, we should try to interview every single paying customer who cancels. As we scale, we will hit diminishing returns.
The sweet spot for qualitative depth is between 5 and 20 interviews per major customer segment per month. Beyond 20 interviews, the same themes will repeat themselves (saturation point), and the marginal utility of conducting more live calls drops.
Can we automate exit interviews without losing qualitative depth?
Yes, but not with static forms. The modern standard is using interactive, conversational, or AI-moderated exit interfaces that mimic a live researcher. These conversational tools ask follow-up questions based on natural language inputs, achieving completion rates of 30% to 45% (compared to just 12% for traditional surveys) while capturing rich, unstructured text.
Conclusion
Building an exit interview program is not about documenting our failures; it is about uncovering the hidden roadmap to our next phase of growth. When we combine the deep, qualitative "why" of an mrr churn rate exit interview with our quantitative billing and product usage data, we gain a superpower. We stop guessing why customers leave and start predicting how to make them stay.
But doing this manually is incredibly painful. Connecting your billing system (to track gross and net MRR) with your CRM (to see customer tiers) and your product analytics (to track usage drops) usually requires complex SQL queries, engineering hours, and endless spreadsheets.
This is exactly why we built atSpark.
atSpark is an AI-powered analytics platform that unifies your billing, CRM, and subscription data into a single source of truth. Instead of waiting on engineering, your product, customer success, and finance teams can simply ask plain-English questions like:
- "Show me the average 90-day usage curve for accounts that churned last quarter."
- "What was the total MRR lost from customers who cited 'missing integrations' in their exit feedback?"
- "Create a chart comparing our monthly Gross MRR Churn vs Net MRR Churn for enterprise accounts."
You get instant, beautiful charts, tables, and actionable insights without writing a single line of SQL.
Ready to stop the leaks in your subscription revenue? Learn more about MRR metrics and see how atSpark can help you turn your customer data into a retention engine today.