
Analytics platforms for usage-based revenue optimization help SaaS teams turn consumption data into board-ready answers. They connect usage, billing, and customer records so finance, FP&A, and RevOps can explain revenue movement with confidence.
Analytics platforms for usage-based revenue optimization unify usage events, billing data, and CRM records into one model. That lets teams forecast variable revenue, spot expansion or churn risk early, and give the board a single trusted view instead of stitching together exports from Stripe, Chargebee, HubSpot, and Salesforce.
Key takeaways
- Usage-based revenue changes with consumption, so static spreadsheet forecasts break quickly.
- The best platforms connect billing, CRM, finance, and product usage data in one model.
- Cohorts, tiers, and risk signals matter more than chart volume.
- Board-ready reporting needs finance-grade accuracy, not just directional product data.
- Integration depth matters more than the number of features on the page.
Why do analytics platforms for usage-based revenue optimization matter?
Analytics platforms for usage-based revenue optimization matter because consumption-based pricing turns revenue into a moving target. That makes forecasting, variance analysis, and renewal planning harder than in a fixed-seat subscription model.
When usage drives billing, finance teams need to know which accounts are growing, which are slowing, and which may churn. A good platform makes those signals visible before close, so the team can act while there is still time.
Why spreadsheets fall short
Spreadsheets can summarize last month, but they do not keep up with daily usage changes across a growing customer base. They also make it easy for billing, product, and CRM numbers to drift apart.
That fragmentation creates a reconciliation problem. Usage may live in a metering tool, invoicing may live in Stripe or Chargebee, and account context may sit in Salesforce or HubSpot. Manual cleanup slows the close and delays decisions.
What should usage-based revenue optimization platforms do?
Usage-based revenue optimization platforms should connect usage, billing, and CRM data automatically, then turn that data into revenue insight. The goal is not another dashboard. The goal is a model that links consumption patterns to dollars and to accounts.
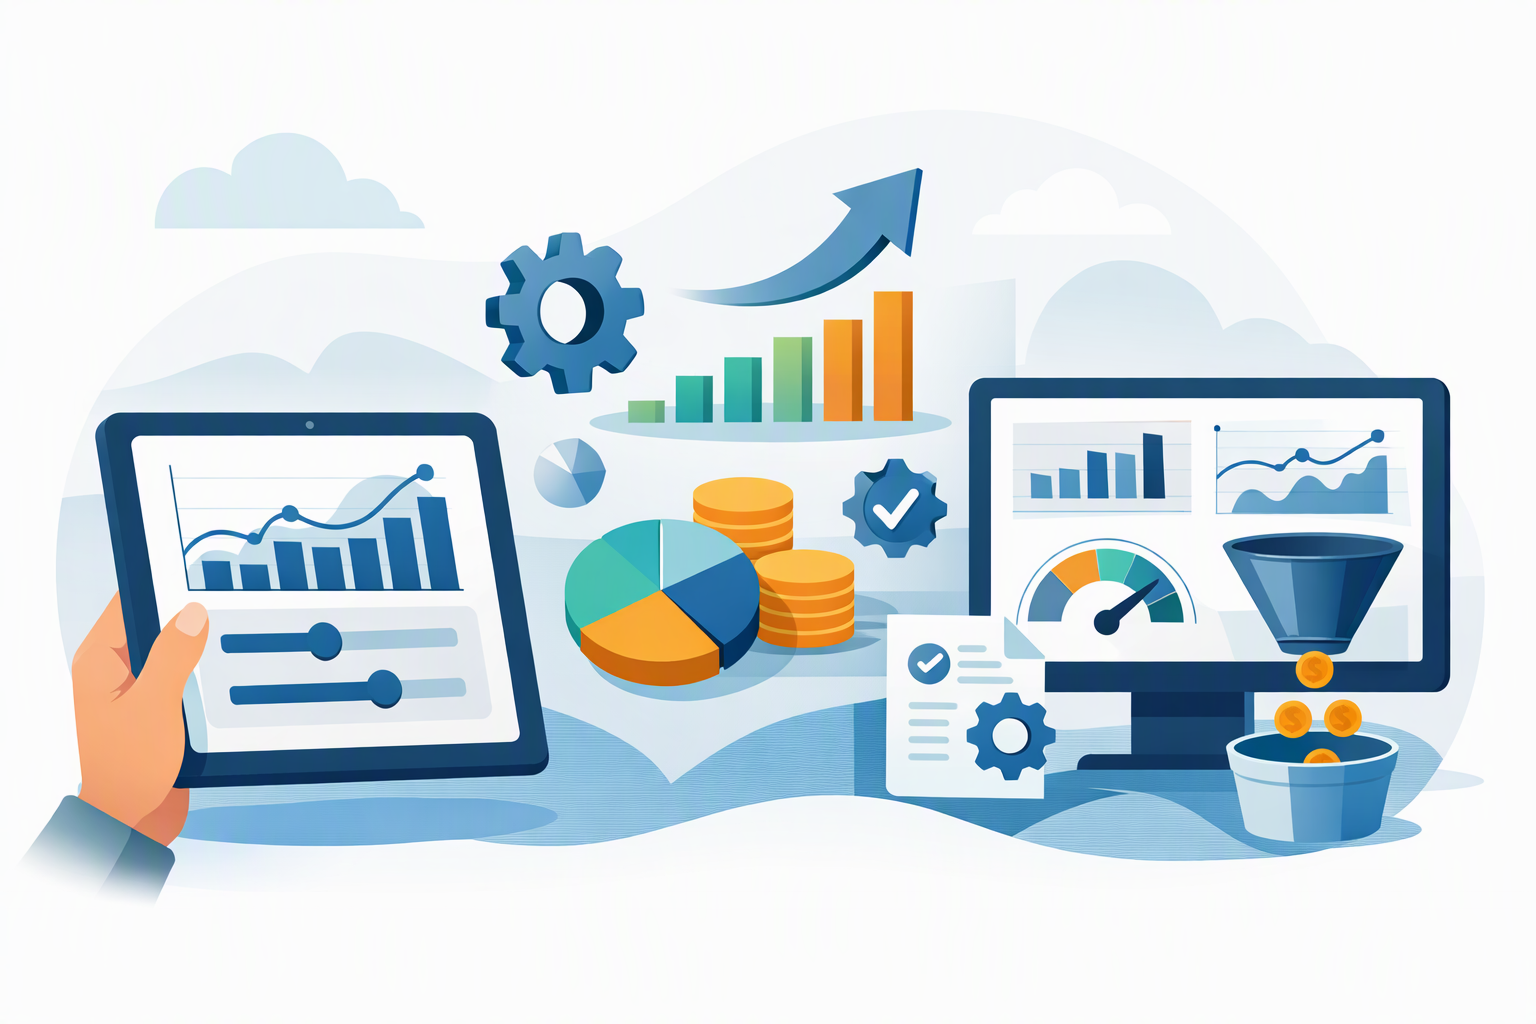
At minimum, a strong platform should do five things:
- Ingest usage and billing data automatically. The platform should pull from metering and billing systems instead of relying on CSV uploads.
- Track revenue by cohort, plan, and tier. This shows which customer groups create volatility.
- Forecast variable revenue. Forecasts should use historical usage patterns, not a flat growth assumption.
- Flag overage, underage, and churn risk. Teams should see risk before the invoice is sent.
- Reconcile with CRM records. Sales and customer success should see the same account-level story finance sees.
This is also where finance-grade reporting separates itself from product analytics. Product tools can show behavior, but revenue optimization requires the numbers to tie back to the books.
How is usage-based revenue different from MRR and ARR?
Usage-based revenue is variable, while MRR, or Monthly Recurring Revenue, and ARR, or Annual Recurring Revenue, assume a more stable baseline. That difference changes how you plan, report, and forecast.
Traditional subscription metrics work well when contract value is fixed. Usage-based revenue needs a range, because the same customer can generate very different revenue from one month to the next.
| Metric characteristic | Traditional MRR/ARR | Usage-based revenue |
|---|---|---|
| Predictability | High, because contract value is fixed | Variable, because consumption changes |
| Forecasting method | Growth rate on the existing base | Consumption trends plus seasonality |
| Churn signal | Cancellation or downgrade | Declining usage before cancellation |
| Expansion signal | Seat addition or upsell | Tier upgrades or overages |
| Reporting cadence | Monthly close is often enough | Near real-time tracking is better |
This shift also affects ARPU, or Average Revenue Per User. In usage-based models, ARPU needs to reflect variable consumption, not just a simple average of contracted seats. For a deeper look at that metric, see Mastering the Average Revenue Per User Calculation for Your Business and How ARPU Compares to CLV and Other Crucial Revenue Metrics.
How do you forecast usage-based revenue?
You forecast usage-based revenue by modeling customer consumption, then layering in contract floors, seasonality, and expansion patterns. The output should be a range, not a single number.
That approach is more reliable than applying one blended growth rate across the whole base. It recognizes that some accounts will accelerate, some will flatten, and some will shrink before they churn.
A practical forecasting workflow
- Segment customers by plan or usage tier so outliers do not distort the forecast.
- Review trailing 30-, 60-, and 90-day usage trends by cohort.
- Include minimum commitments and overage history to bound the forecast.
- Watch for declining usage as an early churn indicator.
- Compare forecasted revenue with actuals weekly, not just at month-end.
That same discipline shows up in pipeline forecasting too. If you want a broader framework for probability-based planning, see The Ultimate Guide to Weighted Pipeline Sales Forecasting and Analytics.
What integrations matter most for usage-based revenue optimization?
The most important integrations are your billing system, CRM, finance system, and usage source. If any of those are disconnected, the revenue picture stays incomplete.

Usage-based revenue optimization depends on data reconciliation. That means the platform has to line up what customers used, what they were billed, what finance recognized, and what sales and CS know about the account.
- Billing and metering such as Stripe or Chargebee, which capture invoicing and collection.
- CRM such as Salesforce or HubSpot, which adds account ownership, renewal timing, and pipeline context.
- Finance systems such as QuickBooks or Xero, which keep reporting aligned with the books.
- Product usage data, which shows the behavior that often leads revenue up or down.
This kind of unification is a common theme in What is AI revenue analytics? A founder's guide for 2026, where automation reduces the manual work around close and reporting.
How do usage-based revenue optimization platforms help expand accounts?
Usage-based revenue optimization platforms help expand accounts by showing which customers are approaching their usage ceiling. That gives RevOps and customer success a chance to act before a hard cap creates friction or before an overage becomes a surprise.
Usage trends can signal both expansion and churn. A rising curve may indicate an account is ready for a tier upgrade, while a falling curve may mean the customer is disengaging. The platform helps teams respond while there is still time.
Pairing usage data with broader customer behavior makes the signal stronger. For more on that connection, see Beyond the Click: Why Product Analytics Tools and Unified Customer Profiles are BFFs.
What does board-ready usage revenue reporting look like?
Board-ready reporting ties back to the financials, explains variance clearly, and answers questions without extra cleanup. If revenue moved, the report should show why it moved and which accounts drove the change.
That means the dashboard must do more than display trend lines. It should reconcile to the books and present the narrative in plain language, so CFOs and founders can defend the number confidently.
For a broader view of finance-grade presentation, the revenue dashboard guide shows what strong reporting looks like end to end.
How do you choose the right analytics platform for usage-based revenue optimization?
Choose the platform that gives you trusted answers fastest, not the one with the most chart types. The right tool should fit your billing stack, your CRM, and your close process.
Use this checklist to compare options:
- Can it ingest usage and billing data automatically?
- Does it track cohorts, plans, and tiers?
- Can it forecast variable revenue with historical patterns?
- Does it highlight overage, underage, and churn risk?
- Will it reconcile with the CRM and finance system your team already uses?
If the answer is yes to most of those questions, you are closer to a system finance can trust. If not, you will keep spending time on manual reconciliation instead of planning.
What is the bottom line on usage-based revenue optimization?
Usage-based pricing can create stronger growth, but only if your reporting can keep up with consumption changes. Teams win when they can see usage clearly, connect it to revenue fast, and share one number across finance, RevOps, and the board.
If you are still piecing together usage and revenue data by hand, it may be time for a unified view. See how atSpark brings your revenue stack together so you can get board-ready answers in minutes, not days.
Frequently Asked Questions
What are analytics platforms for usage-based revenue optimization?
Analytics platforms for usage-based revenue optimization are tools that connect usage, billing, CRM, and finance data so SaaS teams can understand variable revenue. They help finance, FP&A, and RevOps forecast consumption-based revenue, spot expansion or churn risk, and report a single trusted number to leadership.
Why are spreadsheets not enough for usage-based revenue?
Spreadsheets are not enough because usage changes too quickly and the data usually lives in separate systems. Billing, metering, and CRM records can drift apart, which creates reconciliation work and slows the close. A dedicated platform keeps the data model current and tied to revenue.
What integrations matter most for usage-based revenue optimization?
The most important integrations are billing or metering, CRM, finance, and product usage data. Those sources let the platform line up what customers used, what they were billed, what finance recognized, and what sales or customer success knows about the account.
How do these platforms help with forecasting?
They help with forecasting by modeling actual consumption patterns instead of using one flat growth rate. Good forecasting usually looks at cohorts, usage tiers, seasonality, minimum commitments, and recent trends. That gives teams a range they can use for planning and board reporting.
What should I look for when choosing a platform?
Look for automatic data ingestion, cohort and tier tracking, variable revenue forecasting, risk signals, and reconciliation with your CRM and finance systems. The best choice is the one that gives finance-grade answers quickly and fits your current close process.