Why Most Teams Are Flying Blind Without a Product Analytics Tool
A product analytics tool is software that tracks how users interact with your product - what they click, where they drop off, which features they use, and whether they come back. It is a practical application of behavioral analytics, focused specifically on understanding actions users take inside a digital product.
If you're a Finance or RevOps lead at a SaaS company, here's what you need to know fast:
| Question | Quick Answer |
|---|---|
| What does it do? | Tracks user behavior inside your product to drive decisions |
| Who uses it? | Product, growth, marketing, engineering, and finance teams |
| Common platform types in 2026 | Event-based, user-based, warehouse-native, open-source, and qualitative analytics platforms |
| Average payback period | 10 months |
| Typical cost | $0-$500/month for most teams; $10k-$100k+/year at enterprise scale |
| Biggest risk | Buying a tool your team never fully uses |
That last row matters more than most people admit.
Across the industry, the average user adoption rate for product analytics tools is just 57%. Nearly half of the people who are supposed to be using these platforms aren't. That's not a data problem - that's a fit problem.
The right tool matches how your team actually works. The wrong one collects dust while your team reconciles spreadsheets and waits on data requests.
And the cost of getting it wrong isn't just the subscription fee. It's the decisions you didn't make because the data wasn't accessible, wasn't trusted, or wasn't connected to anything that mattered - like revenue, retention risk, or churn signals sitting in your CRM or billing system.
This guide breaks down what product analytics tools actually do, how to compare them, and - critically - why they work best when they're connected to unified customer profiles rather than living as isolated click-tracking silos.
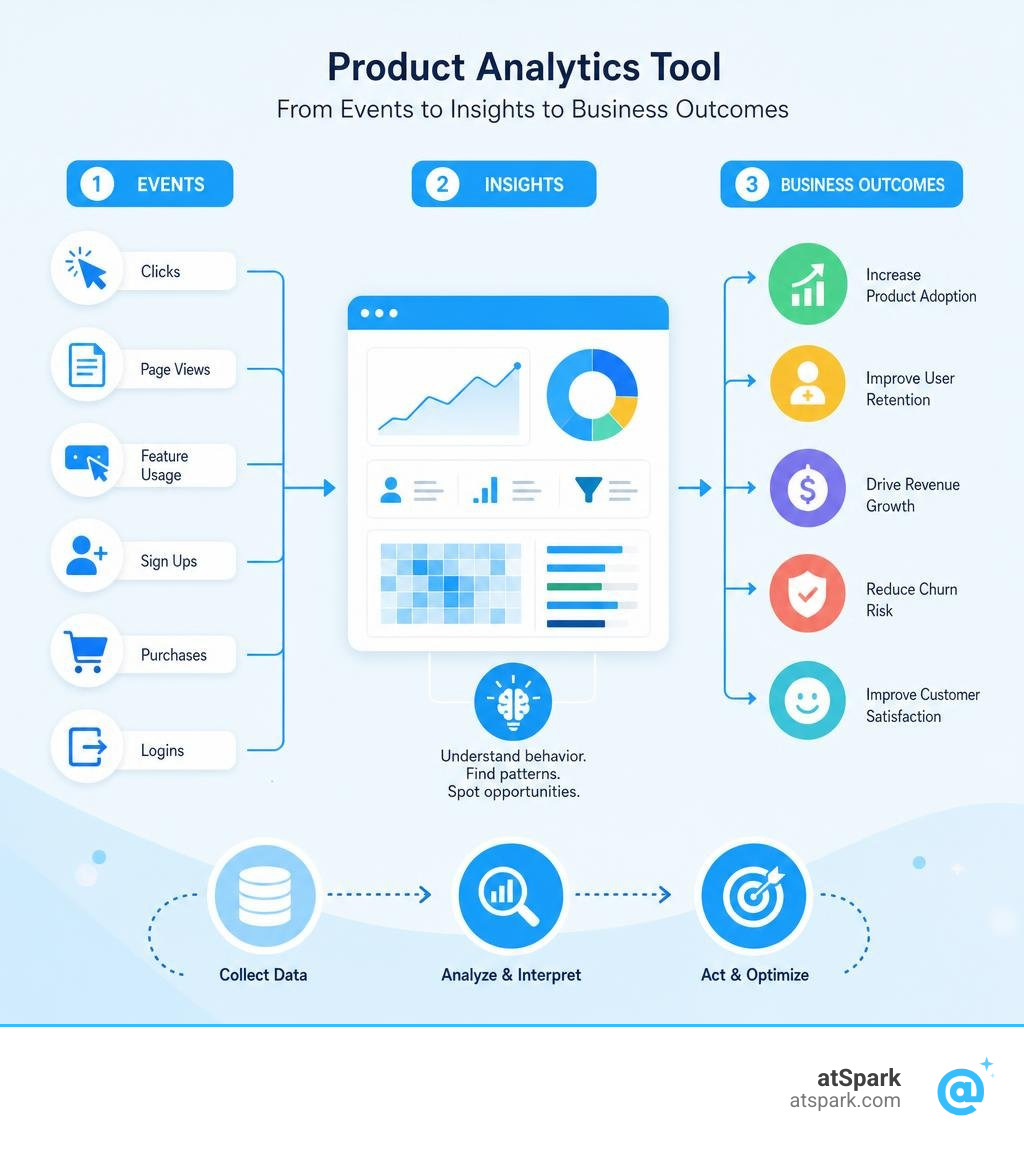
What is a Product Analytics Tool and Why Does It Need Unified Customer Profiles?
To truly understand user behavior, we have to look past the surface. A standard product analytics tool is fantastic at telling you what happened inside your application. It can tell you that User 4829 clicked the "Export PDF" button three times yesterday.
But without context, that data point is a lonely island.
Why did they export that PDF? Are they a highly active enterprise customer who is about to renew, or are they a frustrated trial user trying to salvage their data before canceling? To answer that, you have to bridge the gap between product usage data and business data. This is where the concept of unified customer profiles comes into play.
When you break down data silos, you connect product events directly to billing data, subscription statuses, and CRM records. Suddenly, a simple click isn't just a click anymore; it's a milestone in a customer's lifetime value.
For example, tracking SaaS Product Usage Metrics is incredibly powerful, but it becomes game-changing when you can tie those metrics directly to revenue health. If you want to dive deeper into how this integration impacts your bottom line, check out our guide on What is AI Revenue Analytics? to see how combining financial and behavioral data unlocks predictive growth.
Without unified customer profiles, your product team lives in one tool, your sales team lives in another, and your finance team sits in spreadsheet purgatory trying to figure out which product features actually drive expansion revenue. By uniting these worlds, you turn raw, anonymous clicks into actionable, revenue-aligned insights.
Key Features to Look For in a Modern Product Analytics Tool
Evaluating a product analytics tool in 2026 requires looking beyond basic pageviews. Modern platforms are packed with sophisticated features designed to help you understand the entire user journey.

When shopping around, make sure your shortlist includes these foundational pillars:
- Robust Event Tracking: The ability to map specific user actions (like sign-ups, feature usage, and checkout completions) to understand how people navigate your digital workspace.
- Cohort Analysis: Grouping users based on shared characteristics or behaviors over a specific timeframe. For example, comparing the retention of users who completed onboarding in their first 24 hours versus those who didn't.
- Retention Reports: Visualizing how often users return to your app over days, weeks, or months. This is the ultimate health check for product-market fit.
- Funnel Visualization: Mapping out step-by-step user journeys to spot exactly where friction occurs and where users drop off before completing a key action.
Understanding these features is critical because they directly feed into your overall SaaS KPI Dashboard. When you can measure exactly how product updates influence user behavior, you can optimize your SaaS Customer Retention Metrics with surgical precision.
Quantitative vs. Qualitative Features in a Product Analytics Tool
Numbers tell you what is happening, but qualitative features tell you why.
While quantitative data might show that 40% of users drop off at your billing page, qualitative features like session recordings and heatmaps let you watch the exact moments those users got stuck. You can see their mouse hovering in confusion, spot "rage clicks" on an unclickable image, or identify "dead clicks" where a button failed to load.
By combining quantitative funnels with qualitative session replays, you close the gap between numbers and human reality. This holistic view is vital for tracking SaaS Customer Success Metrics, as it allows your customer success and support teams to proactively reach out to struggling accounts before they decide to churn.
Automatic Event Capture vs. Manual Tracking
One of the biggest architectural decisions you will make is choosing between automatic event capture (autocapture) and manual event tracking:
- Autocapture: Some platforms automatically record every single click, swipe, scroll, and form submission from day one. You don't have to write code every time you want to track a new button. The massive benefit here is retroactive data - if you decide six months from now that you want to analyze a feature you launched yesterday, the data is already there waiting for you.
- Manual Tracking: Other platforms require developers to manually write code (instrumentation) for every event they want to track. While this takes more upfront engineering effort, it yields highly structured, clean, and intentional data.
The trade-off comes down to data governance. Autocapture gives you infinite data but can quickly turn into a messy, overwhelming swamp if not carefully managed. Manual tracking keeps your data pristine but can create an engineering bottleneck every time you ship a new feature. Whichever path you choose, keeping your data clean is essential for maintaining accurate SaaS Performance Metrics.
Comparing Product Analytics Methodologies and Costs in 2026
The product analytics landscape in 2026 is highly diverse, with pricing and deployment models tailored to different organizational structures. Let's look at how the main methodologies stack up:
| Methodology | Billing Basis | Best For | Common Examples | Pros | Cons |
|---|---|---|---|---|---|
| Event-Based | Raw volume of events (clicks, loads) | High-value, lower-volume B2B apps | Platforms that bill by action volume | Highly precise, predictable for low event volumes | Costs can scale exponentially as your user base grows |
| User-Based (MTU) | Monthly Tracked Users | B2C apps or high-frequency usage apps | Platforms that bill by active user count | Great for high event volumes per user | Gating historical data on lower tiers is common |
| Warehouse-Native | Zero per-event markup (runs on your cloud) | Privacy-conscious teams with modern data stacks | Platforms built on your own data warehouse | Complete data ownership, no third-party storage fees | Requires a data warehouse (Snowflake, BigQuery) |
| Open-Source | Self-hosted or modular cloud | Technical teams, developers | Self-hosted product analytics stacks | Ultimate flexibility, highly cost-effective | Requires engineering resources to self-host and maintain |
Choosing a Product Analytics Tool for Technical vs. Non-Technical Teams
A common trap is buying a highly technical tool for a team that doesn't have the engineering resources to support it.
If your team is highly technical, open-source or warehouse-native platforms can be incredibly powerful. They give developers strong control over the data pipeline, allow for complex SQL querying, and integrate seamlessly into developer environments.
However, for non-technical product managers, marketers, and business leaders, these tools often lead to the dreaded "SQL bottleneck." Every time a marketing manager wants to know if a campaign drove sign-ups, they have to file a ticket and wait days for a data analyst to write a query.
To avoid this, look for platforms that prioritize intuitive, visual builders and self-serve exploration. If you want to eliminate the engineering middleman entirely, consider adopting systems that allow you to Ask Your Data Anything Without SQL, giving everyone on your team instant access to insights.
Typical Cost of Product Analytics Platforms at Scale
Pricing for a product analytics tool can scale dramatically depending on your size and event volume.
- Startup Scale: If you are a growing startup, you can often find useful free or low-cost options under $500 per month, especially if your event volume is still modest and your reporting needs are focused. Some platforms offer generous free tiers, while qualitative analytics options may include free session recording or heatmap capabilities.
- Enterprise Scale: As your event volume scales into tens of millions per month, pricing shifts to custom enterprise contracts. It is not uncommon for mid-market and enterprise companies to pay anywhere from $10,000 to over $100,000 per year.
Because costs can scale exponentially, it is vital to tie your analytics investment directly to SaaS Growth Metrics. Make sure the platform you choose doesn't charge you "for every little mouse click" to the point where your analytics bill outpaces your actual customer acquisition revenue.
Frequently Asked Questions about Product Analytics
What is the difference between web analytics and a product analytics tool?
Traditional web analytics is designed to track anonymous traffic, pageviews, referral sources, and marketing campaign performance. It answers questions like, "Where did our visitors come from?" and "Which blog post gets the most traffic?"
A product analytics tool, on the other hand, is built to track authenticated, logged-in user behavior inside an application. It focuses on user-level actions, conversion funnels, feature adoption, and retention cohorts. It answers deep product questions like, "Do users who complete onboarding in under five minutes have higher long-term retention?" Tracking these behavioral nuances is essential for calculating Important SaaS Metrics like customer lifetime value and product-led growth velocity.
How do billing models differ across product analytics platforms?
Billing models generally fall into three categories:
- Event-Based Billing: You pay for the total number of events (actions) sent to the platform. 10 users triggering 1,000 events each costs the same as 1,000 users triggering 10 events each.
- Monthly Tracked User (MTU) Billing: You pay based on the unique number of active users who log in during a 30-day window, regardless of how many actions they perform.
- Modular Pricing: Platforms bill you independently for different features (e.g., paying separately for product analytics, session replays, and feature flags), allowing you to pay only for what you actually use.
Understanding these models is key to aligning your software spend with your overall SaaS Business Metrics.
Why do product analytics implementations fail?
Most product analytics implementations fail due to a lack of clear ownership and poor data governance. When teams jump into a tool without a structured tracking plan, they end up tracking either too little (leaving massive data gaps) or too much (creating a messy, confusing event taxonomy).
When event names are inconsistent (e.g., tracking Sign_Up, signup_clicked, and user-register all for the same action), the data becomes untrustworthy. Users lose confidence, adoption drops below that average 57% mark, and the tool is abandoned. To set your team up for success from day one, make sure you ask the right questions early on - check out our guide on 5 Questions AI Revenue Analyst Day One to build a solid foundation.
Conclusion

Choosing the right product analytics tool in 2026 isn't about finding the platform with the most complex features or the flashiest sales demo. It's about finding the tool that your team will actually use, with a billing model that won't punish your growth, and an architecture that connects your behavioral data to your financial reality.
But even the best product analytics tool is limited if it remains a silo.
At atSpark, we believe that true business intelligence happens when you shatter the walls between product usage, marketing campaigns, and subscription revenue. Our AI-powered conversational analytics platform unifies your billing, CRM, and subscription data, allowing anyone on your team to ask plain-English questions and get instant, beautiful charts, tables, and insights. No SQL, no engineering bottlenecks, and no complicated setups.
If you are ready to stop guessing and start knowing, dive into the core SaaS Metrics to Track and see how unifying your customer profiles can unlock predictable, scalable growth for your organization today.