The Hidden Cost of Switching Tabs to Find Your Data
Embedded business intelligence is the practice of integrating analytics — dashboards, reports, and data visualizations — directly inside the applications your team already uses, instead of sending users to a separate BI tool.
Here's the quick version:
| Question | Answer |
|---|---|
| What is it? | Analytics built into your existing software, not a standalone tool |
| Who uses it? | SaaS companies, finance teams, RevOps leads, product builders |
| Why does it matter? | Users get insights without leaving their workflow |
| Key benefit | Higher adoption, faster decisions, less context-switching |
| Common formats | Embedded dashboards, interactive reports, self-service analytics |
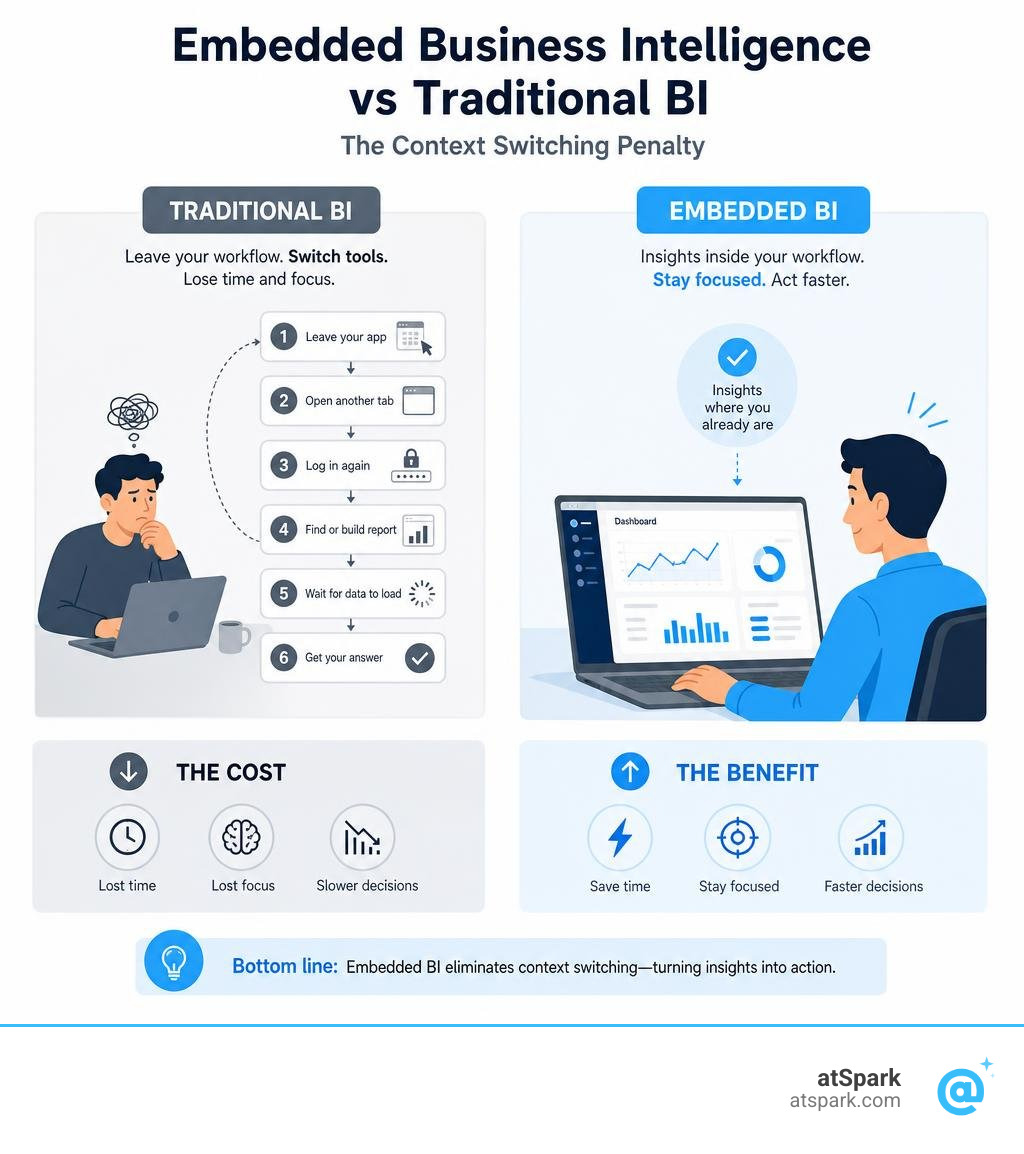
Think about the last time you needed a quick answer on revenue or retention. Did you get it instantly — inside the tool you were already in? Or did you open another tab, log into a separate platform, wait for a report to load, and maybe get what you needed?
That's the problem most Finance and RevOps teams live with every day.
The average knowledge worker already juggles five or more tools. Every time someone has to leave their CRM, ERP, or SaaS platform to check a metric in a standalone BI tool, they pay what researchers call a context-switching penalty — lost focus, lost time, and often, a decision that gets made without the data at all.
The result? Low adoption of expensive BI tools. Teams that rely on spreadsheets instead. And a data team buried in one-off report requests.
Embedded BI solves this by meeting users where they already are.
The embedded analytics market reflects just how urgent this problem has become — valued at nearly $55 billion in 2024 and projected to exceed $149 billion by 2031, according to Verified Market Research. That's not a niche trend. That's a fundamental shift in how software is built.
This guide breaks down what embedded BI actually means, why it outperforms traditional analytics tools, what to look for when choosing a platform, and how AI is reshaping the entire space.
What is Embedded Business Intelligence?
At its core, embedded business intelligence (also known as embedded analytics) is the integration of analytical capabilities directly into existing business applications, portals, or public websites. Instead of forcing users to export data to a CSV file or log into a completely separate dashboard tool, embedded BI brings the charts, tables, and insights directly to the user's active workspace.
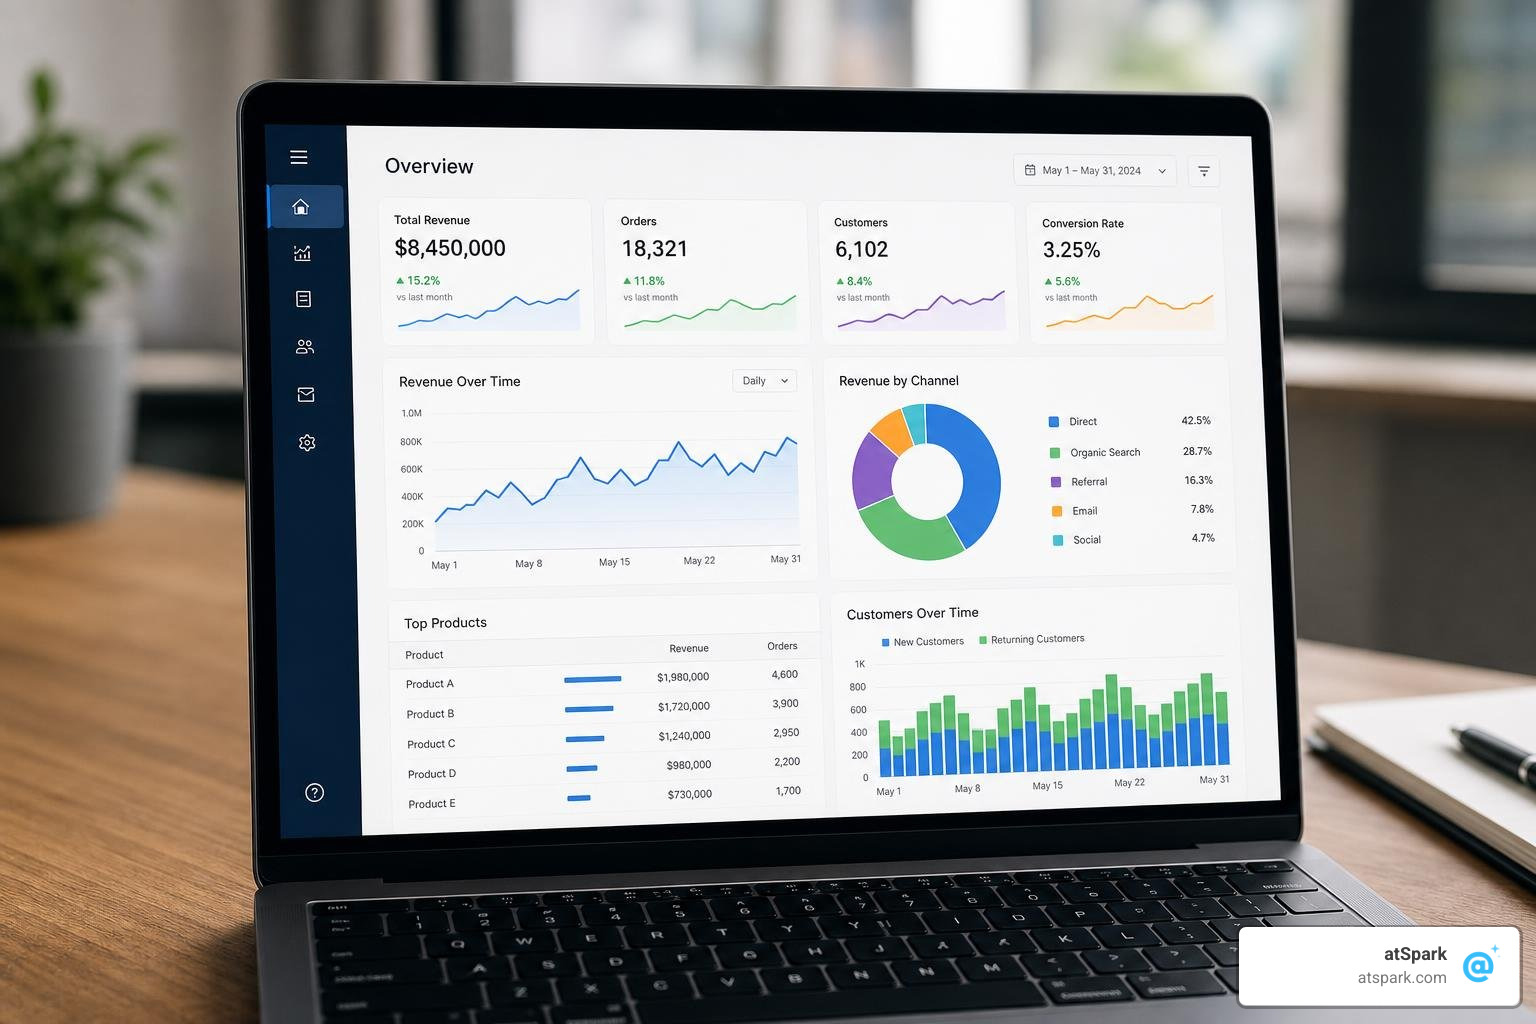
When done right, embedded BI feels entirely native. The end-user shouldn't even realize they are interacting with a separate analytics engine. The visual elements match the host application's design system, the security permissions align with the main login, and the data updates in real-time. This creates a seamless, cohesive user experience that keeps users focused on taking action rather than managing data pipelines.
Embedded Business Intelligence vs. Traditional BI
The difference between traditional BI and embedded BI comes down to where the data lives relative to where the work happens.
Traditional BI tools are built for internal data analysts. They exist in a separate environment, require specialized logins, and often demand technical expertise to run queries. In this traditional setup, a business user who wants to analyze customer behavior or financial trends must leave their primary application, open the BI tool, locate the correct dashboard, and manually filter the view. This "app-switching" breaks cognitive momentum.
Embedded BI, on the other hand, prioritizes workflow continuity. It delivers contextual insights directly inside the user's daily software. For example, instead of leaving an ERP to check inventory trends, a warehouse manager can view live predictive stock charts directly on their main dashboard.
This approach breaks down data silos. By centralizing analytics within core systems, organizations gain immediate visibility without administrative overhead. This transition is highly evident in legacy software modernization, such as ERP Embedded Analytics | Business Intelligence | SYSPRO - US, where bringing analytical tools directly into core enterprise resource planning software has eliminated the need to jump between multiple systems just to understand daily operations.
Common Use Cases Across Industries
The applications of embedded BI span almost every operational department and industry vertical:
- SaaS Applications: Software vendors integrate interactive dashboards to show users the direct value of their platform. For instance, a marketing automation tool might embed a SaaS KPI Dashboard to show customers their campaign ROI, conversion rates, and list growth without requiring them to build their own reporting pipelines.
- Internal Operations Tools: Large enterprises embed analytics inside their custom CRMs or HR portals. Sales teams can view real-time commission tracking and pipeline health alongside their active leads, while HR managers can analyze retention metrics directly within their employee directory.
- Customer-Facing Portals: Financial institutions, logistics firms, and healthcare providers use secure portals to give clients self-service access to their data. A logistics client can log in and immediately see interactive maps tracking active shipments, delivery performance, and historical spend.
The Core Benefits of Embedded Analytics for SaaS
For SaaS product builders and enterprise teams alike, embedding analytics is no longer a luxury—it is a core product requirement.
| Feature | Traditional BI | Embedded BI |
|---|---|---|
| User Adoption | Low (typically ~20-30%) | High (often 70% or more) |
| Workflow Friction | High (constant tab-switching) | Zero (insights are in-context) |
| Data Freshness | Often delayed (ETL schedules) | Real-time / Live queries |
| Implementation | Built for data teams | Built for end-users |
| Monetization | Cost center | Profit center (premium add-ons) |
By integrating dashboards directly into your product, you transform raw data into an active driver of customer value and product growth.
Improving User Adoption and Engagement
The biggest failure of traditional BI is low user adoption. When analytics are difficult to access, people simply stop using them.
By contrast, embedded BI dramatically increases user engagement and session time. When users can filter, drill down, and explore data directly within your application, they spend more time interacting with your software. It turns your product into their primary "command center." Tracking SaaS Product Usage Metrics reveals a clear correlation: products with built-in, highly interactive analytics see significantly higher daily active user (DAU) rates and longer average session lengths compared to platforms that offer static or non-existent reporting.
Driving Revenue and Customer Retention
From a business perspective, embedded BI is a powerful lever for both expansion revenue and customer retention.
- Monetization: Many SaaS companies package advanced reporting and self-service dashboard builders as premium add-on tiers. This creates a highly profitable new revenue stream, with research showing that offering in-platform BI can drive up to an 18% increase in overall revenue.
- Retention: When customers rely on your embedded dashboards to run their weekly meetings or justify their department's budget, your software becomes indispensable. This habitual usage directly improves your SaaS Customer Retention Metrics, driving down churn and boosting net revenue retention (NRR).
- Growth: Delivering immediate, visual proof of value makes your product easier to sell and renew, directly impacting your broader SaaS Growth Metrics.
Build vs. Buy: Navigating the Embedded Analytics Dilemma
When a product team decides to offer embedded analytics, they inevitably face a critical decision: should they build the reporting engine from scratch or buy an existing embedded BI platform?

While building in-house feels like it offers maximum control, it almost always consumes more engineering resources, money, and time than teams anticipate.
The Hidden Costs of Building In-House
Engineering teams often underestimate the long-term maintenance overhead of custom-built analytics. What starts as a simple project to display a few bar charts quickly spirals into a massive infrastructure burden.
To build a secure, competitive analytics experience, your team must build and maintain:
- Row-Level Security (RLS): Ensuring that Customer A never sees Customer B's data (~$45,000 estimated development cost).
- Infrastructure and Caching: Managing database queries so that high-volume dashboards don't crash your primary transactional database (~$30,000).
- Visualization and UI: Building interactive chart components that are responsive, accessible, and beautiful (~$20,000).
This ongoing maintenance can easily divert two to three full-time engineers permanently, costing upwards of $150,000 per year just to keep the lights on. This is a massive opportunity cost that delays your core product roadmap. Instead of building unique features that differentiate your product, your engineers are stuck debugging charting libraries and optimizing SQL queries to keep your SaaS Performance Metrics stable. For a costed, side-by-side version of this decision, see our breakdown of how to share Power BI dashboards with external customers.
Key Factors to Consider When Choosing an Embedded Business Intelligence Tool
If you choose to buy a platform to accelerate your time-to-market, look for these essential capabilities:
- White-Labeling: The platform must allow you to fully customize the look and feel. Fonts, colors, chart styles, and layouts should match your brand exactly so the analytics feel fully built-in.
- Multi-Tenancy and Data Isolation: The tool must natively support secure multi-tenant architectures, ensuring strict data boundaries between different customers.
- API-First Design: Modern embedded BI tools should offer robust SDKs and web components rather than relying solely on rigid, non-performant iframes.
- Scalability & Performance: The engine must handle large, concurrent datasets efficiently without lagging or timing out.
- Enterprise-Grade Security: Ensure the vendor complies with strict standards like SOC 2 Type II, GDPR, and HIPAA. Robust Security protocols, such as server-side signed JSON Web Tokens (JWTs), are critical to prevent unauthorized data access at the query level.
The Next Frontier: AI and Conversational Analytics
As we navigate through 2026, the embedded BI landscape is undergoing a massive shift. Traditional static dashboards and rigid "drag-and-drop" report builders are no longer enough. The modern user expects to interact with data dynamically.
The integration of Generative AI (GenBI) and Natural Language Processing (NLP) is completely changing how users explore data inside software.
How AI is Changing the Analytics Landscape
Instead of navigating complex filter menus or waiting for a data analyst to build a custom view, users can now query their data using plain English.
Through conversational analytics, an executive can simply type: "Show me our monthly recurring revenue by region for the last two quarters as a bar chart." The underlying AI engine safely translates this natural language query into precise SQL, fetches the data through a governed semantic layer, and renders a beautiful, interactive chart instantly.
This technology democratizes data access. It removes the technical barrier of SQL, allowing non-technical business leaders, customer success managers, and operations teams to get answers in seconds. This shift is particularly impactful in revenue operations, where tools like What is AI Revenue Analytics? are helping teams identify pipeline leakage and forecast growth automatically.
By allowing users to Ask Your Data Anything Without SQL, software platforms can eliminate up to 90% of ad-hoc reporting support tickets, freeing up engineering and customer success teams to focus on strategic growth.
Frequently Asked Questions about Embedded BI
What is the typical ROI timeline for embedded BI?
Most organizations see a return on investment within the first three to six months. By choosing a pre-built embedded BI platform over building in-house, companies save an average of six months of engineering time and over $300,000 in upfront development costs. Once live, the immediate reduction in manual reporting support tickets combined with the potential for expansion revenue (charging for premium analytics tiers) quickly offsets the platform licensing costs.
How does multi-tenant security work in embedded analytics?
Multi-tenant security ensures that users only see the data they are authorized to view. Modern embedded BI platforms handle this through a combination of server-side signed JSON Web Tokens (JWTs) and Row-Level Security (RLS). When a user logs into your application, your server generates a secure token containing their tenant ID and role permissions. The embedded BI engine reads this token and automatically applies strict data filters at query time, ensuring complete data isolation at the database level.
Is embedded BI only useful for SaaS companies?
No. While SaaS platforms heavily leverage embedded BI to monetize data and improve user retention, it is equally valuable for non-SaaS enterprises. Internal business portals, supply chain management systems, healthcare operations, and financial portals all use embedded analytics to put real-time operational data directly into the hands of employees, partners, and clients to speed up daily decision-making.
Conclusion
The era of forcing users to toggle between multiple applications just to understand their numbers is officially over. Embedded business intelligence has transformed analytics from a separate, frustrating destination into an active, native helper that lives directly inside daily workflows.
At atSpark, we are leading this transition. We provide an AI-powered analytics platform designed specifically for SaaS companies. By unifying your billing, CRM, and subscription data into a single, governed semantic layer, we allow your teams and your users to ask plain-English questions and get instant, beautifully rendered charts and tables without writing a single line of SQL.
Stop letting context-switching drain your team's productivity and your customers' trust. Ready to deliver a seamless, AI-driven data experience? Explore the atSpark AI Analytics Platform today and see how easy conversational analytics can be.