Why Your Weighted Pipeline Sales Conversion Number Is the Only Pipeline Metric That Matters
Improving weighted pipeline sales conversion starts with one uncomfortable truth: the total pipeline value your CRM shows you is not a forecast. It's a wish list.
Here's how to turn your weighted pipeline into real revenue, fast:
- Assign data-driven probabilities to each pipeline stage based on your actual historical win rates — not CRM defaults.
- Calculate your weighted pipeline value by multiplying each deal's value by its stage probability, then summing the results.
- Compare weighted coverage to quota — most B2B SaaS teams need 3–4x weighted coverage to hit their number.
- Remove stale deals that inflate your pipeline without realistic closing potential.
- Recalibrate stage probabilities quarterly using closed-won and closed-lost data from prior periods.
- Separate deal types — new business, expansion, and renewal pipelines each need their own probability benchmarks.
Think about this scenario: your VP of Sales announces $4.2 million in pipeline for the quarter. You only need $1.2 million. Everything looks fine. Then, three weeks before close, you've only booked $600K — and half the "sure things" have pushed to next quarter.
This happens constantly in B2B SaaS. According to Gartner, 93% of sales leaders miss their year-end forecast by more than 10%. The average company misses by 20–25%. And the core reason is almost always the same: leaders are running decisions off raw, unweighted pipeline numbers that treat a day-one discovery call the same as a deal sitting in final negotiation.
For a Finance or RevOps lead trying to give the board an honest revenue picture — without waiting on a data pull or reconciling three spreadsheets — this is a critical problem. A properly built weighted pipeline model gives you a probability-adjusted view of expected revenue, so you can spot risk early, prioritize the right deals, and stop being surprised at quarter close.
This guide walks you through exactly how to build it, calibrate it, and use it to drive real conversions.
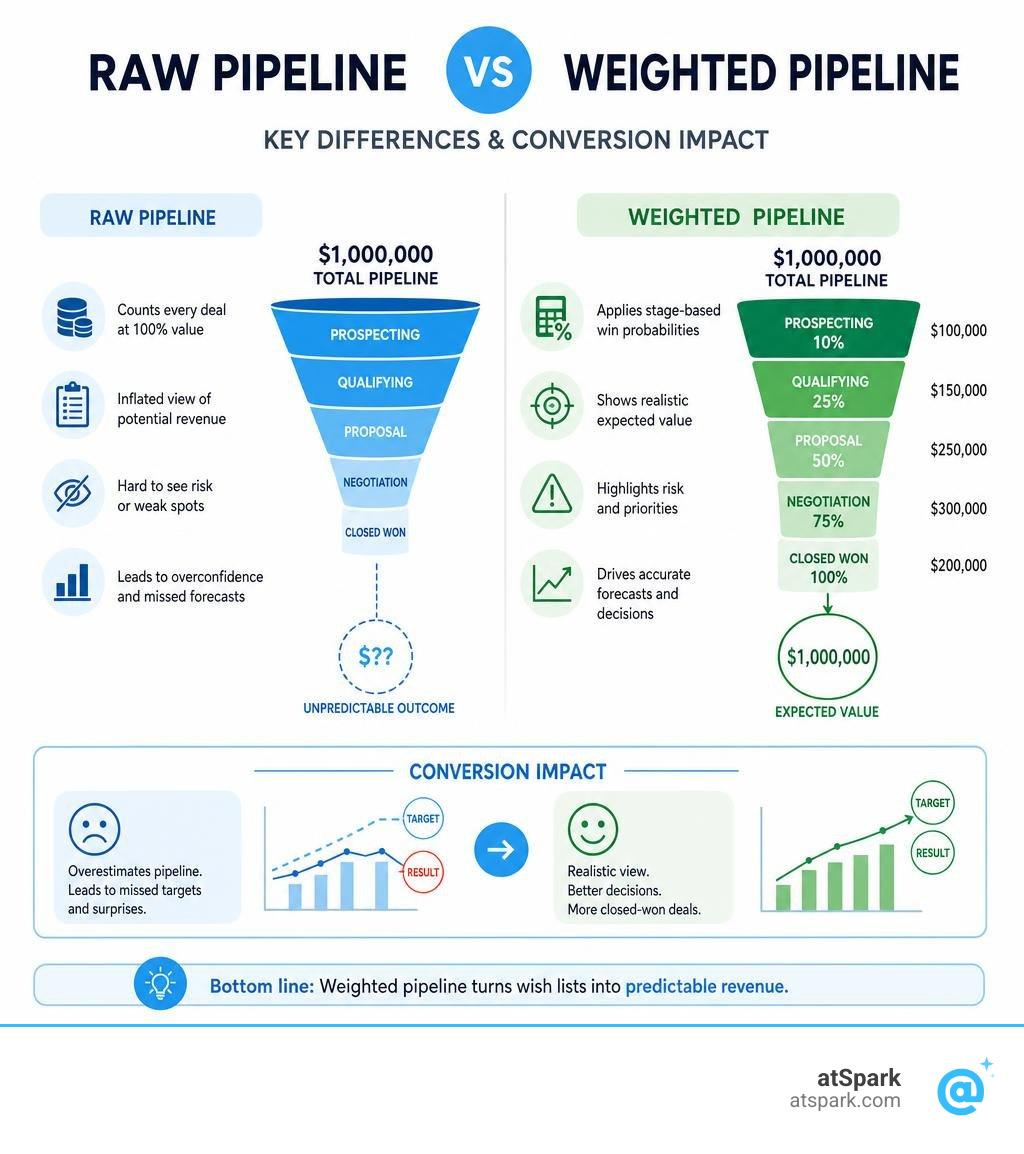
Demystifying the Weighted Pipeline Sales Conversion Model
To understand how to drive a better weighted pipeline sales conversion rate, we first need to establish what a weighted pipeline actually is.
At its core, a weighted pipeline is a sales forecasting methodology that assigns a specific probability of closing to each deal based on its current stage in the sales process. Instead of assuming every open deal will close at 100% value, we adjust the potential revenue down to reflect its actual likelihood of success.
You can learn more about the core terminology in our Weighted Pipeline Glossary and Sales Pipeline Glossary.
To make this model work, we look at each deal's progress and assign a "probability of closing" (expressed as a percentage) to each stage. For example, a deal in the early discovery stage might only have a 10% chance of closing, while a deal in final contract review might have a 90% probability. For a deep dive into the fundamentals, check out this guide on What Is Weighted Pipeline and How to Use It .
How Weighted Pipeline Sales Conversion Differs from Unweighted Pipelines
An unweighted pipeline takes every deal in your CRM at face value. If you have ten deals worth $100,000 each, your unweighted pipeline is $1,000,000.
While that $1M looks great on a dashboard, it represents a highly optimistic, unrealistic scenario. It assumes a 100% win rate across your entire Sales Funnel Glossary.
Relying on unweighted numbers creates what we call "phantom pipeline"—deals that are stalled, cold, or highly unlikely to close, but are still counted at full value. A weighted pipeline strips away this illusion. By multiplying each deal's value by its stage-based probability, we convert raw, hopeful volume into a realistic, data-backed forecast.
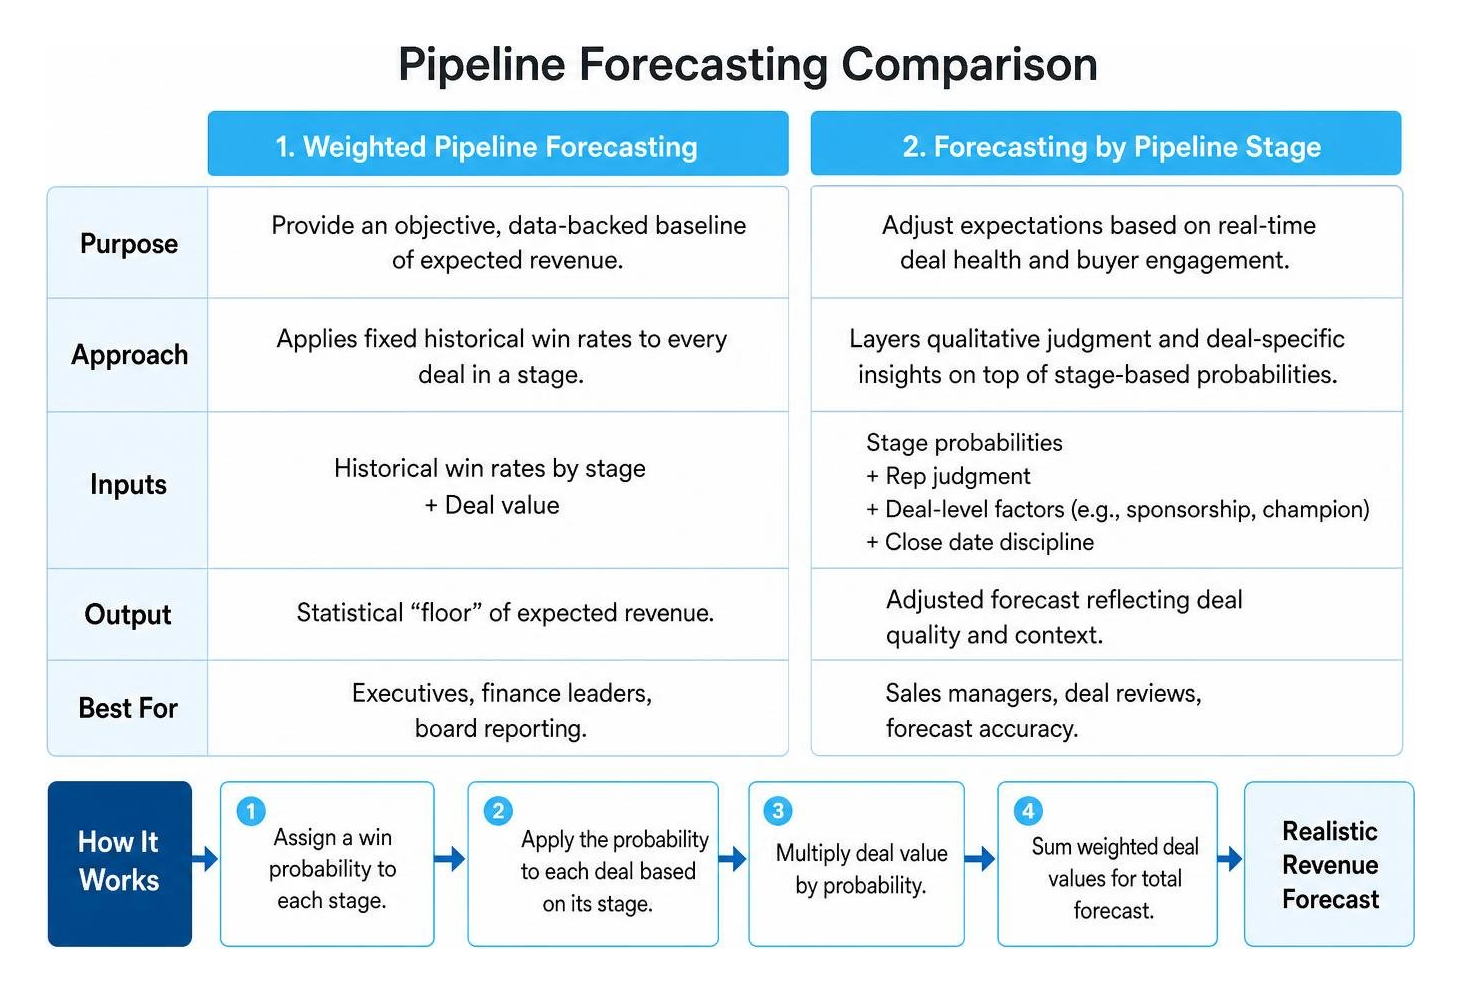
Weighted Pipeline vs. Forecasting by Pipeline Stage
It is easy to confuse a general weighted pipeline with stage-based forecasting, but they serve slightly different purposes in practice.
- Weighted Pipeline Forecasting: This is an aggregate, mathematical model. It applies fixed historical win rates to every deal in a given stage, regardless of individual deal nuances. It is designed to give executive teams, finance leaders, and board members an objective baseline of expected revenue.
- Forecasting by Pipeline Stage (Stage-Based Forecasting): This model often layers qualitative inputs on top of the mathematical weights. For example, it might incorporate a sales rep's manual judgment, deal-level variables (like executive sponsorship or champion strength), and strict close date discipline.
While a weighted pipeline gives you the statistical "floor" of your revenue, stage-based forecasting allows managers to adjust expectations based on real-time deal health and buyer engagement.
How to Calculate Your Weighted Pipeline Value
Calculating your weighted pipeline value is a straightforward mathematical process. The formula is:
Weighted Value = Opportunity Value × Close Probability
To find your total weighted pipeline, you calculate this for each open opportunity and sum the results. This gives you a realistic estimate of expected revenue that you can confidently share with stakeholders. You can read more about how this connects to deal-level variables in our Deal Win Probability Glossary.
To see how this works in practice, let's look at a comparative table of a typical sales pipeline:
| Opportunity Name | Deal Stage | Raw (Unweighted) Value | Stage Probability | Weighted Pipeline Value |
|---|---|---|---|---|
| Deal A | Discovery / Initial Contact | $100,000 | 10% | $10,000 |
| Deal B | Qualification / Needs Analysis | $150,000 | 25% | $37,500 |
| Deal C | Proposal / Solution Presentation | $200,000 | 50% | $100,000 |
| Deal D | Negotiation / Contract Review | $120,000 | 75% | $90,000 |
| Deal E | Verbal Commit / Pending Signature | $60,000 | 90% | $54,000 |
| Total | $630,000 | Average: 50% | $291,500 |
As this table shows, while the raw pipeline value is $630,000, the realistic weighted value is $291,500. Planning your business operations, hiring, or marketing spend around the unweighted $630,000 would put your organization at extreme financial risk.
Step-by-Step Calculation Example
Let's walk through a real-world scenario. Imagine a B2B software company with three active deals in their pipeline:
- Deal 1 (Discovery Stage): Worth $100,000. Historically, only 10% of deals in this stage close.
- Weighted Value: $100,000 × 0.10 = $10,000
- Deal 2 (Proposal Stage): Worth $200,000. Historically, 50% of deals at this stage close.
- Weighted Value: $200,000 × 0.50 = $100,000
- Deal 3 (Negotiation Stage): Worth $150,000. Historically, 80% of deals at this stage close.
- Weighted Value: $150,000 × 0.80 = $120,000
To calculate the total expected revenue, we add the weighted values together:
$10,000 (Deal 1) + $100,000 (Deal 2) + $120,000 (Deal 3) = $230,000
Even though the unweighted pipeline is $450,000, the mathematical reality is that we can expect to close $230,000. For more context on how this calculation is utilized at the executive level, see the Weighted Pipeline | Chief B2B Sales Definition .
Calibrating and Recalibrating Stage Probabilities with Historical Data
The biggest mistake we see sales teams make when setting up a weighted pipeline is using arbitrary, "made-up" stage probabilities. If your CRM defaults to 20%, 50%, and 80% because those were the pre-set fields when you bought the software, your forecast is built on fiction.
To build a forecast you can actually trust, you must calibrate your probabilities using real historical conversion data. This means looking back at your last 2 to 4 quarters of closed opportunities to find your true Win Rate Glossary.
To calculate your true historical conversion rate for any given stage, use this process:
- Identify the total number of deals that entered a specific stage (e.g., Proposal) over the last 12 months.
- Track how many of those specific deals eventually crossed the finish line as "Closed-Won."
- Divide the closed-won deals by the total deals that entered that stage. If 100 deals entered the Proposal stage and 30 were won, your proposal stage probability is 30%—not the 50% default your CRM suggested.
For a deeper look at this process, we highly recommend reading "Weighted Pipeline: Probability-Based Opportunity Valuation and Forecasting - 2026 Guide" .
Optimizing Your Weighted Pipeline Sales Conversion Rates Over Time
Once you have your baseline probabilities, the work isn't done. Markets shift, sales teams mature, and product offerings change. This is why quarterly recalibration is essential.
We also need to recognize that a single, flat probability model rarely fits an entire business. To optimize your weighted pipeline sales conversion accuracy, you should segment your calculations by key deal characteristics:
- Deal Size: Enterprise deals often have lower conversion ratios and longer sales cycles than mid-market or SMB deals.
- Lead Source: Inbound opportunities from high-intent channels (like direct demo requests) often convert at 2–3x the rate of outbound cold-sourced opportunities.
- Deal Type: Renewals and expansion deals naturally have much higher win rates than net-new business and must be tracked in separate pipelines with their own unique weights.
By continuously tracking your Sales Velocity Glossary, you can adjust these weights dynamically, ensuring your forecasts remain razor-sharp as your go-to-market engine evolves.
Benefits and Challenges of the Weighted Pipeline Model
Implementing a weighted pipeline model brings a level of discipline and predictability that can transform a B2B sales organization. However, it also introduces operational challenges that require consistent management.
Key Benefits
- Realistic Revenue Forecasting: By discounting early-stage deals, you significantly reduce forecast error, keeping your variance close to the best-in-class benchmark of under 10%.
- Resource Prioritization: Sales managers can easily see where to allocate technical resources, executive sponsors, and marketing support to secure high-probability revenue.
- Early Warning System: If your weighted pipeline coverage falls below your target, you will spot the gap 4–6 weeks before a forecast miss, giving you time to ramp up outbound campaigns. Learn more about managing these ratios in our Pipeline Coverage Glossary.
Primary Challenges
- Stale Deals and Pipeline Decay: If a deal sits in the "Negotiation" stage (75% probability) for six months without any activity, it is a dead deal. Yet, a basic weighted model will still count it at 75% value, inflating your forecast.
- Rep Sandbagging and Inflation: Sales reps are human. Some will keep deals in early stages to "sandbag" their numbers, while others will prematurely push deals into late stages to look active, throwing off the mathematical model.
- Data Hygiene: A weighted pipeline is only as good as the data feeding it. If reps fail to update close dates, deal values, or stages, the entire forecast collapses.

When to Use (and When to Avoid) a Weighted Pipeline
A weighted sales pipeline is highly recommended for:
- Complex B2B Sales: Where deals progress through clearly defined milestones over several months.
- Quarterly and Annual Planning: Where finance teams require a predictable, aggregate revenue baseline to plan headcount and budgets.
- Established Sales Teams: Where you have at least 6–12 months of historical CRM data to calibrate your stage weights.
Conversely, you should avoid or heavily supplement a weighted pipeline in these scenarios:
- Highly Transactional Sales: If your sales cycle is under 14 days, stage-based weighting is overkill. You are better off using historical run-rate forecasting.
- Early-Stage Startups: If you don't have historical data, your probabilities will be pure guesses. Focus on unweighted pipeline and individual deal reviews instead.
- Extreme Deal Size Disparity: If your average deal is $10,000, but you have one $1,000,000 enterprise deal in your pipeline, a weighted model will distort reality. That single massive deal must be forecasted individually, outside the standard model.
How Modern Technology Automates Weighted Pipeline Management
Managing a weighted pipeline manually in spreadsheets is a recipe for disaster. It is time-consuming, prone to human error, and outdated the moment a rep hangs up a phone call.
Modern CRM and CPQ (Configure, Price, Quote) systems solve this by automating the entire calculation process. Platforms like Salesforce and HubSpot allow RevOps teams to lock stage-level probabilities, preventing individual reps from manually inflating percentages. When a rep moves a deal from "Discovery" to "Proposal," the CRM automatically recalculates the weighted value in real-time.
Furthermore, advanced predictive deal scoring tools use machine learning to analyze actual buyer engagement signals—such as email opens, meeting attendance, and multithreading—to adjust deal probabilities dynamically. For a comprehensive look at how modern B2B teams structure this technology, see Weighted Pipeline Definition: The Complete B2B Guide and Weighted Sales Pipeline Explained: Formula, Example & Use .
Using automated deal stage probabilities can improve forecast accuracy up to 95%, removing human bias and giving leadership a number they can actually build a business around.

Frequently Asked Questions about Weighted Pipeline Sales Conversion
What is a good weighted pipeline coverage ratio?
A healthy weighted pipeline coverage ratio is typically between 1.5x and 2.0x of your revenue target.
This is fundamentally different from a raw (unweighted) coverage ratio, where B2B SaaS companies typically look for 3x to 4x coverage. Because a weighted pipeline has already discounted early-stage deals based on their likelihood of closing, a 1.5x to 2.0x weighted ratio provides a comfortable, realistic buffer for deal slippage and timing delays. If your weighted coverage drops below 1.0x, your revenue target is in immediate jeopardy.
How often should we update our stage probabilities?
We recommend recalibrating your stage probabilities quarterly.
For high-velocity sales cycles, a monthly review may be appropriate. A quarterly cadence allows you to capture changes in sales team performance, macro-economic shifts, and marketing lead quality, ensuring your mathematical model stays aligned with real-world conversion rates.
Can individual reps override default stage probabilities?
As a rule of thumb, no. Individual reps should not be allowed to manually override default stage probabilities in the CRM.
Allowing manual overrides invites subjective bias, over-optimism, and sandbagging. Instead, establish strict override governance. If a rep has a valid, objective reason to alter a deal's probability (e.g., a signed verbal commitment or a lost executive sponsor), they should require manager approval and a documented reason to apply a manual adjustment.
Conclusion
A weighted pipeline is not just a passive reporting tool; it is an active operational system. By moving away from unweighted "wish lists" and building a disciplined, data-driven weighted model, B2B SaaS leaders can achieve predictable revenue growth, optimize resource allocation, and eliminate end-of-quarter surprises.
At atSpark, we believe that accessing these critical insights shouldn't require a team of data engineers or complex SQL queries. Our AI-powered analytics platform unifies your billing, CRM, and subscription data into a single source of truth. With atSpark, you can ask plain-English questions—like "What is our weighted pipeline coverage for enterprise deals this quarter?"—and get instant, governed charts and tables.
Ready to turn your pipeline data into actionable revenue insights? Explore our Weighted Pipeline Glossary to master the metrics that drive B2B success, and let us help you bring complete predictability to your sales engine.