If your SaaS is growing but revenue still feels slippery, the problem usually is not effort. It is visibility. SaaS business metrics are the small set of numbers that show where money is coming from, where it is leaking out, and which moves can improve growth fast without guessing.
Early on, these metrics look like reporting. After a while, you realize they are really operating signals. MRR shows recurring revenue momentum, churn shows how much slips away, CAC shows what growth costs, and retention tells you whether customers keep finding value after the sale.
What SaaS Business Metrics Really Tell You
SaaS business metrics tell you how your subscription business is behaving beneath the surface. Not just whether revenue went up this month, but why. Did growth come from new customers, larger accounts, better pricing, lower churn, or a temporary sales spike that will fade in 90 days?
That difference matters more than most teams admit. A dashboard should work like the speedometer and fuel gauge in a car, not like homework you complete for a board deck. When the right numbers sit in front of you, it gets much easier to spot which parts of the business are healthy, which parts are fragile, and where revenue can move fastest.
Here’s what you’ll learn in this guide:
- Which metrics matter most first
- How revenue, retention, and CAC connect
- Where growth usually leaks in SaaS
- Which numbers matter by growth stage
- How to build a dashboard people use
- How to improve metrics in 30 days
The difference between vanity metrics and business metrics
Vanity metrics feel good because they are easy to grow and easy to celebrate. Signups, pageviews, social followers, webinar registrations, free users. Those numbers can tell you something, but on their own they do not tell you whether the business is getting stronger.
Business metrics are different because they connect directly to revenue quality. MRR, ARR, churn, CAC, NRR, LTV, and payback period all answer a harder question: is growth durable, efficient, and profitable enough to keep going? Ten thousand signups sound exciting. But if activation is poor, churn is high, and paid acquisition keeps getting pricier, that signup chart is mostly decoration.
Why revenue moves faster when you track the right numbers
The right metrics shorten the distance between noticing a problem and fixing it. If CAC rises by channel, you can cut waste before paid spend gets ugly. If expansion revenue climbs in one customer segment, you can lean into packaging or success plays that increase account value. If churn spikes after month two, you can tighten onboarding instead of pumping more money into lead generation.
That is why good metric tracking speeds up revenue movement. You stop reacting to symptoms and start acting on causes.

The Core SaaS Metrics You Should Know First
There are dozens of metrics in SaaS, and honestly, trying to track all of them too early turns your dashboard into a junk drawer. Start with the few that explain revenue, retention, and efficiency.
A simple mental model helps. Some metrics tell you how much recurring revenue you have. Some show whether customers stay. Some reveal whether growth is efficient enough to sustain. If you want a broader map of the numbers most SaaS teams keep close, that structure makes the rest of this guide easier to use.
Recurring revenue metrics
MRR tells you monthly recurring revenue. ARR gives you the annualized version of that recurring run rate. ARPU or ARPA shows average revenue per user or account, which helps you understand monetization. ACV, annual contract value, tells you the average annual value of a contract and becomes especially useful when sales cycles and deal sizes get larger.
Together, these metrics answer a basic but important question: how much recurring revenue exists, and what is the average customer worth?
Customer and retention metrics
Customer churn shows what share of customers leave in a given period. Revenue churn tracks the dollars lost instead of the logos lost. Retention tells you how many customers or how much revenue stays. NRR, net revenue retention, rolls renewals, churn, downgrades, and expansion into one metric. Logo retention isolates customer count retention regardless of account size.
These are the metrics that tell you whether growth sticks.
Efficiency and growth metrics
CAC measures what it costs to acquire a customer. LTV estimates how much value a customer generates over time. CAC payback period shows how long it takes to recover acquisition cost. Magic Number looks at how efficiently sales and marketing spend turns into new ARR. Burn multiple and Rule of 40 zoom out to show whether growth and financial discipline are balanced.
Revenue Metrics: Start With MRR, ARR, and Expansion Revenue
If you only checked a few numbers every week, revenue metrics would be near the top. They tell you whether the business is actually compounding or just working harder to stand still.
The trick is not just tracking total revenue. You want to know where changes came from. New logos, larger contracts, usage growth, upgrades, annual prepayments, pricing changes, downgrades. Revenue gets more useful the moment you break it into parts.
Monthly recurring revenue (MRR)
MRR is the predictable subscription revenue you expect every month from active customers. It typically includes recurring subscription fees and recurring add-ons. It does not include one-time setup fees, services revenue, or random nonrecurring charges.
This is often the number you check most because it reflects your current subscription engine in real time. If MRR rises, the next question is obvious: why? A healthy answer sounds like more new business plus decent retention plus some expansion. A shaky answer sounds like one pricing change masking growing churn.
Annual recurring revenue (ARR)
ARR is usually MRR multiplied by 12, though annual contracts can make ARR feel more natural than MRR in larger B2B SaaS businesses. If deals are big, renew yearly, and include procurement cycles, ARR becomes a cleaner planning number.
ARR is especially useful for forecasting, hiring plans, board reporting, and comparing annual growth pace across periods. It smooths short-term noise. The catch is that it can also hide month-to-month problems if you stop looking at MRR and churn underneath it.
Average revenue per user or account (ARPU/ARPA)
ARPU or ARPA tells you the average revenue generated by each user or account in a period. The formula is simple: recurring revenue divided by active users or accounts.
This metric matters because revenue growth can look healthy while monetization stays flat. If ARPU climbs, you may be improving pricing, attracting better-fit customers, or expanding usage within accounts. If ARPU falls, you may be discounting too heavily or adding lower-value customers faster than higher-value ones.
It gets more useful when segmented. Enterprise ARPA and SMB ARPA are different stories. So are self-serve and sales-led motions.
Expansion revenue and contraction revenue
Expansion revenue comes from existing customers paying more. That can happen through seat growth, higher usage, upgrades, cross-sells, or add-on purchases. Contraction revenue is the opposite, revenue lost from downgrades, seat reductions, or plan changes short of full churn.
These shifts are easy to miss because they happen quietly inside existing accounts. But over time, they shape your growth trajectory as much as new sales. If expansion is strong, revenue compounds faster. If contraction is common, top-line growth starts fighting gravity.
Retention Metrics: The Fastest Way to Protect and Grow Revenue
Retention is one of the fastest revenue levers in SaaS. That is a direct claim because it keeps proving true. Replacing lost customers is expensive, and keeping an existing customer usually costs less than finding a new one from scratch.
In practice, revenue often grows faster when you reduce leaks before adding more water. If you want a deeper look at the retention signals that expose those leaks, start there after this section.
Customer churn rate
Customer churn rate measures the percentage of customers who cancel in a given period. The formula is straightforward: customers lost during the period divided by customers at the start of the period.
If you start the month with 200 customers and lose 10, monthly customer churn is 5 percent. The key is consistency. Use the same time period, same customer definition, and same inclusion rules every time. Otherwise, comparison gets messy fast.
Revenue churn rate
Revenue churn rate tracks recurring revenue lost from churn and downgrades. This often matters more than customer churn because not all customers are equal in revenue terms. Losing one large account can hurt more than losing five tiny ones.
Gross revenue churn looks only at lost revenue from churn and downgrades. Net revenue churn factors in expansion from existing customers. That distinction matters. A business can lose logos and still grow revenue within the remaining base.
Net revenue retention (NRR)
NRR measures how recurring revenue from an existing customer cohort changes over time after including renewals, downgrades, churn, and expansion. It is one of the best single metrics in SaaS because it captures both durability and upside.
An NRR above 100 percent means your existing customers, as a group, are spending more over time even after losses. That is a powerful signal. It means expansion is more than offsetting churn and contraction. No surprise this metric gets so much attention from operators and investors.
Logo retention
Logo retention measures the percentage of customers retained, regardless of contract size. This becomes especially useful when account values vary a lot or when a few large customers can distort revenue retention.
For example, a company with strong NRR but weak logo retention may be growing inside large accounts while smaller accounts quietly churn out. That is not automatically bad, but it tells you where your model is concentrating.
Customer Acquisition Metrics: Make Growth Cheaper and Cleaner
Growth that gets more expensive every quarter is not really growth. It is just buying revenue at worse terms. Acquisition metrics help you see whether your go-to-market motion is efficient or just busy.
Customer acquisition cost (CAC)
CAC measures the cost to acquire a customer. Usually that means sales and marketing spend over a period divided by the number of new customers added in that same period. Depending on your motion, that spend may include ad costs, salaries, commissions, tools, agencies, and program spend.
The useful version of CAC is not one blended average. You want CAC by channel, segment, and acquisition motion. Paid search CAC, outbound CAC, partner CAC, self-serve CAC. Once you break it apart, waste gets easier to spot. For a broader look at how growth efficiency metrics fit together, this is where the story usually starts.
Lead-to-customer conversion rate
This metric shows what percentage of leads become customers. It is one of the cleanest ways to find friction in your funnel.
If traffic rises but conversions stall, adding more traffic usually makes the problem more expensive, not better. Low lead quality, weak qualification, poor messaging, slow sales response, pricing confusion, or a rough trial experience can all drag this number down. The trick is to inspect each handoff instead of staring at the final conversion rate alone.
CAC payback period
CAC payback period measures how long it takes to recover the cost of acquiring a customer from gross profit generated by that customer. Shorter payback is better because it means cash comes back faster.
This matters a lot when growth feels expensive. A company can show decent revenue growth and still create cash strain if payback stretches too long. Long payback slows hiring, raises financing pressure, and makes scaling riskier.
SaaS Magic Number
The SaaS Magic Number estimates how efficiently sales and marketing spend turns into new recurring revenue. There are slight formula variations, but the goal is the same: compare net new ARR growth against sales and marketing investment.
Think of it as a quick productivity check for your go-to-market engine. A stronger Magic Number suggests that spend is translating into revenue efficiently. A weak one says growth may be too costly, or that recent spend has not matured into revenue yet.
LTV, CAC:LTV Ratio, and Unit Economics
Unit economics answer a blunt question: does each customer create enough value to justify the cost of winning and serving that customer? If not, top-line growth can hide a broken model for a long time.
Customer lifetime value (LTV)
LTV estimates the revenue or gross profit a customer generates over the lifetime of the relationship. Simple models use ARPU and churn. Better models also account for gross margin and segment differences.
A common mistake is treating LTV as a precise truth. It is an estimate, and it gets shaky fast if churn assumptions are weak. Another mistake is ignoring margin. Revenue is not the same as usable cash, especially when service or infrastructure costs are meaningful.
CAC-to-LTV ratio
This ratio compares customer lifetime value to customer acquisition cost. It helps you judge whether acquisition spend makes economic sense.
A healthy benchmark often gets described as 3:1, but that is not universal. Early-stage companies may accept weaker ratios while proving demand. Premium products with strong retention may support higher CAC. Fast-growth strategies sometimes trade near-term efficiency for land-grab momentum. The point is not chasing a magic number. The point is making the tradeoff knowingly.
Gross margin and contribution margin
Gross margin shows how much revenue remains after direct costs such as hosting, support delivery, or service costs tied to serving customers. Contribution margin goes a step further by factoring in additional variable costs.
These metrics matter because two companies with the same ARR can have very different economics. Higher margins give you more room to invest in growth. Lower margins mean each dollar of recurring revenue stretches less far.
Product and Engagement Metrics That Predict Revenue
Revenue problems often start as product usage problems. Customers rarely wake up one morning and cancel out of nowhere. Usually there were warning signs weeks earlier, fewer active users, slower onboarding, weak feature adoption, or a drop in depth of use.
That is why product metrics deserve a place next to financial ones. A useful primer on the usage patterns that often predict churn or upsell can help if this is the part of the puzzle you have ignored.
DAU, WAU, and MAU
Daily, weekly, and monthly active users measure how often people meaningfully use your product. The right one depends on product behavior. A collaboration tool may care about DAU. Payroll software may care more about MAU because monthly use is normal.
The mistake is copying another company’s active-user metric without asking what healthy usage actually looks like for your product. Frequency should match expected value delivery.
Activation and time-to-value
Activation is the moment a user first reaches meaningful value. Time-to-value is how long it takes to get there.
This area matters more than many dashboards show. Faster activation usually leads to better retention because customers experience the payoff before doubt sets in. If setup feels long and confusing, churn starts early. Often the fastest revenue win is simply making the first successful outcome happen sooner.
Feature adoption and engagement score
Feature adoption shows which capabilities customers actually use. Engagement scores combine multiple signals, such as logins, seat usage, completed workflows, or integrations, into a single health view.
Used well, these metrics help you see upsell potential and churn risk early. Accounts adopting advanced features may be ready for expansion. Accounts using only one thin slice of the product may need success intervention. If you want to go deeper into the customer health measures that support renewals and expansion, that is the next layer.
Net Promoter Score (NPS) and customer satisfaction signals
NPS and satisfaction surveys can be useful, but only when tied to behavior. Sentiment without outcome data is flimsy. Plenty of customers say nice things and still churn. Plenty of grumpy customers renew because the product is embedded in daily work.
The better use of sentiment metrics is to compare them with retention, expansion, support volume, and product usage. Then you can see whether customer feelings actually predict revenue outcomes.

Financial Health Metrics for Sustainable SaaS Growth
Fast growth can hide weak financial health for longer than you expect. Eventually cash flow catches up. That is why mature SaaS operating reviews include metrics that connect growth to sustainability.
Burn multiple
Burn multiple measures how much net burn it takes to generate one unit of net new ARR. Lower is better because it means you are creating growth more efficiently.
This metric gets extra attention in tighter funding markets, when cheap capital disappears and efficiency matters again. It is a clean reality check. If burn keeps rising faster than recurring growth, something in the model needs tightening.
Rule of 40
The Rule of 40 combines growth rate and profit margin. If the two add up to 40 or more, the business is generally seen as balancing growth and profitability reasonably well.
It is not a law of nature. But it is a useful shorthand. High growth can justify lower profitability for a while. Lower growth should usually come with stronger margins. The formula keeps those tradeoffs visible.
Bookings, billings, and revenue
These terms get mixed up constantly. Bookings represent signed contract value. Billings represent invoiced amounts. Revenue is what gets recognized according to accounting rules over the service period.
You need all three, but for different purposes. Bookings help show sales momentum. Billings help with cash timing. Revenue reflects recognized business performance. Confusing them leads to bad forecasts and weird optimism.
Customer concentration risk
Customer concentration risk measures how much revenue depends on a small number of accounts. If 30 percent of ARR comes from three customers, your business is less stable than the topline may suggest.
This is easy to overlook during strong enterprise growth. But concentrated revenue can distort retention, NRR, and forecast confidence. One bad renewal can change the whole quarter.
How to Build a SaaS Metrics Dashboard You’ll Actually Use
A useful dashboard is not the one with the most charts. It is the one people can scan in five minutes and use to make a decision.
Pick metrics by team and decision
Different functions need different views. Founders need the top operating picture. Product leaders care about activation, adoption, and retention signals. Sales leaders focus on pipeline conversion, CAC, and productivity. Finance cares about ARR quality, burn, margin, and forecasting accuracy.
Build from decisions backward. If a metric does not lead to action, it probably does not belong on the main dashboard.
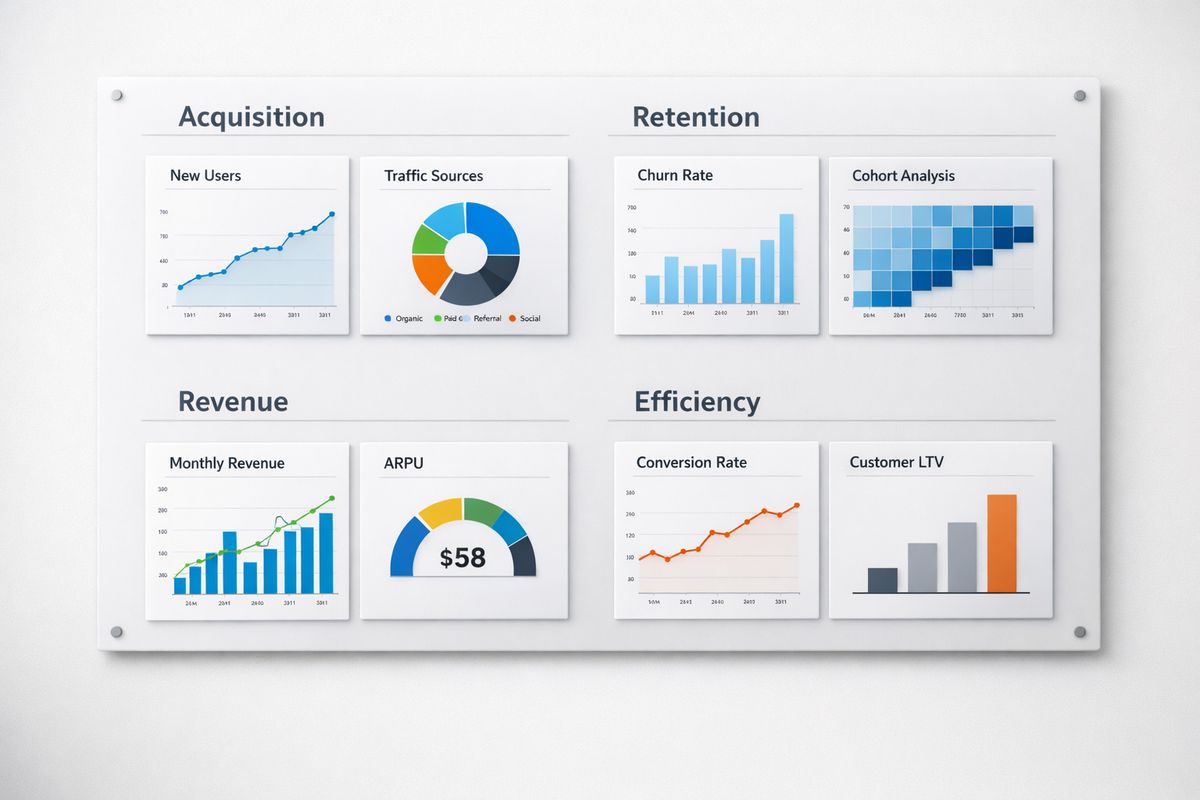
Group metrics by acquisition, retention, revenue, and efficiency
This is the simplest structure because it tells a story. Acquisition explains how customers arrive. Retention shows whether they stay. Revenue shows how account value changes. Efficiency reveals whether growth is affordable.
A clean operating dashboard structure that keeps your KPIs readable usually beats a giant wall of charts every time.
Set reporting cadence and definitions
Some metrics deserve weekly review, especially leading indicators like pipeline conversion, activation, and expansion opportunities. Others fit monthly or quarterly review, such as Rule of 40 or concentration risk.
More important, define every metric once and stick to it. What counts as churn? Which costs go into CAC? Which accounts count as active? Small formula changes can wreck trust in the numbers.
How to Improve SaaS Business Metrics Fast
Most revenue gains do not require a full rebuild. Usually the best results come from fixing one bottleneck that is dragging several metrics at once.
Reduce churn before you chase more acquisition
Plug leaks first. If onboarding is rough, improve handoffs, simplify setup, shorten time-to-value, and trigger proactive outreach when usage drops. If early retention is weak, look at the first 30 to 60 days before spending more at the top of funnel.
This is not glamorous, but it works. Saving revenue you already won is often the fastest path to healthier growth.
Increase expansion revenue from existing accounts
Expansion can move revenue surprisingly fast because the customer relationship already exists. Usage-based nudges, better packaging, annual plan upgrades, seat thresholds, and timely upsell conversations all help.
The trick is context. Expansion works best when tied to visible value, not random sales pressure. If an account has adopted deeper workflows, added teams, or hit usage ceilings, that is the moment.
Lower CAC with tighter targeting and better conversion
A lot of CAC waste comes from talking to the wrong people or saying the right thing too vaguely. Sharper ICP focus, better qualification, clearer landing pages, stronger demos, and faster follow-up can all lower acquisition cost without touching budget.
Funnel cleanup is often cheaper than buying more attention.
Improve pricing and packaging
Pricing changes can lift ARPU and payback quickly. Sometimes the win is a cleaner plan structure. Sometimes it is better feature gating, seat minimums, annual discounts, or usage tiers that line up better with customer value.
Pricing is like shelving in a small kitchen. When it is organized well, everything works better. When it is messy, even good ingredients turn into friction.
Which SaaS Metrics Matter Most at Each Growth Stage
Not every metric deserves equal attention at every stage. Tracking everything at once is how teams get buried in numbers and miss the one that matters.
Early-stage SaaS
Early on, focus on activation, early retention, and signs of repeatable demand. CAC discipline matters, but not as much as learning whether people reach value and stay long enough to justify acquisition.
If retention is weak, almost everything else is downstream noise.
Growth-stage SaaS
At growth stage, the focus shifts toward NRR, CAC payback, sales efficiency, expansion, and segment-level economics. This is usually when blended averages stop being useful and cohort analysis becomes nonnegotiable.
You are no longer proving the product exists. You are proving the model scales.
Later-stage SaaS
Later-stage SaaS needs stronger attention on profitability, burn multiple, forecasting accuracy, concentration risk, and durable retention across segments. By this point, the question is less about can you grow, and more about can you grow predictably and efficiently at scale.
Common SaaS Metrics Mistakes That Lead to Bad Decisions
A polished dashboard can still point you in the wrong direction. A few common mistakes do more damage than most teams realize.
Using inconsistent formulas
If one report includes reactivations in new customer count and another does not, trend lines stop meaning much. The same goes for CAC inputs, churn definitions, and active user rules.
Consistency beats cleverness every time.
Looking at blended averages only
Blended averages flatten reality. You can have healthy overall CAC while one channel is broken. You can have decent ARPA while one segment is shrinking. You can have solid NRR while a specific customer cohort is unraveling.
Segment by plan, channel, persona, or cohort whenever you need to explain a change.
Ignoring cohorts and trend lines
A monthly snapshot is useful, but it is not enough. Cohorts show whether retention is improving for newer customers. Trend lines show whether a “good” month is actually part of a slow decline.
This is where the truth usually lives.
Tracking too many metrics at once
More metrics do not create more clarity. Usually the opposite happens. Pick the handful tied to your next growth move, then support them with a few diagnostic metrics underneath.
If the dashboard feels crowded, it probably is.
A Simple 30-Day Plan to Turn Metrics Into Revenue
This should feel doable, not like a six-month transformation project. Think of it like something you sketch on a whiteboard after a Tuesday morning pipeline review in Austin, then start that afternoon.
Week 1: Audit definitions and dashboard basics
Clean up the foundation first. Confirm how you calculate MRR, ARR, customer churn, revenue churn, CAC, NRR, LTV, and payback period. Remove duplicate dashboards and make one source of truth for each metric.
This week is about trust. If the math changes depending on who pulls the report, nothing else matters.
Week 2: Find the biggest revenue leak
Now look for the bottleneck with the biggest near-term payoff. Is churn highest in the first 60 days? Is paid CAC climbing? Is conversion weak between trial and paid? Are existing accounts flat when expansion should be possible?
Pick one leak. Not four.
Week 3: Run one focused improvement test
Choose a single lever and set a clear target. For example, reduce month-two churn by 15 percent, improve demo-to-close rate by 10 percent, or increase expansion conversations in top accounts by 20 percent.
Keep the feedback loop short. One change, one measurable outcome, one owner.
Week 4: Review results and lock in a new operating rhythm
Check what changed and what did not. If the test worked, keep it and decide what to monitor weekly. If it failed, use the result to refine the next test instead of calling the whole effort a miss.
The habit you want is simple: measure, diagnose, test, repeat.
SaaS Business Metrics FAQ
What are the most important SaaS business metrics?
For most SaaS companies, start with MRR or ARR, customer churn, revenue churn, NRR, CAC, LTV, and CAC payback period. Those metrics cover growth, retention, and efficiency without overwhelming your dashboard.
What is a good SaaS churn rate?
A good churn rate depends on pricing, customer type, market, and stage. Enterprise SaaS often tolerates lower logo churn because contracts are stickier. SMB and self-serve models usually see higher churn. The more useful question is whether churn is improving by cohort and whether expansion offsets losses.
How often should you track SaaS metrics?
Leading indicators like conversion, activation, pipeline movement, and expansion opportunities usually deserve weekly review. Core financial and retention metrics often fit monthly review. Bigger planning metrics, such as Rule of 40 and concentration risk, usually make sense quarterly.
Which SaaS metric boosts revenue the fastest?
Retention and expansion usually move revenue faster than adding more top-of-funnel volume. Keeping existing customers and growing account value tends to cost less and show results sooner than acquiring replacement revenue.
What is the difference between customer churn and revenue churn?
Customer churn tracks how many customers leave. Revenue churn tracks how much recurring revenue is lost from churn and downgrades. Revenue churn often tells the more useful story because large accounts carry more weight than small ones.
How many SaaS metrics should you track on one dashboard?
Keep the main dashboard tight, usually around 8 to 12 core metrics. Support those with deeper drill-down views by function or team. If the main page tries to answer every question, it usually answers none of them well.
Where to start if you want revenue to move
Start by fixing the leak closest to revenue. In most SaaS companies, that means retention first, expansion second, acquisition efficiency third. Once you can see those three clearly, better decisions come faster and revenue stops feeling mysterious.
Try AtSpart to turn your SaaS business metrics into a simple operating system your team can actually use.