What ARR per Sales Rep Actually Tells You (And What It Doesn't)
ARR per sales rep is the single most-watched productivity metric on any SaaS revenue team's dashboard — and one of the most frequently miscalculated.
Here's the quick answer if you need it now:
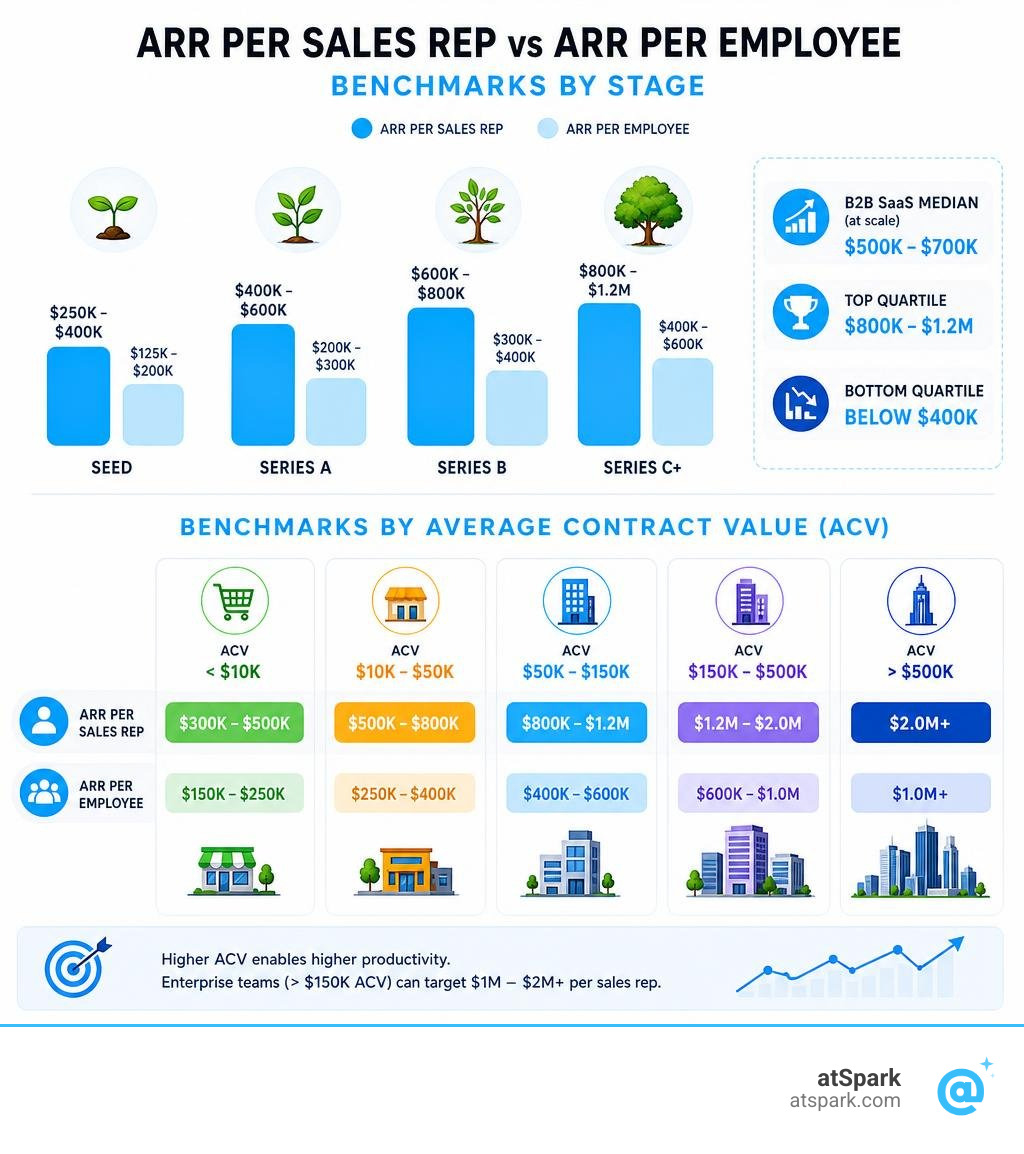
| Company Stage | ARR per Sales Rep Benchmark |
|---|---|
| Seed | $250K – $400K |
| Series A | $400K – $600K |
| Series B | $600K – $800K |
| Series C+ | $800K – $1.2M |
| B2B SaaS median (at scale) | $500K – $700K |
| Top quartile | $800K – $1.2M |
| Bottom quartile | Below $400K |
These ranges shift significantly based on your average contract value (ACV). Enterprise teams selling deals above $150K can target $1M–$2M+ per rep. SMB teams with deals under $10K typically land between $300K and $500K.
But here's what most benchmark posts skip: the metric has been declining across B2B sales since 2019. In 2019, the average rep hit quota more than 60% of the time. By 2025, 78% of sellers missed quota entirely. The primary cause isn't rep skill — it's that reps now spend only 29% of their workweek actually selling. The remaining 71% disappears into admin, CRM entry, internal meetings, and prep work.
That means your ARR per rep number is largely a time-allocation problem, not a talent problem.
This guide breaks down the real benchmarks by stage and ACV, shows you how to calculate the metric correctly, and walks through the workflow changes that actually move the number.
ARR per Sales Rep vs. ARR per Employee: Key Differences
It is common for boards and finance teams to confuse organizational efficiency with sales team productivity. To evaluate your go-to-market model accurately, you must establish clear headcount boundaries between these two metrics.
- ARR per Employee: This is an overall operational efficiency metric. You calculate it by dividing your total ARR by your entire full-time equivalent (FTE) headcount. As of 2025, the median ARR per employee for private SaaS companies is $129,724 (up from $125,000 the previous year). This metric tells you how much leverage your entire organization has. For example, bootstrapped companies with $1M to $3M in ARR show a median ARR per employee of $110,000, while equity-backed companies of the same size sit at $94,444 because they intentionally hire ahead of revenue. You can read more about this in our ARR Per Employee Glossary.
- ARR per Sales Rep: This is a direct sales productivity metric. It isolates only your quota-carrying sales representatives (typically Account Executives). It completely excludes Sales Development Representatives (SDRs/BDRs), Sales Engineers (SEs), Customer Success Managers (CSMs), and sales management.
While ARR per employee tells you if the company is overstaffed relative to its scale, ARR per sales rep tells you if your sales engine is mathematically viable. If your overall workforce efficiency is low, it might be due to a heavy engineering or support team. But if your sales rep productivity is low, you have a structural go-to-market issue. To understand how this fits into your broader cost of acquisition, explore our Sales Efficiency Glossary.
How to Calculate ARR per Sales Rep Correctly
At first glance, the core calculation seems incredibly simple:
$$\text{ARR per Sales Rep} = \frac{\text{Total Closed-Won ARR in Period}}{\text{Number of Sales Reps}}$$
However, executing this formula in the real world is where most Revenue Operations (RevOps) teams run into trouble. To get an accurate, actionable number, you must account for ramp times, part-time schedules, and mid-period hiring.
To solve this, high-performing finance teams use Ramp-Adjusted Rep Months (RARM). This normalizes your denominator by applying a discount factor to reps who are still onboarding. For example, a standard ramp schedule might credit a rep as:
- Month 1: 0% FTE
- Month 2: 25% FTE
- Month 3: 50% FTE
- Month 4+: 100% FTE (fully ramped)
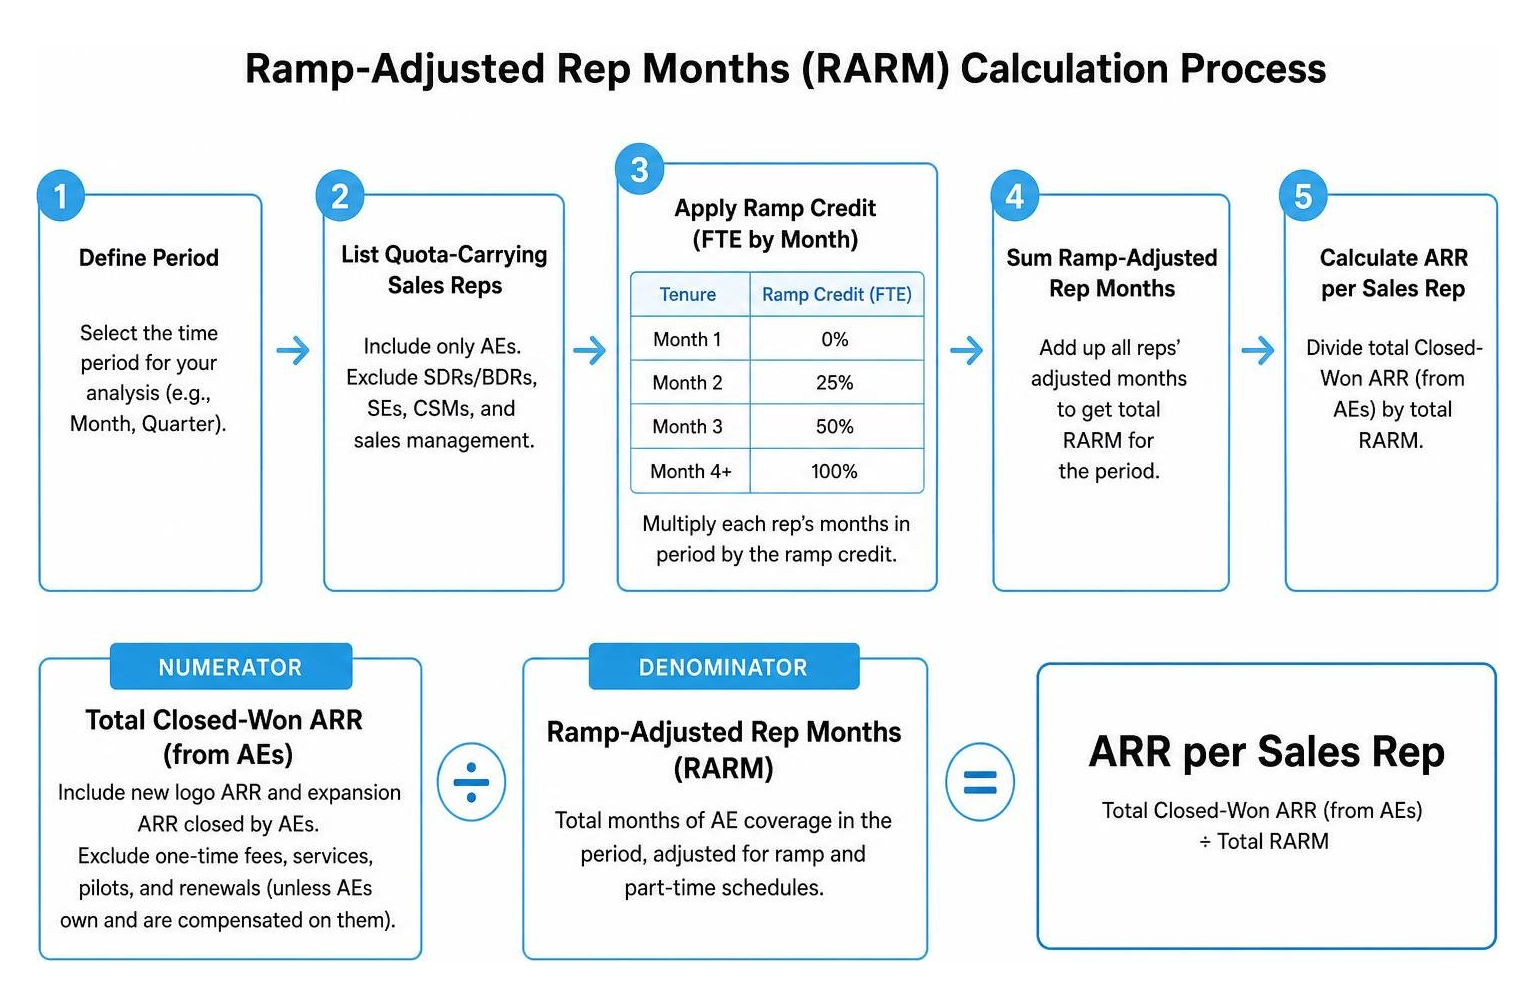
Additionally, you must decide what goes into the numerator. For SaaS companies, the numerator should strictly be Annual Recurring Revenue (ARR)—specifically new logo ARR and expansion ARR closed directly by those reps. Do not include one-time professional services, pilot fees, or renewal values (unless your AEs are directly responsible for renewals and compensated on them).
For a complete guide on aligning your CRM data to track these numbers, check out The Ultimate Guide to Tracking Quota Attainment Per Rep in Salesforce. You can also review the foundational definitions in the Revenue per rep — Gangly Glossary.
Common Mistakes in Calculating ARR per Sales Rep
If you do not clean your data before running this analysis, you will end up with skewed metrics that lead to poor hiring decisions. Avoid these three common pitfalls:
- Blending Ramping and Ramped Reps Unadjusted: If you hire ten new AEs in Q3, your total headcount denominator spikes. If you do not use RARM or exclude unramped reps entirely, your average ARR per rep will plummet, making a highly productive team look structurally inefficient.
- Mixing New and Expansion ARR: If your Customer Success team handles account expansion, but you attribute that expansion ARR to your AEs' productivity denominator, you are artificially inflating your sales rep performance. Keep new business and account management metrics strictly separated.
- Ignoring Tenure Cohorts: A flat average across the team masks underlying issues. You should segment your reps by tenure cohorts (e.g., 0–6 months, 6–12 months, 12+ months) to see if your onboarding program is working.
Miscalculating these figures directly leads to setting unrealistic quotas. To understand how to measure individual goals fairly, see our Quota Attainment Glossary.
2026 Benchmarks by Company Stage and ACV
To understand if your sales team is performing efficiently, you must benchmark your team against companies at a similar stage of maturity. Expecting a Seed-stage rep to close the same volume as a Series C enterprise rep is a recipe for organizational failure.
Here are the 2026 B2B SaaS ARR per sales rep benchmarks by company stage:
| Company Stage | Annual Quota Benchmark | Actual ARR per Rep Benchmark (Median) | Top-Quartile Target |
|---|---|---|---|
| Seed | $250K – $400K | $200K – $350K | $400K+ |
| Series A | $400K – $600K | $350K – $500K | $600K+ |
| Series B | $600K – $800K | $500K – $700K | $800K+ |
| Series C+ | $800K – $1.2M | $750K – $1.1M | $1.2M+ |
Data compiled from industry research, including the Revenue Per Sales Rep Benchmark - Quota & Productivity | Optifai.
As companies scale, their brand recognition increases, their product matures, and their marketing engine generates higher-quality inbound leads. This naturally allows them to demand higher quota capacity from their reps.
How ACV Impacts Your ARR per Sales Rep Targets
While company stage provides a rough guide, your Average Contract Value (ACV) is the true driver of your sales motion—and your productivity targets.
- Low ACV (<$10K): These motions are highly transactional. Reps must close a massive volume of deals to hit their numbers. The benchmark is $300K – $500K in ARR per rep.
- Mid ACV ($10K – $50K): This is the standard B2B mid-market range. The benchmark runs between $500K – $750K in ARR per rep.
- High ACV ($50K – $150K): These deals require multi-stakeholder navigation and longer sales cycles. The benchmark is $750K – $1M in ARR per rep.
- Enterprise (>$150K): These are complex, highly customized sales cycles that can take 6 to 12+ months. Because the deals are massive, the benchmark is $1M – $2M+ in ARR per rep.
You can explore how these benchmarks shift across different software verticals in the Revenue per sales rep benchmarks by industry in 2026 | Outreach.
Evaluating Profitability: The Rep Productivity Ratio
Just because a sales rep is closing $600K in ARR does not mean they are profitable for your business. To evaluate the true financial viability of your sales team, you must look at the Rep Productivity Ratio (also known as the revenue-to-compensation ratio).

The formula is:
$$\text{Rep Productivity Ratio} = \frac{\text{Average ARR per Ramped Rep}}{\text{Fully Loaded Cost per Rep}}$$
Your fully loaded cost is not just the rep's base salary. It must include:
- Base salary
- Commissions paid out at 100% quota attainment (OTE)
- Company-paid benefits and payroll taxes
- Allocated overhead (software licenses, laptop, travel, and desk space)
For example, if a mid-market AE has a $120K base, $120K commission OTE, $25K in benefits, and $35K in allocated overhead, their fully loaded cost is $300,000.
If that rep generates $1.2M in ARR, their Rep Productivity Ratio is 4x ($1.2M / $300K).
The Profitability Thresholds:
- Below 3x: This is a major warning sign. It suggests your sales motion is too expensive, you have over-hired, or your territories are heavily diluted. Your business is likely losing money on every deal closed.
- 4x to 5x: This is the healthy B2B SaaS gold standard. It ensures that after paying the rep and their associated support costs (like marketing and product development), the company retains enough margin to reinvest in growth.
- Above 6x: While this looks fantastic on paper, it often means your sales team is severely under-capacity. Your reps are likely overworked, and you are leaving significant revenue on the table by not hiring more reps to capture market demand.
For a deeper look at how to model these costs, see the Rep Productivity Ratio: Formula & Benchmarks (2026).
Why Sales Productivity Has Declined Since 2019
If SaaS technology has advanced so rapidly over the last several years, why are fewer reps hitting quota now than in 2019?
The answer lies in three compounding factors:
- The Administrative Burden: Sales technology was supposed to make selling easier. Instead, it created an administrative nightmare. Reps must now update CRM fields, log notes across multiple tools, manually build outbound lists, and coordinate internal Slack threads. Today, reps spend 71% of their time on non-selling activities.
- Quota Inflation: During the hyper-growth era of 2020–2021, many companies raised massive venture rounds and set unrealistic growth targets. They inflated rep quotas to justify their valuations. When the market shifted toward capital efficiency, those inflated quotas remained, even though buying behaviors changed.
- Larger Buying Committees and Longer Cycles: The days of a single VP signing off on a $50K contract are gone. Today, the average B2B buying committee includes 6.3 to 13 stakeholders, and finance departments require strict ROI reviews for almost every purchase. The average enterprise sales cycle has stretched to 10.1 months, directly slowing down your team's Sales Velocity Glossary.
Actionable Workflows to Improve Sales Rep Output
To improve your team's ARR per rep, you cannot simply demand that they "sell harder." You must systematically remove friction from their daily routines so they can spend more time in live conversations with qualified buyers.

Here are four high-impact workflow changes you can implement immediately:
1. Recover Selling Time by Automating Admin
If your reps spend 71% of their day on admin, recovering just two hours of selling time per day per rep is equivalent to a 30% to 40% increase in sales capacity without hiring a single new employee.
- Action: Implement automated post-call note generation and CRM entry tools. Eliminate manual entry fields that do not directly impact forecast accuracy.
2. Shift to Signal-Based Account Prioritization
Reps waste hours cold-calling dead accounts. Instead, equip your team to prioritize accounts based on active buying signals (e.g., recent funding rounds, executive hires, or high-intent website visits).
- Action: Build automated alerts that route high-intent accounts directly to reps within a 72-hour decay window.
3. Enforce 3x Pipeline Coverage at the Rep Level
Reps often miss quota simply because they do not have enough active pipeline to account for standard win rates. A healthy SaaS win rate is around 20% to 30%. To hit a $600K quota, a rep must maintain at least $1.8M in active, qualified pipeline.
- Action: If a rep's pipeline coverage drops below 3x, temporarily shift their daily focus away from closing and toward outbound pipeline generation.
4. Invest in Pre-Call Preparation Quality
Reps who thoroughly research account history, stakeholder context, and industry pain points before a discovery call experience 23% higher close rates.
- Action: Provide your team with automated summaries of target accounts before their scheduled calls, so they do not have to spend 30 minutes manually scraping LinkedIn.
To see how these changes directly impact quota attainment, read our breakdown on Quota Attainment Improvement by Rep. You can also find additional tactical levers in Revenue Per Sales Rep: Benchmarks and How to Improve It — Gangly Blog.
Frequently Asked Questions about Sales Productivity
What is a good ARR per sales rep benchmark for a Series B SaaS company?
For a mid-market focused Series B company ($10M to $30M in ARR), a typical benchmark is $500K – $700K in ARR per sales rep. If your average rep is clearing more than $700K, your team is performing in the top quartile of the industry.
How does administrative burden impact sales rep quota attainment?
When reps spend 71% of their workweek on CRM entry, internal meetings, and manual prospecting, they are left with less than 12 hours per week for active selling. This time bottleneck makes it mathematically impossible for most reps to build and close enough pipeline to hit inflated quotas, resulting in the high quota miss rates we see today.
Should you include ramping reps in your productivity calculations?
No. Blending unramped reps into your overall average will artificially deflate your performance metrics. For accurate capacity planning and board reporting, you should calculate productivity using only fully ramped reps, or use Ramp-Adjusted Rep Months (RARM) to normalize the data.
Conclusion: Conversational, Governed Analytics with atSpark
Improving your ARR per sales rep requires clear, real-time visibility into your sales data. Unfortunately, most RevOps teams spend hours every week pulling messy CSVs from Salesforce, HubSpot, and Stripe, trying to manually calculate ramp times and pipeline coverage.
This is where atSpark changes the game.
atSpark is an AI-powered analytics platform designed specifically for SaaS companies. It unifies your billing, CRM, and subscription data into a single, reliable source of truth. Instead of waiting on engineering resources or writing complex SQL queries, your leadership team can ask plain-English questions like:
"What is our ARR per ramped sales rep by tenure cohort over the last four quarters?"
Within seconds, atSpark generates instant, accurate charts, tables, and insights. This gives you the precise data you need to set realistic quotas, design high-performing territories, and scale your sales team with confidence.
Ready to unlock instant sales productivity insights? Explore our ARR Glossary to align your team on core definitions, or visit atSpark's ARR definition page to see how we can help you build a highly efficient, data-driven revenue engine.