When the Number Tells You Nothing: The Case for Sales Variance Analysis
Sales variance analysis is the process of comparing your actual sales results to a planned benchmark — then breaking down why the gap exists.
Here's the quick answer if that's all you need:
What is sales variance analysis?
- Definition: A method of measuring the difference between actual sales performance and budgeted or planned sales, then decomposing that gap into its root causes
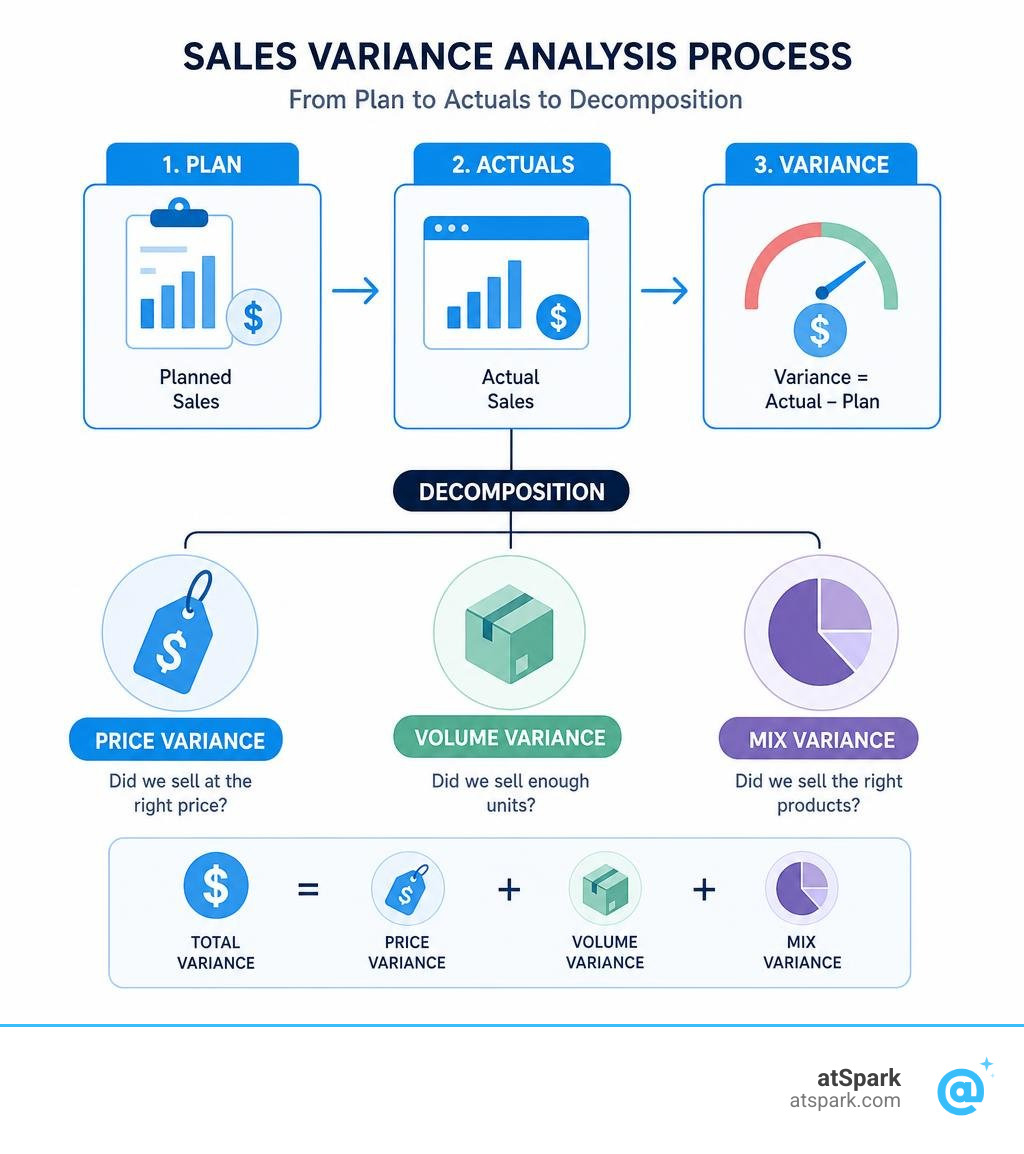
- Core components: Price variance (did you sell at the right price?), volume variance (did you sell enough units?), and mix variance (did you sell the right products?)
- Key formula: Variance = Actual − Plan. A positive revenue variance is favorable; a negative one is unfavorable
- Why it matters: A $2M revenue miss can mean completely different things — a pricing problem, a pipeline problem, or a product mix shift — and each requires a different fix
- Who uses it: FP&A teams, RevOps leads, CFOs, and sales leaders at companies of all sizes
Picture this: it's the end of the quarter. Your board deck shows revenue 8% below plan. Someone across the table asks, "Was it a pricing issue or a pipeline issue?" The number is right there on the screen — precise to the decimal — and yet it explains almost nothing about what actually happened or what your team should do next.
That is exactly the problem sales variance analysis solves.
Without it, a revenue miss is just a number. With it, that same miss becomes a story with a cause, a responsible party, and a clear next action. For finance and RevOps leads at fast-moving SaaS companies, the difference between those two outcomes is the difference between a reactive board conversation and a confident one.
And yet, most teams still stop at the headline gap. They see the miss, label it "unfavorable," and move on — skipping the decomposition that would actually tell them whether to fix their pricing, their pipeline, or their product mix.
This guide covers everything you need: the formulas, the frameworks, the common mistakes, and the tools that make the whole process faster.
What is Sales Variance Analysis and Why Does It Matter?
At its core, sales variance analysis is a diagnostic discipline. It is the bridge between what you planned to happen in your Sales Forecast and what actually happened in the market. By comparing your actual revenue to your baseline budget, you can evaluate whether your commercial strategy is working, where your execution is falling short, and how you need to adjust your Sales Pipeline management.
In corporate finance, any difference between actual performance and budget is labeled as either a favorable variance (when actual revenue is higher than planned, or actual costs are lower) or an unfavorable variance (when actual revenue falls short, or expenses run over).
But simply knowing that you have an unfavorable revenue variance is not enough. Consider this: a $2M revenue miss can point to very different issues, such as a volume shortfall versus pricing concessions, even when the headline gap is identical.
- If the miss was driven by selling fewer units than budgeted (an unfavorable volume variance), your issue lies in demand generation, pipeline coverage, or sales execution.
- If the miss was driven by discounting your product to hit those unit targets (an unfavorable price variance), your issue lies in your pricing strategy, competitive pressure, or a lack of sales enablement.
By embedding this decomposition into your standard budget variance analysis, you transition from backward-looking accounting to forward-looking operational strategy. This is the foundation of modern FP&A methodology: isolating the exact variables that drive performance so leadership can make data-backed decisions. To see how these foundations fit into a broader corporate framework, you can explore the Budget Variance Analysis Template: FP&A Methodology — Fairview.
The Core Components of Sales Variance
To perform a complete sales variance analysis, you must break down your total revenue gap into three distinct primary drivers: price, volume, and mix.

- Price Variance: This measures the financial impact of selling your products or services at prices different from your budgeted standard. It isolates the effect of pricing adjustments, discounts, and negotiations.
- Volume Variance: This measures the financial impact of selling a different quantity of units than originally planned, assuming your standard prices remain constant.
- Mix Variance: This measures the impact of selling a different proportion of products than budgeted. If you sell more low-margin products and fewer high-margin products, your mix variance will be unfavorable, even if your total unit volume matches your target.
To master how these three elements interact to dictate your bottom line, many analysts turn to structured courses like the Sales & Gross Profit Variance Analysis (Price, Mix, Volume) to build hands-on financial models.
It is also important to distinguish "sales price variance" from "purchasing price variance" (often just called price variance). While sales price variance tracks the impact of pricing on your revenue, purchasing price variance measures the difference between actual and standard unit costs for your expenses (such as raw materials or hosting costs).
How Sales Mix Variance Impacts Overall Profitability
Perhaps the most frequently overlooked component of revenue variance is the sales mix variance. It is entirely possible for a sales team to hit their total unit volume targets and top-line revenue goals, yet quietly erode overall gross margins and profitability.
This happens because different products within your portfolio carry different contribution margins. In SaaS, for example, your product lines might range from self-serve starter tiers to high-touch enterprise packages, each with varying operational costs. If customer demand shifts toward lower-margin, self-serve plans, your overall profitability can drop significantly.
By tracking detailed SaaS Business Metrics and defining clear SaaS KPI Examples, finance teams can pinpoint exactly how shifts in the product mix are impacting EBITDA, ensuring that the sales team is incentivized to sell the most profitable combinations of software and services.
How to Calculate Sales Price Variance and Sales Volume Variance
Calculating these variances requires structured formulas that isolate one variable at a time. The table below outlines the core formulas used by FP&A teams:
| Variance Type | Focus | Formula | What It Tells You |
|---|---|---|---|
| Sales Price Variance | Price changes | (Actual Price - Budgeted Price) x Actual Quantity Sold |
Did we maintain pricing discipline and avoid heavy discounting? |
| Sales Volume Variance | Quantity changes | (Actual Quantity Sold - Budgeted Quantity) x Budgeted Price |
Did we sell enough units to meet our baseline growth expectations? |
Calculating Sales Price Variance in Sales Variance Analysis
The sales price variance formula isolates the impact of pricing decisions by multiplying the difference in price by the actual quantity sold:
Sales Price Variance = (Actual Price - Standard Price) x Actual Quantity Sold
Let's look at a quick SaaS example. Suppose your standard subscription price for a mid-market tier is $100 per month, but due to end-of-quarter discounting, your actual realized price drops to $85 per month. If you sold 1,000 subscriptions, your calculation is:
($85 - $100) x 1,000 = -$15,000 (Unfavorable)
This tells us that discounting cost the business $15,000 in lost revenue. For subscription-based businesses, tracking this variance is critical for monitoring your Average Deal Size and ensuring that sales reps are not relying too heavily on price cuts to close deals.
Calculating Sales Volume Variance in Sales Variance Analysis
The sales volume variance formula isolates the impact of unit quantity by holding the budgeted price constant:
Sales Volume Variance = (Actual Quantity Sold - Budgeted Quantity) x Budgeted Price
Using the same SaaS business, let's assume you budgeted to sell 1,200 subscriptions at the standard price of $100, but you only sold 1,000:
(1,000 - 1,200) x $100 = -$20,000 (Unfavorable)
This tells you that the volume shortfall cost the business $20,000. When you combine this with your sales price variance, you can see the complete revenue picture.
Evaluating this variance helps sales leaders assess overall Quota Attainment across the sales team and determine whether the pipeline is generating enough qualified opportunities to support your volume targets.
Root Causes and Strategic Applications of Sales Variances
Identifying a variance is only the first step. The real value of sales variance analysis lies in diagnosing the root causes of those variances and translating them into strategic decisions.

Common root causes of sales variances include:
- Pricing Pressure: Competitors dropping their prices, forcing your sales team to offer aggressive discounts to protect win rates.
- Demand Shifts: Macroeconomic changes or industry trends that increase or decrease overall market interest in your product category.
- Competitive Dynamics: A competitor releasing a major feature update, causing your sales cycle to lengthen or your win rate to drop.
To dig deeper into these issues, revenue teams often combine variance analysis with a structured Win Loss Analysis. This helps determine whether an unfavorable price variance is an execution issue (reps discounting too quickly) or a product issue (customers refusing to pay full price because a competitor offers more value). For a deeper look at how leading revenue teams run this diagnostic process, check out Variance Analysis: How Revenue Teams Diagnose Missed Forecasts | Outreach.
Informing Pricing Strategy and Go-To-Market Execution
When properly executed, sales variance analysis acts as a guide for resource allocation and pricing strategy.
For example, if you consistently see a favorable price variance alongside an unfavorable volume variance, it suggests that your product may be underpriced but highly valued by a small niche. You might decide to adjust your go-to-market execution to target higher-value segments, accepting lower volume in exchange for premium pricing.
Conversely, if you are experiencing severe pricing pressure, analyzing your Sales Velocity and Sales Efficiency alongside your variances can help you decide whether to adjust your pricing tiers, bundle services, or shift resources toward more profitable customer segments.
Pitfalls to Avoid and the Broader Performance Story
While sales variance analysis is incredibly powerful, there are several common pitfalls that can lead teams to draw the wrong conclusions:

- Ignoring Mix Effects: Looking only at total revenue and total volume can mask a dangerous shift from high-margin to low-margin products.
- Comparing Against Stale Benchmarks: Comparing July 2026 actuals to a static budget created in late 2025 can produce misleading variances if market conditions have shifted dramatically.
- Analyzing at Too High a Level: Evaluating variances only at the global company level can hide severe underperformance in specific regions, product lines, or sales teams.
- Over-Analyzing Immaterial Variances: Wasting valuable analyst time investigating a $500 variance on a million-dollar line item.
To tell a complete performance story, sales variance must not be analyzed in isolation. It must be combined with cost variance and volume variance.
If your sales volume increases by 20%, your revenue variance will look highly favorable. However, if that volume increase required a 40% increase in customer acquisition costs (CAC) or cloud hosting infrastructure, your overall profit variance will be unfavorable.
To explore how these advanced marketing and costing variances interact to impact corporate performance, you can read the comprehensive guide on Advanced Sales and Marketing Variances.
Advanced Tools and Techniques for Modern Teams
Historically, performing a detailed sales variance analysis across thousands of SKUs, multiple currencies, and complex customer segments meant wrestling with massive, error-prone spreadsheets.
Today, modern finance teams leverage advanced tools and techniques to automate and enhance this process:
- Flexible Budgets: Unlike a static budget, a flexible budget automatically adjusts your expected revenues and costs based on the actual volume achieved. This isolates true operational efficiency from simple scale effects.
- Driver-Based Planning: Tying your financial models to operational drivers (like headcount, website traffic, or active users) so that your forecasts automatically update as real-world inputs change.
- AI-Powered Analysis: State-of-the-art analytical tools can now perform full variance analysis in minutes rather than hours, automatically calculating absolute and percentage variances, flagging key deviations, and identifying historical-trend explanations.
According to research published in the Journal of Revenue and Pricing Management, moving beyond basic accounting spreadsheets to integrated analytical platforms is one of the most effective ways to drive EBITDA growth. You can read the academic abstract at Sales variance analysis: how state-of-the-art analytical tools can contribute to increased profitability or access the full publisher's article at "Sales variance analysis: how state-of-the-art analytical tools can contribute to increased profitability" published in the Journal of Revenue and Pricing Management - Hinterhuber & Partners.
By adopting these modern tools, finance and revenue teams can achieve an 80% time cut on data aggregation for updating P&L actuals, save up to 12 hours per month on executive reporting, and build scenarios and forecasts up to 6 days faster.
Frequently Asked Questions about Sales Variance Analysis
What is the difference between static and flexible budget variance analysis?
A static budget remains completely unchanged, regardless of how your actual sales volume shifts during the period. It compares your actual results directly to your original plan.
A flexible budget adjusts your budgeted revenue and variable costs to reflect the actual volume of units sold. This allows you to isolate your true operational efficiency (like pricing power and cost control) from the financial impact of simply selling more or fewer units than planned.
How often should a revenue team run sales variance analysis?
Ideally, a revenue team should employ a tiered cadence:
- Weekly tracking: Monitor leading indicators like pipeline creation, deal velocity, and forecast movement to catch emerging issues early.
- Monthly close: Perform a full sales variance decomposition (price, volume, and mix) across teams, segments, and products to understand exactly why you hit or missed your numbers.
- Quarterly/Rolling forecast: Use your monthly variance insights to update your rolling forecast, adjusting your strategic assumptions to align with real-world market conditions.
What causes a favorable sales price variance?
A favorable sales price variance occurs when your actual realized selling price is higher than your budgeted standard price. This is typically driven by:
- Premium Pricing: Strong brand equity or a lack of competitor availability allowing you to charge a premium.
- Strong Demand: An unexpected surge in popularity or customer urgency that reduces the need for sales discounting.
- Pricing Discipline: Improved sales enablement and coaching that helps reps defend your product's value without relying on price cuts.
Conclusion
At the end of the day, a revenue number on a spreadsheet is just a symptom. To build a highly profitable, predictable business, you need to understand the underlying cause.
By implementing structured sales variance analysis, you move away from guessing why a quarter went well or poorly, and move toward a clear, mathematical understanding of your pricing power, pipeline execution, and product mix dynamics.
At atSpark, we believe that getting these answers shouldn't require complex SQL queries, data engineering pipelines, or hours of manual spreadsheet reconciliation. Our AI-powered conversational analytics platform unifies your billing, CRM, and subscription data in one secure place, letting you ask plain-English questions and get instant, governed insights.
Ready to turn your data into action? To see how easy it is to track, analyze, and optimize your revenue performance, explore our conversational analytics platform and build your next Sales Forecast with confidence.