Why Measuring Weighted Pipeline Campaign Impact Changes Everything for RevOps
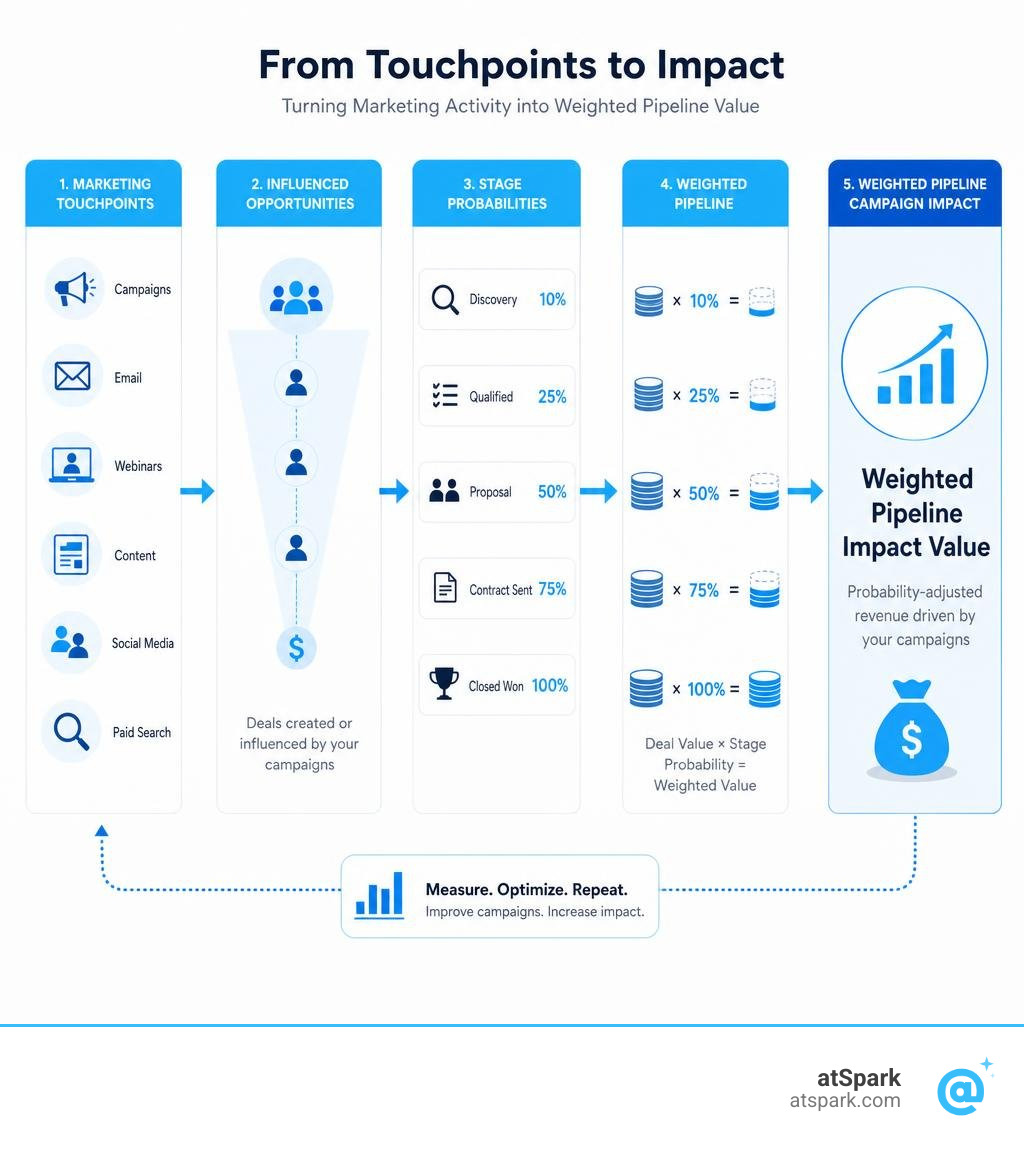
Weighted pipeline campaign impact is how much your marketing campaigns actually move the needle on probability-adjusted revenue — not just raw deal volume, but the real expected value those campaigns add to your forecast.
Here's the quick answer if you need it now:
How to measure weighted pipeline campaign impact:
- Assign stage probabilities to each open deal based on historical close rates (e.g., Discovery = 10%, Proposal = 50%, Contract Sent = 90%)
- Multiply each deal's value by its stage probability to get its weighted value
- Tag deals by campaign source so you can filter weighted pipeline by which campaign influenced each opportunity
- Compare influenced vs. non-influenced deals on weighted value, close rate, and cycle length
- Track changes over time to see which campaigns consistently lift weighted pipeline
Most revenue and finance leaders already know their total pipeline number. The problem is that number is almost always wrong — or at least wildly optimistic.
A $2M pipeline that's 80% stuck in early discovery stages isn't a $2M pipeline. It's closer to $300K when you adjust for close probability. And if you can't connect that adjusted number back to the campaigns that sourced or influenced those deals, you're flying blind on marketing ROI.
Best-in-class B2B teams keep forecast error below 10%. Most companies miss by 20–25%. That gap doesn't come from bad salespeople — it comes from measuring the wrong things.
That's what this guide is about: how to tie your marketing campaigns to weighted pipeline value, not just raw opportunity counts or unweighted dollar totals.
Demystifying the Weighted Sales Pipeline vs. Traditional Models
To understand why measuring weighted pipeline campaign impact matters, we first have to look at how traditional pipeline management sets teams up to fail.
An unweighted pipeline is simply the sum of the face value of every single open opportunity in your CRM. If your reps have ten deals in the pipe, each worth $50,000, your unweighted Sales Pipeline is $500,000.
But in reality, a deal that was created yesterday does not have the same chance of closing as a deal where the contract is sitting with the legal team. Treating them as equals in your forecasting is a recipe for missed targets.
This is where the weighted pipeline comes in. A weighted pipeline applies a specific win probability to each opportunity based on its position in the Sales Funnel. By multiplying the total deal value by this probability percentage, you calculate the "expected revenue."
| Metric | Traditional Unweighted Pipeline | Weighted Sales Pipeline |
|---|---|---|
| Core Definition | The raw sum of the total contract value of all open deals. | The probability-adjusted expected value of all open deals. |
| Calculation Method | Sum of (Deal Value) | Sum of (Deal Value × Win Probability %) |
| Treatment of Stages | Every deal is treated as 100% likely to close until marked closed-lost. | Deals are discounted based on their current progress in the funnel. |
| Main Use Case | Long-term demand planning and raw lead-generation tracking. | Near-term revenue forecasting and resource allocation. |
| Primary Weakness | Creates false confidence and leads to double-digit forecast errors. | Relies heavily on accurate, up-to-date probability percentages. |
By shifting your focus to a weighted pipeline, you get a realistic baseline of where your revenue is actually heading. For marketing teams, this is a game-changer. Instead of claiming credit for a massive, unweighted pipeline that may never close, you can prove how much expected, highly probable revenue your campaigns are driving.
Calculating the Math: Stage Probabilities and Weighted Pipeline Campaign Impact
Calculating your weighted pipeline value isn't rocket science, but it does require setting clear, data-backed boundaries for your pipeline stages.
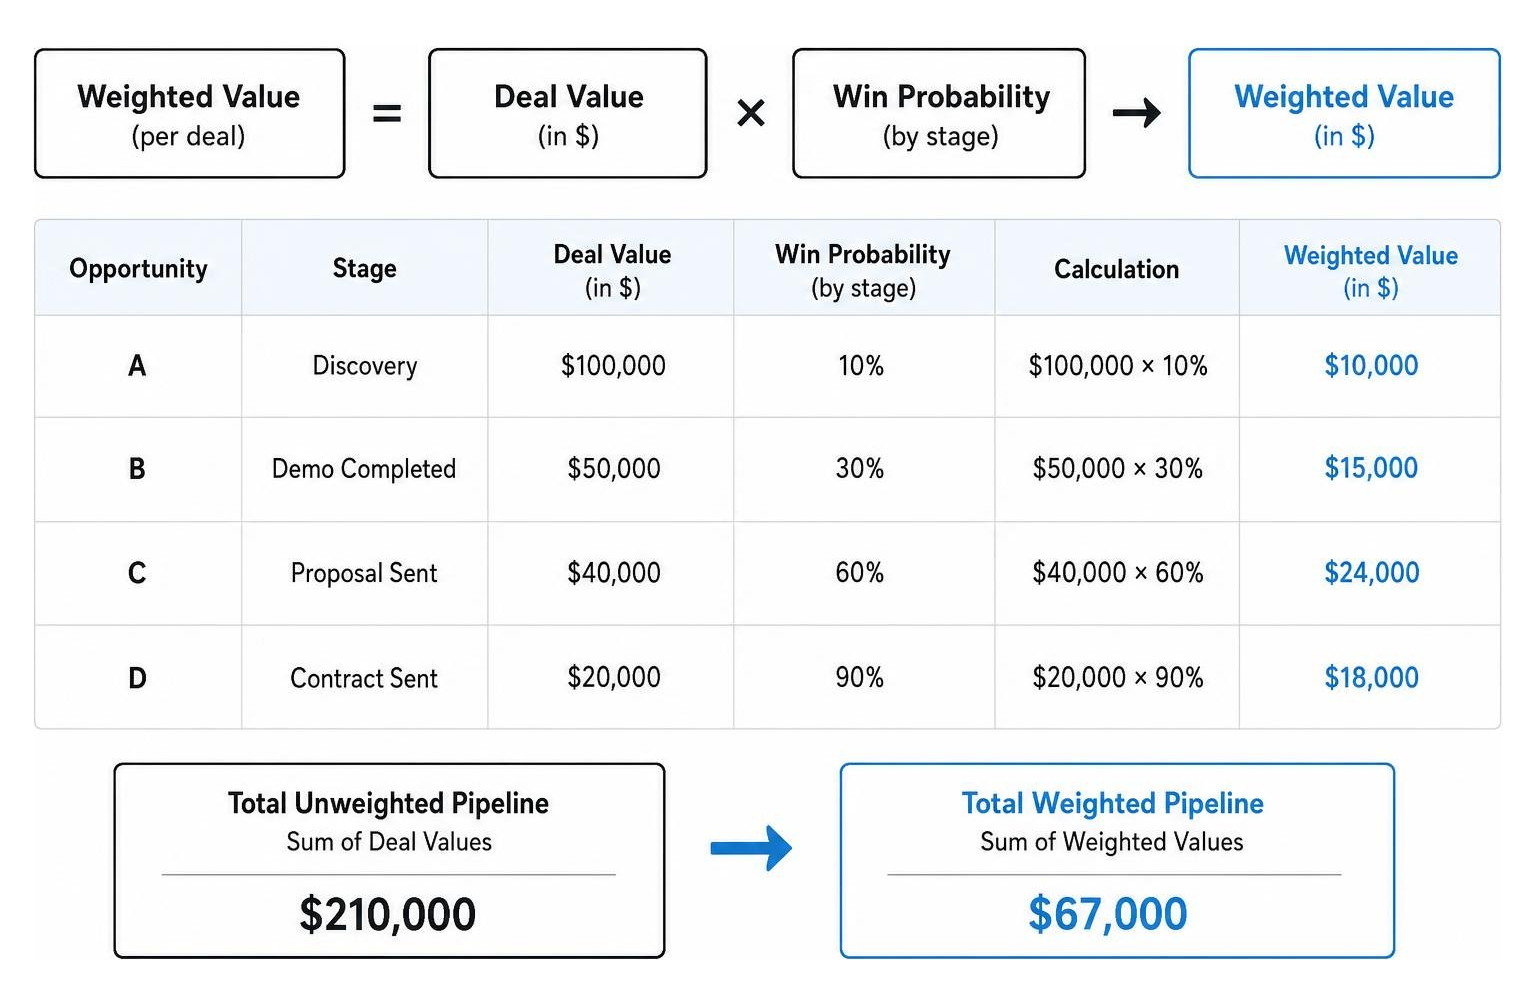
The standard formula to calculate the weighted value of a single deal is:
$$\text{Weighted Value} = \text{Deal Value} \times \text{Close Probability}$$
To calculate your total weighted pipeline, you simply add up the weighted values of every open opportunity. For instance, let's look at how this plays out in a typical B2B sales cycle:
- Opportunity A: A $100,000 deal in the Discovery stage with a 10% Deal Win Probability. Its weighted value is $10,000.
- Opportunity B: A $50,000 deal in the Demo Completed stage with a 30% probability. Its weighted value is $15,000.
- Opportunity C: A $40,000 deal in the Proposal Sent stage with a 60% probability. Its weighted value is $24,000.
- Opportunity D: A $20,000 deal in the Contract Sent stage with a 90% probability. Its weighted value is $18,000.
While your unweighted pipeline total for these four deals looks like a healthy $210,000, your true weighted pipeline is actually $67,000.
Now, how does this math help us measure weighted pipeline campaign impact?
When we tag these opportunities with the marketing campaigns that influenced them, we can see exactly where our marketing dollars are working. If a high-cost enterprise campaign is sourcing plenty of $100,000 deals, but they consistently stall in the early stages (retaining a low 10% probability), that campaign's weighted pipeline contribution is minimal.
Conversely, if a targeted retargeting campaign influences mid-funnel deals and helps accelerate them to the Proposal stage (boosting their probability to 60%), that campaign is generating a massive weighted impact.
For a deeper dive into setting up these formulas, check out this guide on Weighted Pipeline Definition: Formula & How to Use It.
Why Traditional Weighted Pipelines Break: The Flaws of Static Forecasting
If the math behind a weighted pipeline is so logical, why do so many sales and marketing leaders still find their forecasts unreliable?
The truth is that traditional weighted pipelines often break because they rely on static, outdated, or highly subjective inputs.

Here is why static pipeline weighting models fail:
- Subjective Rep Bias: Sales reps are naturally optimistic. Without strict criteria, they may push a deal to a later stage just because they had a "great call," artificially inflating the Sales Forecast.
- The "Waterlogging" Effect: This occurs when stagnant, dead deals are left to rot in mid-funnel stages instead of being cleaned out. If a $100,000 deal has been sitting in the "Proposal Sent" stage (60% probability) for nine months, it is still contributing $60,000 of "expected" ARR or MRR to your forecast, even though the prospect has ghosted you.
- Ignoring Close Dates: A deal can have a 90% probability of closing, but if the close date keeps slipping month after month, it will constantly throw off your monthly or quarterly targets.
- Small vs. Large Team Discrepancies: Large enterprises with hundreds of deals can rely on static weighted pipelines because statistical variations average out over a high volume of transactions. However, smaller regional sales teams or agencies with only a handful of high-value deals cannot. If a small team has one massive deal worth 50% of their pipeline, a static probability model will completely distort their forecast if that single deal slips.
To prevent these breakdowns, modern revenue operations teams are moving away from static "set-it-and-forget-it" percentages. They are adopting dynamic, evidence-based frameworks to keep their data clean and their predictions accurate.
Beyond the Guesswork: Modern Alternatives and Calibration Strategies
To make your pipeline forecasting reliable, you must move from subjective guessing to objective, data-driven calibration.
The first step is to continuously clean up your CRM data. This means setting maximum time thresholds for each stage. If a deal exceeds the average sales cycle length for a specific stage without any logged activity, it should be flagged as "stale" and its probability automatically reduced.
Secondly, instead of using round numbers like 20%, 50%, or 80% based on gut feel, you should look at your historical conversion data. Pull the last 12 months of closed opportunities from your CRM and calculate the exact percentage of deals that successfully progressed from each stage to "Closed-Won."
Here is a list of best practices for pipeline calibration:
- Quarterly Recalibration: Recalibrate your stage probabilities at least once a quarter to account for changes in market conditions, sales team tenure, or product pricing.
- Enforce Strict Exit Criteria: Do not let reps move a deal to the next stage until specific, verifiable actions have occurred (e.g., a signed mutual action plan or a confirmed budget conversation).
- Track Deal Velocity: Monitor how quickly deals move between stages. A deal that rushes through the funnel has a much higher win probability than one that lingers.
Enhancing Weighted Pipeline Campaign Impact with Qualification Frameworks
One of the most effective ways to remove subjectivity from your pipeline is to overlay a standardized sales qualification framework like MEDDIC, BANT, or SPIN Selling onto your CRM stages.
Instead of assigning a win probability simply because a deal has reached a certain Deal Stage, you assign probability based on concrete qualification milestones. For example, under a MEDDIC framework, you might require answers to specific questions before the deal's win probability can increase:
- Have we identified the Economic Buyer?
- Are the Decision Criteria clearly documented?
- Is the Decision Process mapped out?
By tying win probabilities to these verifiable milestones, you create an evidence-based forecasting model. This ensures that when marketing campaigns drive pipeline, the quality of those opportunities is rigorously tested before they are counted as expected revenue.
Calibrating Data to Maximize Weighted Pipeline Campaign Impact
To ensure your campaigns are truly driving revenue, you must also look at your Pipeline Coverage ratio.
While the traditional rule of thumb says B2B teams need a flat 3x pipeline coverage to hit their targets, this blanket approach is outdated. Healthy B2B teams often need 3–4x coverage in mid-market motions, but may require 5x or higher in complex enterprise environments where sales cycles are longer and deal sizes are larger.
By comparing your weighted pipeline coverage against your historical win rates, you can spot coverage gaps months before they impact your revenue. If you notice your weighted pipeline coverage is dropping, you can proactively launch targeted marketing campaigns to fill the top of the funnel before your sales team runs out of qualified opportunities.
Connecting Marketing Campaigns to Weighted Pipeline Attribution
Once your sales pipeline is calibrated and your CRM data is clean, you can finally solve the ultimate marketing puzzle: accurate attribution.
Standard attribution models are often too rigid for modern B2B buyer journeys. Single-touch models, like First-Touch or Last-Touch, give 100% of the credit to a single interaction. This completely ignores the reality of long, multi-stakeholder sales cycles where a buyer might engage with dozens of marketing touchpoints over several months.

To solve this, high-performing teams use weighted attribution models. These models distribute credit across multiple touchpoints throughout the buyer's journey. For example, a Position-Based model might allocate 40% of the credit to the first touchpoint, 40% to the lead creation touchpoint, and distribute the remaining 20% among the middle touches.
By mapping these weighted attribution models to your weighted pipeline, you can measure the true weighted pipeline campaign impact.
To learn how to set this up within your CRM, read this deep dive on Creating a Salesforce Campaign Influence Model That Actually Reflects Your Impact.
For a broader understanding of how to distribute conversion credit across your channels, explore this Weighted Attribution Models: Complete Guide for 2026.
Additionally, as B2B buying groups expand to include 6–10 stakeholders, measuring at the individual lead level is no longer enough. Modern teams are tracking "influenced pipeline" at the account level. This approach records every marketing interaction across an entire target company before an opportunity is created. This gives leadership a clear view of marketing's presence and familiarity within key accounts, serving as a powerful momentum indicator for long enterprise cycles.
To understand why this metric is taking over in 2026, check out Influenced Pipeline: The B2B KPI That Matters in 2026.
Frequently Asked Questions about Weighted Pipeline Forecasting
How does a weighted pipeline differ from forecast categories?
While both tools help predict revenue, they serve different purposes. A weighted pipeline uses calculated, stage-based probabilities to discount every open deal automatically.
Forecast categories (such as Commit, Best Case, and Pipeline), on the other hand, rely on the qualitative judgment of the sales rep or manager. A rep might have a deal in the "Proposal" stage (which has a 50% weighted probability), but because they have a strong relationship with the buyer, they may manually place that deal in the "Commit" category for the month.
How often should stage probabilities be updated?
We recommend conducting a formal calibration of your stage probabilities at least once a quarter. This involves analyzing the previous 6–12 months of sales data to see if your actual conversion rates match your assigned stage percentages. If you launch a new product, shift your pricing, or enter a new market, you should review these probabilities sooner, as these shifts can quickly alter your historical conversion patterns.
What is a healthy pipeline coverage ratio?
A healthy coverage ratio depends entirely on your average win rate and sales cycle length. If your team historically wins 25% of open deals, you will need a 4x pipeline coverage ratio to hit your quota.
However, if you are measuring your weighted pipeline coverage, a healthy ratio is typically 1x. This is because your weighted pipeline already factors in your win probabilities. If your weighted pipeline matches or exceeds your revenue quota for the period, you are statistically on track to hit your targets.
Conclusion
Measuring your weighted pipeline campaign impact is the only way to bridge the gap between marketing activities and real, predictable business revenue. When you move away from unweighted vanity metrics and static CRM assumptions, you gain the clarity needed to make smarter budget decisions, align your sales and marketing teams, and hit your revenue targets with confidence.
However, pulling this data together can be a nightmare. Traditional setups require hours of manual spreadsheet work, complex SQL queries, and constant maintenance to keep your billing, CRM, and subscription data in sync.
That is where we come in. atSpark is an AI-powered analytics platform built specifically for SaaS companies. We unify your billing, CRM, and subscription data into a single, reliable source of truth. Instead of waiting on engineering help or wrestling with complex dashboards, atSpark lets you ask plain-English questions—like "What was the weighted pipeline impact of our Q1 LinkedIn campaigns?"—and get instant, beautiful charts, tables, and insights.
Ready to experience conversational, governed analytics without the SQL headache? Explore our guide on the Weighted Pipeline to see how we help revenue teams build a predictable growth engine.