Why Your Team Needs a Weekly Sales Activity Report
A weekly sales activity report is a structured snapshot of what your sales team did and what it produced over the past seven days — covering outreach, pipeline movement, deals closed, and revenue generated.
If you just need the quick answer:
What goes in a weekly sales activity report?
- Outreach metrics — cold calls made, follow-up calls, emails sent
- Pipeline metrics — new deals created, meetings booked, proposals sent
- Conversion metrics — lead-to-opportunity rate, deals won, deals lost
- Revenue metrics — actual revenue vs. target, weekly variance
- Context — lost deal reasons, notable order changes, rep-level notes
Here's the reality most RevOps and finance leads know well: it's Friday afternoon, and someone needs to know how the week went. The answer is buried across a CRM, three spreadsheets, and a Slack thread.
That scramble has a real cost. 37% of people spend at least three hours a week building reports manually. For a finance or RevOps lead, that's three hours not spent on forecasting, analysis, or fixing actual revenue problems.
And the stakes are rising. With 44% of salespeople reporting longer buying cycles and 44% seeing less responsiveness from buyers, you can't afford to find out a pipeline is leaking at the end of the month. You need to catch it mid-week.
That's exactly what a well-built weekly sales activity report does.
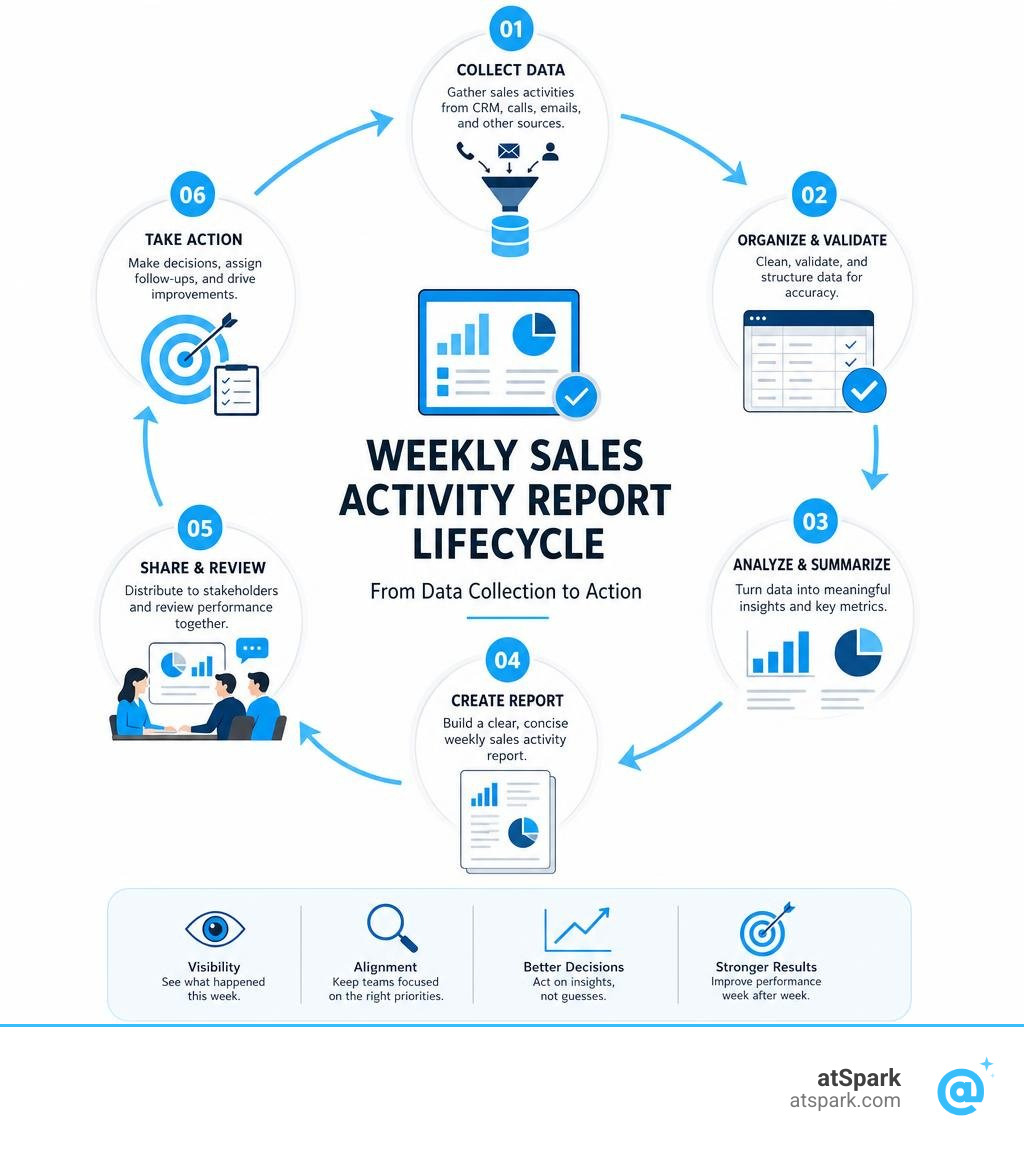
What is a Weekly Sales Report and Why Does Your Workflow Need It?
A weekly sales report displays an organization's weekly sales performance, evaluating the success of ongoing sales strategies and identifying areas for improvement. Unlike daily reports, which shine a spotlight on rapid-fire activities, or monthly reports, which look at big-picture strategic analysis, weekly reports act as the tactical bridge. They allow managers to uncover trends and make course adjustments without micromanaging their reps.
In today's fast-moving sales environment, incorporating these reports into your workflow is no longer optional. According to HubSpot's guide on weekly reporting, having a standardized cadenced review keeps the most pertinent data front and center. This is crucial because about half of all companies report on sales at least once a week, making sales the most frequently reported operation in modern business.
When you make weekly reporting part of your routine, you build transparency and accountability across the board. It ensures that:
- The sales team and the company goals align: Everyone knows if they are on track to hit monthly or quarterly targets.
- Reps have a benchmark: New or struggling reps can see exactly where top performers spend their time and how they manage their opportunities.
- Sales and marketing stay connected: 85% of sales and marketing leaders believe that aligning the two departments is their most significant opportunity for improving business performance. Weekly data helps track lead quality and attribution sources in real time.
Key Metrics to Track in Your Weekly Reports
A great report balances leading indicators (the work reps put in) with lagging indicators (the results that work produces). If you only track results, you won't know why a rep missed their goal. If you only track activities, you might reward "busywork" that doesn't generate revenue.

Essential Metrics for Your Weekly Sales Activity Report
To understand the health of your top-of-funnel operations, you need to track core sales activity metrics. These represent the sheer volume of outbound and follow-up effort:
- Outreach Volume: Total cold calls made, follow-up calls, and emails sent.
- Completed Activities per User: A side-by-side comparison of individual representative contributions.
- New sales pipeline Generation: The number of new deals added and their estimated pipeline value.
- Scheduled Calls and Meetings: The number of initial meetings arranged. However, meeting counts can become a vanity metric if they don't progress. Track the conversion rate of first meetings to follow-up meetings to ensure quality.
- Lead Response Time: How long it takes for a rep to follow up with an inbound lead. There is a direct, proven correlation between fast reply times and secured purchases.
Revenue and Forecasting Metrics
To satisfy executives and finance teams, your report must also track bottom-of-funnel outcomes:
- Closed-Won Deals: The number of wins and the actual revenue collected.
- sales forecast Accuracy: How close your current weekly trajectory is to your monthly projections.
- quota attainment Progress: Where each rep stands relative to their monthly or quarterly targets. (Only 60% of sales reps meet their sales targets on average, making early visibility critical).
- Revenue Variance: The daily or weekly difference between target revenue and actual revenue.
- sales velocity: How fast deals are moving through your funnel to a closed status.
How to Structure and Format Your Weekly Reports
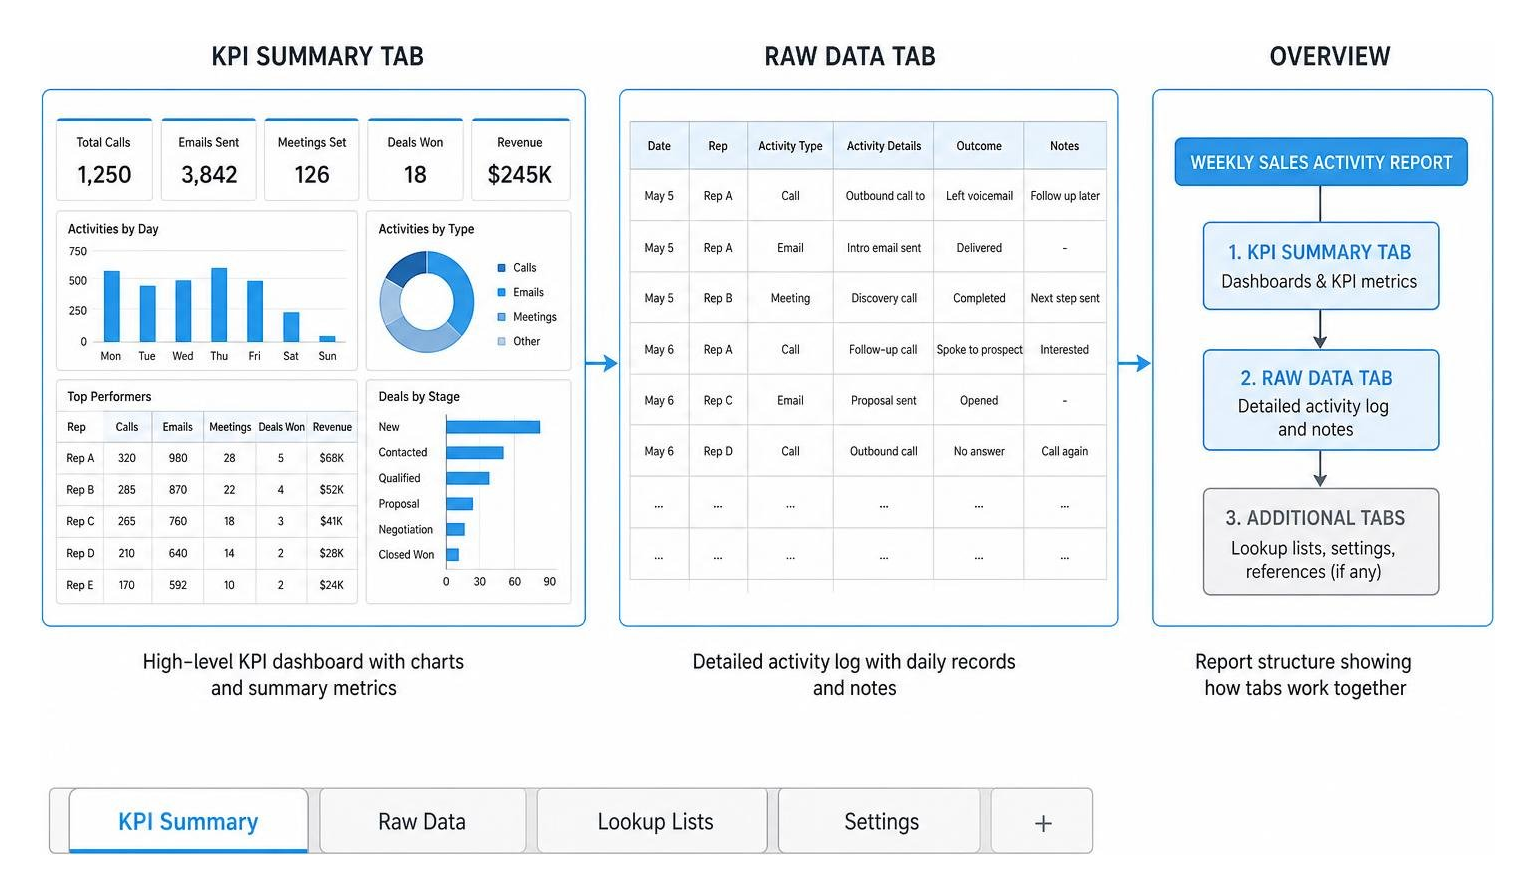
An effective weekly sales report should be structured so that anyone can read it and understand the team's health in under two minutes. We recommend structuring your report using three distinct layers:
- The Executive Summary / Dashboard: A highly visual tab or section containing charts, graphs, and high-level KPI cards (e.g., Total Revenue, Total Deals Won, and Variance against Target).
- The KPI Summary: A section breaking down individual rep contributions, product-level performance, and regional sales distribution.
- The Raw Data Log: The background spreadsheet or database tab where daily activities, deal stage transitions, and qualitative notes are recorded.
Choosing the Right Weekly Sales Activity Report Template
Depending on your team's size, industry, and existing tech stack, you may want to use a pre-formatted template to kickstart your reporting. Here are a few excellent, free options to consider:
- Process Workflows: If you want to treat your weekly report as an interactive, step-by-step checklist with built-in manager approvals, try the Process Street's workflow template.
- Document-Based Reports: For a traditional, printable, day-by-day activity ledger that tracks cold calls, follow-up calls, and daily revenue variances, check out Scribd's activity report document.
- Editable Online Templates: If you need a quick, highly customizable online layout that integrates product performance tables with marketing campaign metrics, use Template.net's editable report.
These templates can easily be customized to fit specific industry niches. For example, a retail report might focus heavily on product-level revenue and returned inventory, a restaurant template will break down food and beverage charges by payment type, and a hotel template will prioritize occupancy data and traveler segments.
How to Build a Weekly Sales Activity Report: Manual vs. Automated vs. AI
As your sales operations mature, the way you build and distribute your weekly sales activity report should evolve. Let's look at how manual, automated, and AI-driven methods stack up against each other.
| Feature | Manual Spreadsheets | Automated CRM Workflows | AI-Driven Conversational Analytics |
|---|---|---|---|
| Setup Effort | Low (minutes) | Medium (hours of API mapping) | Low (instant connection) |
| Weekly Time Spent | High (3+ hours/week) | Low (automated delivery) | Zero (on-demand or automated) |
| Data Accuracy | Low (prone to human entry errors) | Medium (limited to CRM inputs) | High (cross-references CRM & Billing) |
| Data Silos | Highly siloed | Siloed to CRM | Fully unified (Billing, CRM, Subscriptions) |
| User Interface | Complex formulas | Static charts & dashboards | Plain-English questions & instant charts |
The Manual Spreadsheet Scramble
The manual route is where most growing teams start. On Friday afternoon, reps or managers manually export CSVs from their CRM, copy and paste rows into Excel or Google Sheets, write SUMIF formulas, and attempt to build charts.
While spreadsheets are highly flexible and require no software budget, they are the primary cause of "version chaos" and reporting blockers. More than half of professionals surveyed state that the sheer amount of time it takes to manually build reports acts as a major barrier to actually using them.
Automated CRM Workflows
To move away from manual entry, many teams set up native CRM reporting dashboards or use no-code platforms like Zapier or Make to push deal updates directly into a spreadsheet.
If you want to automate the compilation of rep-level metrics, you can use specialized workflow blueprints. For example, you can use Super's weekly sales activity workflow or Slite's weekly sales activity workflow to automatically pull CRM actions and deliver a formatted digest directly to your team's Slack channels or email inboxes every Monday morning. While this solves the manual data entry problem, it is still limited to what is logged in your CRM, often missing billing, invoicing, and subscription data.
AI-Driven Conversational Analytics
The cutting edge of sales operations lies in AI-driven analytics. Instead of spending hours mapping APIs or writing SQL queries to connect your HubSpot or Salesforce data with your Stripe or billing database, modern platforms do the heavy lifting for you.
With atSpark, we have built an AI-powered analytics platform designed specifically for SaaS companies. atSpark unifies your billing, CRM, and subscription data into a single, governed source of truth. Instead of navigating complex reporting builders or waiting on engineering help, managers and executives can simply ask plain-English questions—like "What was our sales velocity by rep this week compared to last week?"—and get instant, presentation-ready charts and tables.
Additionally, AI-driven reporting can perform automated quality assurance, scanning your weekly data to flag anomalies (like a sudden drop in outbound activity or a major deal status discrepancy) before they turn into end-of-quarter surprises.
How Managers Use Weekly Reports to Coach Reps and Prevent Pipeline Leaks
A weekly report shouldn't just be an administrative receipt of what happened; it should be a diagnostic coaching tool. By analyzing weekly trends, managers can identify process bottlenecks and intervene before they damage the team's quarterly performance.
For instance, by looking at individual contributions side-by-side, a manager might notice a rep who has incredibly high outbound call volume but zero scheduled meetings. This is a clear indicator that the rep doesn't need to work harder—they need coaching on their actual cold-calling pitch.
Weekly reports are also vital for tracking your sales cycle length and preventing pipeline leaks. By including a "Lost Deal Reasons" section in your weekly review, you can quickly categorize why prospects are dropping out of your funnel.
If you notice a sudden spike in deals lost due to "slow response time," you have identified an addressable internal leak. If deals are consistently lost at the same funnel stage, it's a clear signal to refine your lead qualification criteria or adjust your team's messaging.
Sharing Weekly Sales Data Without Overwhelming Your Team
It is incredibly easy to drown your sales team in data. When reports are too long or packed with dozens of irrelevant metrics, reps experience "dashboard fatigue" and stop looking at them altogether.
To prevent this, follow these three best practices:
- Stick to the facts that move the needle: Limit the active KPIs on your shared team dashboard to 5 or 6 critical metrics.
- Use highly visual formats: Present your data using clean bar charts, pie charts, and trend lines rather than massive, text-heavy tables.
- Translate data into actionable steps: Don't just share the numbers; provide context. If outreach numbers are down, explain why (e.g., "Outreach was 15% lower this week due to the regional holiday, so we are shifting our focus to automated email sequences next week").
Frequently Asked Questions about Weekly Sales Reporting
How do you prevent weekly sales reports from becoming too long?
Keep your weekly reports concise by focusing strictly on progress toward your core monthly or quarterly goals. Use visual dashboards with high-level KPI cards for quick reading, and relegate the granular, daily activity logs to a separate background tab.
What is the difference between a daily, weekly, and monthly sales report?
- Daily reports are highly tactical and spotlight immediate rep activity (e.g., calls made today, emails sent today).
- Weekly reports identify short-term trends, pipeline health, and process bottlenecks, allowing managers to make tactical adjustments.
- Monthly reports provide big-picture strategic analysis, evaluating long-term business growth, regional targeting, and overall sales forecast accuracy.
How can we track both sales activities and deal stages in one report?
The most effective way is to build a custom cross-object report within your CRM or reporting tool that links "Activities" (emails, calls) with "Deals." If you are using spreadsheets, structure your document with a dedicated "Raw Data" tab that logs daily rep outreach alongside a "Pipeline Progression" table showing deal stage movements.
Conclusion
A structured, consistent weekly sales activity report is one of the most powerful tools a sales organization can implement. It bridges the gap between daily hustle and monthly strategy, keeping your team aligned, accountable, and proactive in a challenging market.
But you don't have to spend your Friday afternoons scrambling through spreadsheets or fighting with complex CRM report builders.
With atSpark, you can bypass the manual headache entirely. Our AI-powered analytics platform unifies your billing, CRM, and subscription data, allowing you to monitor your team's sales activity and pipeline health using simple, conversational queries. No SQL, no engineering delays—just instant, accurate insights when you need them most.
Ready to make your sales reporting effortless? Learn how atSpark can transform your team's workflow today.