Why Sales Activity Metrics Make or Break Your Revenue Engine
Sales activity metrics are the quantifiable measures of what your reps actually do every day — calls made, emails sent, meetings booked, follow-ups completed, and more. They sit at the foundation of your revenue engine, telling you whether effort is being directed at the right targets, at the right pace, and with enough quality to move deals forward.
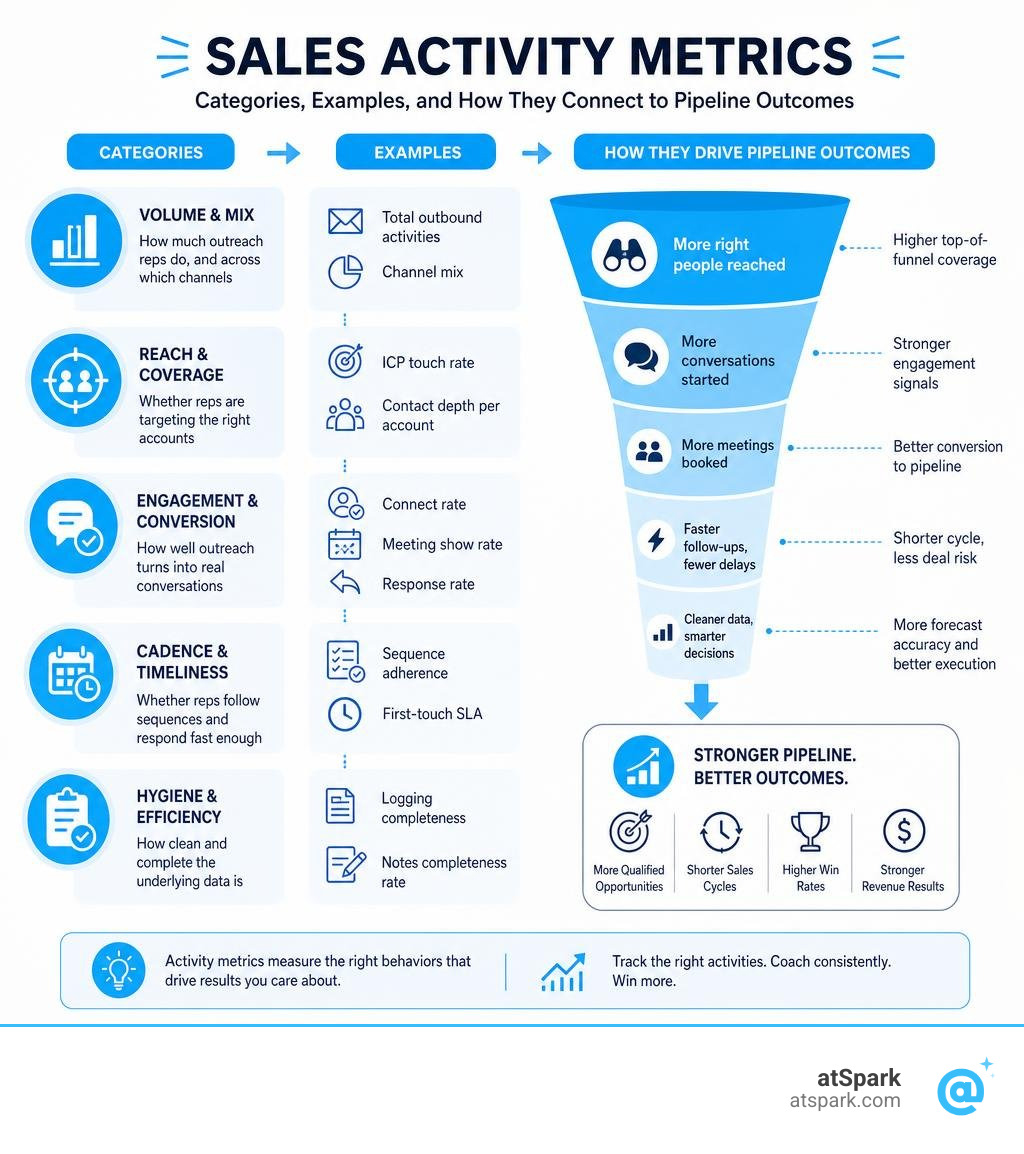
Quick answer: Here's what sales activity metrics cover at a glance:
| Category | What It Measures | Examples |
|---|---|---|
| Volume & Mix | How much outreach reps do, and across which channels | Total outbound activities, channel mix |
| Reach & Coverage | Whether reps are targeting the right accounts | ICP touch rate, contact depth per account |
| Engagement & Conversion | How well outreach turns into real conversations | Connect rate, response rate, meeting show rate |
| Cadence & Timeliness | Whether reps follow sequences and respond fast enough | Sequence adherence, first-touch SLA |
| Hygiene & Efficiency | How clean and complete the underlying data is | Logging completeness, notes completeness rate |
Here's the problem most revenue and ops teams run into: the numbers look fine on the surface, but quota attainment keeps slipping. In 2025, 78% of sellers missed quota, and only 35% of quota-carrying reps were expected to hit their number. Win rates fell 18% year over year. Sales cycles stretched 38% longer than in 2021.
Yet reps aren't slacking. The real issue is that only about 40% of the average sales workweek is spent actually selling. The rest disappears into admin, manual data entry, and context-switching between tools.
Activity metrics are where you start to untangle this. They act as a behavioral mirror — reflecting whether your team is putting effort in the right places before a bad quarter is already baked in. Unlike pipeline or revenue metrics, which tell you what happened, activity metrics tell you what's happening right now, while there's still time to course-correct.
This guide walks you through how to use them without drowning in dashboards or accidentally optimizing for the wrong things.
What Are Sales Activity Metrics and Why Do They Matter?

At their core, sales activity metrics measure the everyday operational execution of your sales team. They are the tactical inputs—the dials, the personalized emails, the LinkedIn connections, the discovery calls, and the follow-up notes.
In a modern go-to-market motion, these metrics matter because they provide the earliest warning system available. If you only look at closed revenue, you are looking at history. If you look at your Sales Pipeline, you are looking at the present. But when you track Sales Activity, you are looking directly into the future.
When a team's revenue drops, it is rarely a surprise. It is almost always the lagging result of an activity slump or a drop-off in outreach quality that occurred 60 to 90 days prior. By monitoring activity metrics, revenue leaders can spot these trends early and step in with targeted coaching before the pipeline dries up.
Why Sales Activity Metrics Are Your Behavioral Mirror
Think of activity metrics as a behavioral mirror for your sales team. If a representative is struggling to build pipeline, the mirror will show you exactly why. Are they simply not making enough attempts (a volume problem)? Are they relying entirely on cold emails while ignoring the phone (a channel mix problem)? Or are they making 100 calls a week but converting zero percent of them into meetings (a messaging or targeting problem)?
This diagnostic capability is crucial for protecting Sales Efficiency. Reps spend only 40% of their average workweek actually selling. The remaining 60% is eaten up by administrative burdens, manual data entry, and tool fatigue. If we do not use activity metrics to mirror behavioral patterns, we risk letting our reps spend their limited selling hours running in the wrong direction.
How Activity Metrics Differ from Pipeline and Performance Metrics
To build a balanced measurement framework, it helps to separate your data into three distinct layers:
- Activity Metrics (Inputs): Highly controllable, day-to-day actions (e.g., emails sent, calls made, meetings held).
- Pipeline Metrics (Process): How those activities translate into deal progression (e.g., pipeline value, stage conversion, Deal Age).
- Performance Metrics (Outcomes): The ultimate business results (e.g., Win Rate, Quota Attainment, closed-won revenue).
While a sales manager cannot directly order a prospect to sign a contract, they can work with a rep to improve their daily outbound volume or refine their call connect rate. Activity metrics are the levers that turn the gears of the pipeline, which ultimately produces the revenue.
For a deeper dive into how these layers interact, check out our guide on 12 Sales Metrics & KPIs That Actually Matter in 2026 | Claap and Sales KPIs Every Manager Should Track in 2026 | MakeTheBoard .
The 5 Core Categories of Sales Activity Metrics
To prevent your dashboards from turning into a chaotic wall of numbers, we recommend organizing your metrics into five core categories. This structured approach helps you quickly pinpoint where a representative or campaign is falling short.

| Category | Primary KPI | Why It Matters |
|---|---|---|
| Volume and Mix | Total Outbound Activities / Channel Mix % | Ensures baseline effort and healthy multi-channel execution. |
| Reach and Coverage | Target-Account Coverage / ICP Touch Rate | Guarantees reps are focusing on high-value, qualified accounts. |
| Engagement and Conversion | Call Connect Rate / Positive-Response Rate | Measures the quality of the messaging and rep skill level. |
| Cadence and Timeliness | First-Touch SLA / Sequence Adherence | Protects lead conversion rates through speed and consistency. |
| Hygiene and Efficiency | Activity Logging Completeness % | Protects data integrity and ensures accurate downstream reporting. |
Volume and Mix
Volume is the baseline. If your team is not putting in the raw effort, no amount of conversion optimization will save your pipeline. However, raw volume is a blunt instrument. You must also track the channel mix — the percentage distribution of outreach across phone, email, LinkedIn, and other touchpoints.
A healthy channel mix is intentional, not equal. If your ideal buyers rarely check LinkedIn but live on their phones, a channel mix heavily weighted toward social selling is a recipe for missed quotas.
Additionally, you should track the multithread rate — the percentage of target accounts where your reps are engaging two or more stakeholders. In modern enterprise sales, single-threaded deals are highly vulnerable. Engaging multiple contacts early acts as deal insurance, reducing the risk of an opportunity stalling if your primary champion leaves the company.
Reach and Coverage
It is entirely possible for a representative to hit their daily activity targets while booking zero meetings if they are reaching out to the wrong people. Reach and coverage metrics ensure your team's energy is directed at high-potential accounts.
- Target-Account Coverage: The percentage of your assigned target accounts that have received at least one meaningful touchpoint within a specific period.
- ICP Touch Rate: The percentage of total outreach directed at contacts who perfectly match your Ideal Customer Profile.
- Contact Depth: The average number of unique contacts engaged per account. In enterprise segments, reps often need to engage 5 to 9 contacts to effectively influence the buying committee.
By tracking these, you can ensure your team is building healthy Pipeline Coverage within the accounts that are actually most likely to buy. For more metrics on account engagement, you can reference the Salesloft Metrics Glossary .
Engagement and Conversion
This category measures how effectively your team's activities spark real conversations. High volume with low engagement indicates a messaging, targeting, or channel problem.
- Call Connect Rate: The percentage of outbound dials that result in a live conversation lasting at least 60 seconds (a healthy benchmark is typically 10-12%).
- Response Rate: The percentage of sent emails or messages that receive a reply.
- Positive-Response Rate: The percentage of replies that express genuine interest or request a next step, rather than a flat "not interested" or "unsubscribe." Tracking this separately prevents vanity response rates from masking a poor campaign.
- Meeting Show Rate: The percentage of scheduled meetings where the prospect actually attends. If your show rate is below 75%, reps may be booking unqualified meetings just to hit their activity targets.
By monitoring these conversion gates, you can identify exactly where prospects are falling out of your Sales Funnel.
Cadence and Timeliness
Speed and consistency are the lifeblood of modern prospecting. Cadence and timeliness metrics track how well reps adhere to structured outreach plays.
- Sequence Adherence: The percentage of tasks completed in alignment with your defined sales playbooks and sequences.
- First-Touch SLA (Service Level Agreement): The median time it takes for a representative to reach out to an inbound Marketing Qualified Lead (MQL). Speed-to-lead is critical: leads contacted within 5 minutes convert up to 9x higher than those contacted after 30 minutes. Yet, the average B2B response time still exceeds 29 hours.
- Post-Meeting Follow-Up SLA: The percentage of held meetings where a recap and next-steps email is logged within 24 hours.
Tracking these metrics helps you maintain a high Sales Velocity and ensures no warm leads slip through the cracks.
Hygiene and Efficiency
If your activity data is incomplete, all your downstream reporting, forecasting, and coaching will be based on guesswork.
- Activity Logging Completeness: The percentage of customer-facing activities (calls, emails, meetings) that are actually logged in your CRM.
- Notes Completeness Rate: The percentage of logged meetings that contain structured notes, next steps, and defined outcomes.
- Valid-Contact Yield: The percentage of sourced contacts that have accurate, working phone numbers and email addresses.
To learn more about tracking these operational metrics, explore the framework detailed in 22 Sales Activity Metrics to Track and Improve Performance .
Leading vs. Lagging Indicators: Balancing Your Dashboard
A common mistake in sales management is building a dashboard that focuses entirely on lagging indicators. Lagging indicators, like closed-won revenue or quarterly Quota Attainment, are great for reporting to the board, but they are useless for day-to-day management because they show results after they have already occurred.
To drive predictable revenue, you must balance your dashboard with leading indicators. Leading indicators are predictive; they show you where your pipeline is heading and give you time to intervene.

High-performing sales organizations maintain a healthy balance—typically around 60% leading indicators and 40% lagging indicators on their operational dashboards. This allows managers to build a reliable Sales Forecast based on real-time activity trends and a Weighted Pipeline rather than gut feeling.
Setting Role-Specific Benchmarks and Targets
Benchmarks should never be one-size-fits-all. They must be tailored to the specific role, market segment, and deal complexity.
- Sales Development Representatives (SDRs): Focus heavily on top-of-funnel volume, reach, and early conversion. A typical daily target might include 50-60 activities (across calls, emails, and social), aiming for 15-20 qualified conversations per week.
- Account Executives (AEs): Focus on late-stage activity, relationship depth, and progression. AE activity targets should focus on external meetings held, post-meeting follow-up SLAs, and multithreading rates within active opportunities.
Because an enterprise Sales Cycle Length can stretch to 6.5 months or longer, AE activity metrics are crucial for ensuring deals are continuously moving forward, even when the Average Deal Size is large and closing dates are far out.
For a comprehensive breakdown of VP-level dashboard metrics, check out The VP Sales Dashboard: 14 Metrics That Drive Results — Fairview .
Turning Raw Activity Data into Actionable Coaching
Data is only valuable if it leads to action. Unfortunately, 46% of reps rarely receive feedback on their sales conversations, and 47% do not get enough role-play opportunities before jumping on customer calls.
Using activity metrics as a diagnostic tool allows you to move away from generic "make more calls" coaching and instead deliver precise, behavioral feedback.
If a representative's numbers show:
- High Dials but Low Connect Rates: They might be calling at the wrong times of day, or targeting outdated contact lists.
- High Connect Rates but Low Meeting Conversion: Their opening pitch or objection-handling needs work. This is a perfect opportunity for call coaching and role-play.
- High Meetings Booked but Low Show Rates: They may be pushing unqualified prospects into scheduling a call just to hit a quota.
- High Meetings Held but Low Opportunity Creation: They need coaching on discovery and identifying pain points during the initial call.
By pairing quantitative activity metrics with qualitative Win-Loss Analysis, you can build a highly effective coaching program that targets the exact bottleneck for each representative.
How to Avoid the Pitfalls of Vanity Sales Activity Metrics
The fastest way to ruin a sales culture is to micromanage reps on vanity activity metrics. If you tell your team that the only thing that matters is making 100 dials a day, they will make 100 dials. But they will call dead numbers, rush prospects off the phone, and log junk data just to hit the target.
This is the activity volume trap. High activity without strategic targeting or quality conversations simply accelerates the wrong motion. In fact, research shows that underperforming sales teams often log more weekly activities than top performers, but their effort is scattered across unqualified accounts.
To avoid this, always pair a volume metric with a quality or conversion metric. Do not just track "calls made"; track "meetings booked per 100 calls." Do not just track "emails sent"; track "positive-response rate." This keeps the focus on output and conversion rather than empty activity.
Furthermore, ignoring early activity metrics often leads to deal slippage — where opportunities continuously slide from one Deal Stage to the next without closing. By tracking real engagement, you can keep your pipeline clean and realistic.
Establishing a Structured Review Cadence
To keep your team aligned and proactive, establish a regular cadence for reviewing activity and pipeline metrics:
- Daily Standups (Operational): A quick, 15-minute check-in to review yesterday's activity outputs, celebrate quick wins, and unblock any immediate hurdles.
- Weekly Pipeline Reviews (Tactical): Focus on deal progression, sequence adherence, and near-term pipeline additions. This is where managers help reps adjust their tactics for active deals.
- Monthly Strategic Reviews (Strategic): Step back to analyze broader trends, such as win rates by segment, average sales cycle length, and Deal Win Probability. Use this time to adjust team-wide benchmarks and target account lists.
Frequently Asked Questions about Sales Activity Metrics
How many sales activity metrics should our team track?
Avoid metric overload. A dashboard with 30 different metrics is just noise. We recommend tracking 5 to 7 core KPIs for daily and weekly operations. Start small, master those metrics, and only expand your tracking as your sales processes and data hygiene mature.
What is a healthy email response rate versus call connect rate?
While benchmarks vary by industry and target persona, a healthy B2B email response rate typically sits around 12-15% (with a positive-response rate of 25-30% of those replies). A standard outbound call connect rate generally averages 10-12% under normal conditions.
How do we ensure reps actually log their activities in the CRM?
The best way to improve CRM hygiene is to remove the manual burden. Reps shouldn't have to spend hours typing out call logs or copying emails. Implement automated activity capture tools that sync emails, calendar events, and calls directly to your CRM. When manual entry is required, keep it simple by using mandatory, single-click dropdown fields for deal outcomes and next steps.
Unify Your Sales and Revenue Analytics with atSpark
Tracking sales activity metrics is essential, but it gets incredibly frustrating when your activity data lives in your CRM, your billing data sits in Stripe, and your product usage data is locked in a database. To get a true, complete picture of your revenue engine, you have to find a way to tie all of these pieces together.
That is where atSpark comes in.
atSpark is an AI-powered analytics platform built specifically for SaaS companies. We unify your billing, CRM, and subscription data into a single, trusted source of truth.
Instead of waiting weeks for a data analyst to write complex SQL queries or build custom dashboards, atSpark lets you ask plain-English questions like:
- "What is our win rate for mid-market accounts that had more than 3 touches in the first week?"
- "Show me a chart of meetings held versus pipeline generated by rep this quarter."
- "Which outbound campaigns have the highest positive-response rate for SaaS companies with over $10M ARR?"
You get instant charts, tables, and actionable insights without needing any engineering help. It is governed, conversational analytics designed to help revenue teams make faster, smarter decisions.
Ready to see how atSpark can transform your sales activity data into predictable growth?