Why the ARPU Growth Rate Formula Belongs in Every RevOps Playbook
The arpu growth rate formula is one of the clearest signals of whether your monetization strategy is actually working — or just coasting on user volume.
Here's the quick answer if you need it right now:
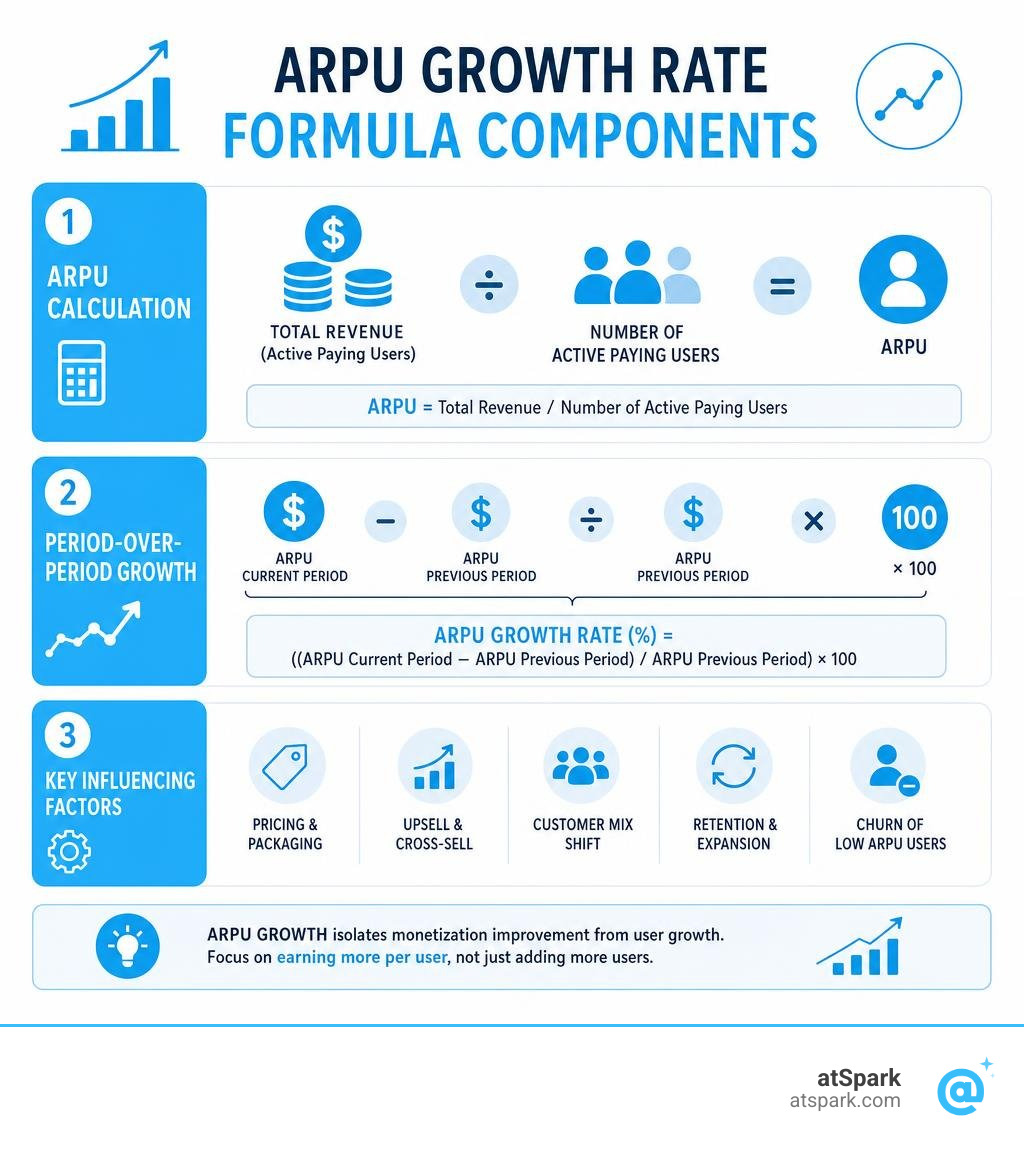
ARPU Growth Rate (%) = ((ARPU Current Period − ARPU Previous Period) / ARPU Previous Period) × 100
And ARPU itself is calculated as:
ARPU = Total Revenue / Number of Active Paying Users
Quick example:
- Last month ARPU: $80
- This month ARPU: $86
- Growth rate: (($86 − $80) / $80) × 100 = 7.5% ARPU growth
Most RevOps and finance leads already track total revenue and MRR. But those numbers can be deceiving. Revenue can grow simply because you added more users — not because you're earning more per user. ARPU growth isolates the monetization signal from the volume signal.
That distinction matters a lot. A 1% increase in ARPU can translate to a 3.3% increase in overall SaaS revenue. And high-ARPU customers churn at rates roughly 25% lower than low-ARPU customers.
In other words: ARPU isn't just a vanity metric. It's a leading indicator of revenue quality.
The challenge is that most teams either calculate it inconsistently, include users they shouldn't (like free trial accounts), or look at a single blended number that hides what's really going on across segments and pricing tiers.
This guide walks you through exactly how to calculate ARPU growth rate, how to decompose what's driving it, and how to use it alongside LTV, churn, and NRR to make smarter decisions — without waiting on a data team.
What is the ARPU Growth Rate Formula and How is it Calculated?
To understand how fast your average revenue per user is expanding, you must first master the baseline ARPU calculation. At its core, Average Revenue Per User measures the average amount of money generated from a single customer over a specified timeframe (usually monthly or annually).
The basic formula for ARPU is:
ARPU = Total Revenue over Period / Active Paying Users in Same Period
Once you have calculated your ARPU for two consecutive periods, you can apply the arpu growth rate formula to find the percentage change:
ARPU Growth Rate (%) = ((Current Period ARPU - Previous Period ARPU) / Previous Period ARPU) * 100
For instance, if your SaaS company had an ARPU of $120 in Q1 of 2026 and managed to push that to $135 in Q2 of 2026, your calculation looks like this:
- Subtract previous ARPU from current ARPU: $135 - $120 = $15
- Divide the difference by the previous ARPU: $15 / $120 = 0.125
- Multiply by 100 to get the percentage: 0.125 * 100 = 12.5%
This means your ARPU grew by 12.5% quarter-over-quarter. To ensure you are gathering the correct inputs and setting up your initial numbers properly, you can read our comprehensive ARPU calculation: how to calculate ARPU .
How to Apply the ARPU Growth Rate Formula Step-by-Step
Calculating your ARPU growth rate systematically prevents data discrepancies and helps you make reliable strategic decisions. Here is the step-by-step process we recommend:
- Determine Your Timeframe: Choose whether you are measuring month-over-month (MoM), quarter-over-quarter (QoQ), or year-over-year (YoY) growth. Monthly tracking is ideal for operational updates, while quarterly and annual reviews are standard for board presentations.
- Calculate Your Monthly Recurring Revenue (MRR): Sum up all recurring revenue generated from your paying customers. If you have hybrid pricing models (base subscription plus usage fees), normalize usage fees to the monthly billed amount. You can quickly calculate this using our MRR Calculator.
- Count Your Active Paying Users: Only include accounts that actually paid money during that period. Never include free trials, freemium users, or inactive accounts, as this will artificially deflate your ARPU.
- Compute Current and Historical ARPU: Divide your MRR by your active paying users. If you want a quick, automated way to run these numbers, use the ARPU Calculator (2026) - Average Revenue Per User | FoundStep | FoundStep .
- Apply the Growth Rate Formula: Plug your current and historical ARPU numbers into the growth formula to find your exact growth percentage.
Decomposing Revenue Growth with the ARPU Growth Rate Formula
Revenue growth is rarely simple. If your monthly revenue increases from $100,000 to $130,000, that growth is driven by a combination of two forces: acquiring more users (the user effect) and making more money from each user (the ARPU effect).
To understand the exact drivers of your revenue expansion without guessing, you should use revenue decomposition. The core identity of revenue growth is:
Change in Revenue = (Change in Users * Previous ARPU) + (Change in ARPU * Previous Users) + (Change in Users * Change in ARPU)
This formula breaks down your growth into three distinct components:
- The User Effect: Growth generated purely by acquiring new active users at your previous average price point.
- The ARPU Effect: Growth generated by increasing the average spend of your existing customer base (through pricing changes, upsells, or cross-sells).
- The Interaction Term: The portion of growth created when both your user base and your ARPU change simultaneously.
Decomposing your revenue prevents you from misinterpreting causality. For example, if your ARPU rises but your user growth slows down dramatically, a decomposition analysis will show you whether your pricing changes are actually driving healthy expansion or risking customer churn. For a deep dive into this methodology, check out the ARPU growth decomposition guide: ARPU vs users breakdown .
ARPU vs. ARPA: Key Differences and When to Use Each
When analyzing your subscription business, you will frequently see two acronyms used side-by-side: ARPU (Average Revenue Per User) and ARPA (Average Revenue Per Account). While they sound similar, they serve different strategic purposes.
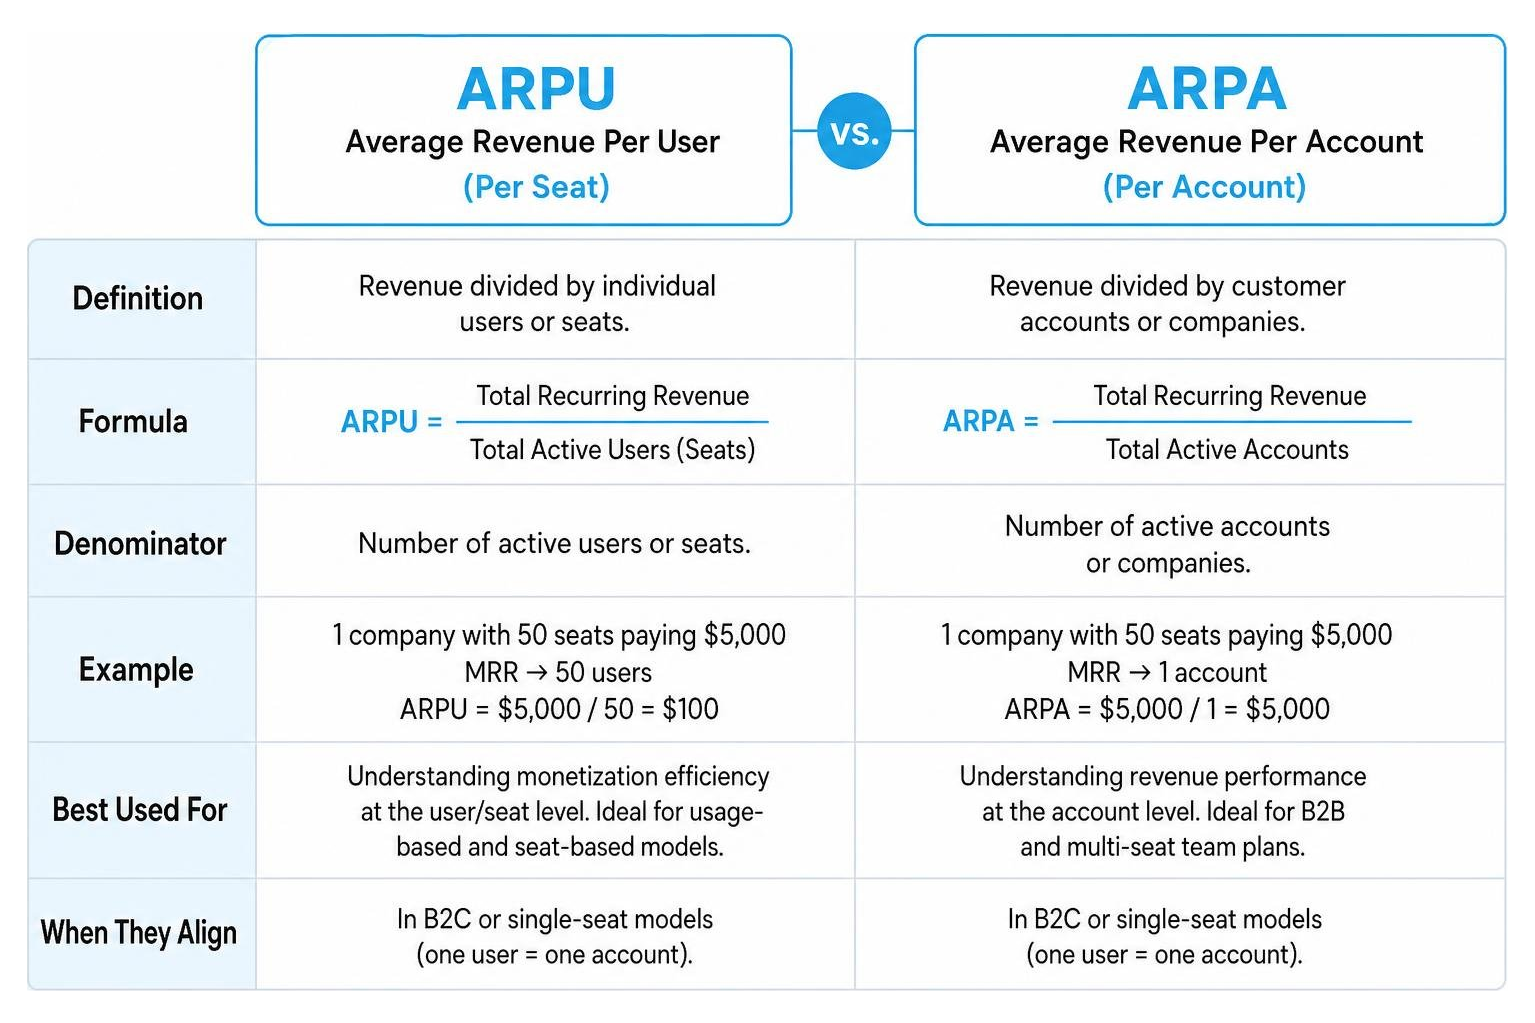
The primary difference lies in the denominator:
- ARPU divides revenue by individual users or seats. If a single corporate client buys 50 seats on your platform, ARPU treats that as 50 individual users.
- ARPA divides revenue by client accounts or companies. That same corporate client buying 50 seats is treated as one single account.
For B2C subscription models (like streaming services or consumer mobile apps), ARPU and ARPA are often identical because one user equals one account. However, for B2B SaaS companies with multi-seat team plans, these metrics diverge significantly.
If you want to evaluate your product-market fit, track user-level engagement, and benchmark seat-based pricing, ARPU is the metric to watch. If you want to analyze customer acquisition costs, contract values, and corporate account expansion, ARPA is much more meaningful. To see how these fit into your broader SaaS dashboard, explore our guide on SaaS Business Metrics.
Here is a quick comparison table to help you decide when to use each:
| Metric | Denominator | Best For | Typical Use Case |
|---|---|---|---|
| ARPU | Individual active paying users or seats | Benchmark engagement, seat-based pricing analysis, B2C consumer apps | Evaluating how much value an individual user gets from your platform |
| ARPA | Active corporate accounts or companies | B2B enterprise sales, tracking CAC payback, account-level expansion | Evaluating corporate contract sizes and account health |
Key Factors Influencing ARPU Growth and How to Optimize Them
Improving your ARPU growth rate is one of the most efficient ways to scale. While acquiring new customers is expensive, expanding revenue from your existing customer base costs significantly less. To effectively optimize this metric, you must focus on the primary levers that influence it: pricing models, upsells, cross-sells, and retention. For a complete look at how these elements work together, review our checklist of SaaS Metrics to Track.
Pricing Strategies and Tiered Packaging
Your pricing model is the most direct lever for influencing ARPU. If you are charging a single flat rate for your software, your ARPU will remain flat regardless of how much value your customers get.
To drive consistent ARPU growth, consider transitioning to tiered packaging or value-based pricing. This structure allows you to segment your product into different levels (e.g., Basic, Pro, and Enterprise) based on feature sets, usage limits, or seat counts. As your customers grow and require more advanced features, they will naturally migrate to higher tiers, raising your average revenue per user.
When planning pricing changes, it is incredibly helpful to run scenario analyses. You can plug your current pricing, user volume, and target benchmarks into the ARPU Calculator – Average Revenue Per User for SaaS & Subscription Businesses | CalcMastery to see how different pricing adjustments will impact your bottom line.
Upselling, Cross-Selling, and Expansion MRR
Expansion revenue is the secret weapon of high-growth SaaS companies. It refers to any additional revenue generated from your existing customers beyond their initial subscription price. This is primarily achieved through:
- Upselling: Encouraging customers to upgrade to a premium tier or purchase more user seats.
- Cross-Selling: Selling complementary products, add-on features, or integrations that enhance the core product.
This additional spend directly fuels your Expansion MRR. When your sales and customer success teams focus on consultative selling—identifying your customers' evolving needs and recommending the right add-ons—your expansion revenue will naturally outpace your Contraction MRR (revenue lost from downgrades). This dynamic ensures your ARPU growth rate trends upward month after month.
Connecting ARPU to Churn, LTV, and Other SaaS Metrics
Your subscription metrics do not exist in a vacuum. They are part of an interconnected financial ecosystem where a change in one metric triggers a ripple effect across all others.
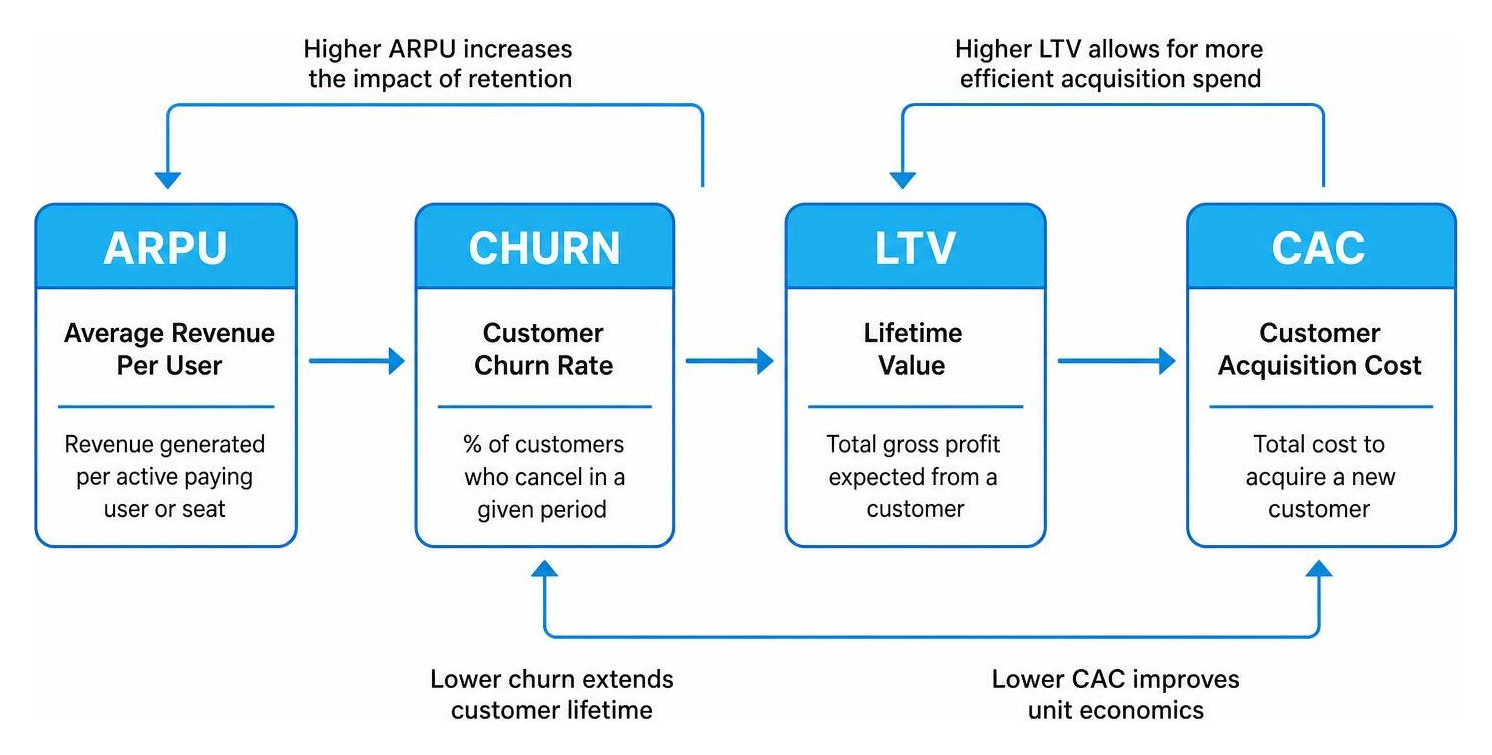
Understanding how ARPU connects to unit economics like customer churn, lifetime value, and customer acquisition costs is essential for building a sustainable business. You can read more about how these pieces fit together in our overview of Important SaaS Metrics.
The Relationship Between ARPU and Customer Lifetime Value (LTV)
Customer Lifetime Value (LTV) estimates the total gross profit your business expects to generate from a single customer over their entire relationship with you. ARPU is the foundational building block of this metric.
The standard formula to approximate LTV is:
LTV = (ARPU * Gross Margin (%)) / Churn Rate
Because ARPU sits in the numerator of the LTV formula, any increase in your ARPU growth rate directly multiplies your customer lifetime value. For example, if your ARPU is $100, your gross margin is 80%, and your monthly churn rate is 2%, your LTV is $4,000. If you successfully grow your ARPU to $120 through upselling, your LTV instantly jumps to $4,800—without needing to lower your churn rate or cut operational costs.
Furthermore, historical data reveals that high-ARPU customers are correlated with 25% lower churn rates compared to lower-paying accounts. When customers invest more in your platform, they tend to adopt it more deeply, making them far less likely to churn.
How ARPU Interacts with MRR, ARR, and NRR
To evaluate your company's trajectory, you must understand how ARPU interacts with your recurring revenue metrics:
- MRR and ARR: Your MRR (Monthly Recurring Revenue) is simply your ARPU multiplied by your total number of paying customers. Consequently, your ARR (Annual Recurring Revenue) is your MRR multiplied by 12. If your ARPU is growing, your Net New MRR will increase even during months when customer acquisition is slow.
- Net Revenue Retention (NRR): NRR measures your ability to retain and expand revenue from your existing customer base. Since ARPU growth is driven by upgrades and add-on purchases, a positive ARPU growth rate is the primary engine behind a healthy NRR (ideally above 100%).
Advanced ARPU Segmentation and Common Pitfalls to Avoid
Relying on a single, company-wide blended ARPU can be incredibly misleading. It can easily mask underlying issues, such as a high-churn rate among your smaller accounts or a dangerous over-reliance on a few enterprise clients.
To find actionable insights, you must segment your data. You can model different customer tiers and test scenarios using the professional Arpu Calculator: SaaS operating metrics | BizToolkitPro .
Segmenting ARPU for Deeper Insights
To uncover what is truly driving your monetization, try segmenting your ARPU by:
- Pricing Tiers: Calculate ARPU separately for your Starter, Professional, and Enterprise plans. This helps you identify if your middle tier is priced too low or if your enterprise tier is driving the majority of your revenue.
- Acquisition Channels: Compare the ARPU of customers acquired through organic search versus paid advertising or outbound sales. For instance, you might find that organic search leads have a 30% higher ARPU than paid leads, indicating you should shift your marketing budget toward SEO.
- Geography: Analyze ARPU across different countries or regions. This can highlight where localized pricing strategies are working or where you might be underpricing your product relative to local purchasing power.
- Cohorts: Track the ARPU of customer groups based on their sign-up date. If your 2026 cohorts have a higher starting ARPU than your 2025 cohorts, your onboarding and initial packages are becoming more effective.
Common Mistakes in ARPU Calculation and Interpretation
Even experienced finance teams can fall into common traps when calculating ARPU. Here are the most frequent mistakes to watch out for:
- Including Free or Trial Users: This is the most common pitfall. Including non-paying users in your denominator inflates your customer count and artificially deflates your ARPU, giving you a distorted view of your revenue health. Always calculate ARPU using paying-customers-only.
- Using Gross Billing Instead of Net Revenue: Ensure you are using net revenue (subtracting refunds, discounts, and chargebacks) rather than gross billing to keep your data clean and accurate.
- Ignoring Mid-Period Volume Fluctuations: If you experience high customer growth or churn in the middle of a month, using only the ending customer count can distort your ARPU. Instead, use the average of your beginning and ending customer counts for that period.
- Failing to Separate Tiers: Blending self-serve and enterprise customers into a single average obscures the unit economics of both. Track them separately to make informed product and marketing decisions.
If you want an easy way to verify your calculations and ensure your inputs are clean, try using the ARPU Monthly Revenue Per User Formula Calculator - ToolcR to quickly double-check your monthly numbers.
Frequently Asked Questions about ARPU Growth
What is a good ARPU benchmark for SaaS companies?
There is no single "perfect" ARPU benchmark because it depends heavily on your target market and company stage. However, typical SaaS benchmarks range from $50 to $500 per month.
For bootstrapped, early-stage startups targeting SMBs, an ARPU of $20 to $100 is common. For mid-market and enterprise-focused SaaS companies, a solid ARPU typically ranges from $500 to $5,000+ per month. To put this in perspective, consumer-facing subscription services operate on a completely different scale—Spotify, for example, reported an ARPU of €4.62 in 2024. The key is ensuring your ARPU supports healthy unit economics, meaning your LTV comfortably exceeds your Customer Acquisition Cost (CAC).
Can ARPU increase while total revenue decreases?
Yes, absolutely. This scenario usually occurs when a business experiences high churn among its low-value, lower-paying customers while successfully retaining its high-value, premium customers.
For example, if you lose 1,000 users who were paying $5 a month, but retain 100 users paying $100 a month, your total user base shrinks significantly, and your total revenue might drop slightly. However, because your remaining user base is made up of higher-paying customers, your ARPU will actually go up. While losing revenue is never ideal, a rising ARPU in this context indicates that you are successfully aligning your product with high-value segments.
How often should a business calculate and track ARPU?
We recommend tracking ARPU on a monthly operational cadence. This allows your product, sales, and customer success teams to monitor the immediate impact of pricing adjustments, new feature releases, and upsell campaigns. For high-level strategic reviews, investor reporting, and board meetings, analyzing ARPU on a quarterly and annual basis provides a clearer, less noisy view of your long-term growth trends.
Conclusion

Mastering the arpu growth rate formula is a critical step for any subscription business looking to build a highly efficient, sustainable revenue engine. By shifting your focus from pure user acquisition to maximizing the value you deliver—and capture—from every single customer, you unlock a highly profitable path to scale.
But keeping your billing, CRM, and subscription data clean enough to run these calculations in real-time is often easier said than done. That is where we can help.
atSpark is an AI-powered analytics platform designed specifically for SaaS companies. We unify your billing, CRM, and subscription data into a single source of truth, allowing your team to ask plain-English questions and get instant charts, tables, and metrics. With atSpark, you get conversational, governed analytics without needing to write complex SQL queries or wait on engineering resources.
Want to see how your monetization metrics stack up? Optimize your monetization with atSpark's ARPU Guide and discover how easy it is to turn your subscription data into actionable growth strategies.