Why the Annual Recurring Revenue Formula Is the Number Every SaaS Leader Needs
The annual recurring revenue formula is the foundation of financial clarity for any subscription-based business. Before anything else, here's the quick answer:
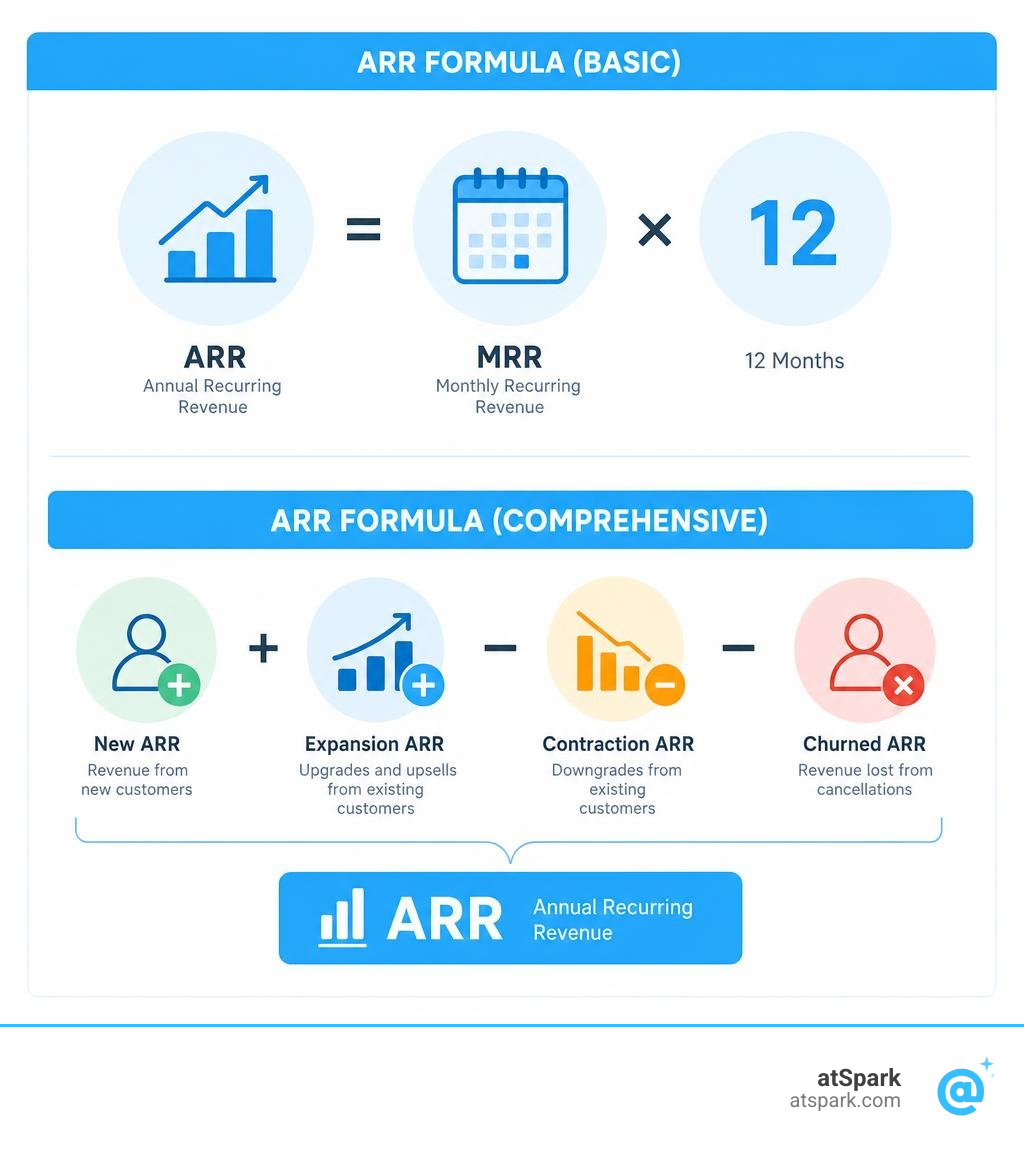
The ARR Formula (Basic):
ARR = Monthly Recurring Revenue (MRR) × 12
The ARR Formula (Comprehensive):
ARR = New ARR + Expansion ARR − Contraction ARR − Churned ARR
Quick reference:
| Input | What it means |
|---|---|
| New ARR | Revenue from newly signed customers |
| Expansion ARR | Upgrades and upsells from existing customers |
| Contraction ARR | Downgrades from existing customers |
| Churned ARR | Revenue lost from cancellations |
| One-time fees | Excluded — not recurring |
If you run revenue or operations at a SaaS company, you've probably felt this: someone asks for the ARR number, and suddenly there's a debate about what's actually in it. Are multi-year contracts counted at full value? Do setup fees count? What about that customer who downgraded last month?
You're not alone. Research suggests 2 out of 5 SaaS companies are including or excluding something they shouldn't be in their ARR calculations. That's not a minor bookkeeping issue — it distorts forecasts, misleads investors, and makes it impossible to trust your own growth story.
ARR is not a GAAP metric. But it's the number investors ask for first, the metric your board tracks quarter over quarter, and the clearest signal of whether your subscription business is actually growing.
This guide walks you through exactly how to calculate it — correctly, every time.
What is ARR and Why Does It Matter?
Annual Recurring Revenue (ARR) is the annualized value of all predictable, recurring revenue generated from active subscription agreements. Essentially, it normalizes your recurring contracts over a 12-month period. If a customer signs a three-year contract worth $150,000, that contract represents $50,000 in ARR.
For B2B SaaS companies and subscription businesses, ARR is the ultimate north-star metric. But why does it command so much respect in boardrooms and investor pitches?
First, ARR measures the fundamental health of your business model. Unlike traditional one-off sales models where you start every month at zero, subscription models offer predictable cash flows. ARR shows you the baseline momentum of your business. It is a forward-looking operating metric, whereas GAAP revenue is backward-looking and bound by strict revenue recognition rules.
Second, ARR is crucial for accurate forecasting and planning. When you know your starting ARR, you can confidently budget for hiring, product development, and customer acquisition. If you know your customer acquisition cost (CAC) and lifetime value (LTV), you can map out exactly how much capital you need to scale.
Third, tracking ARR helps you spot underlying product or operational issues early. If your ARR is shrinking despite closing new deals, you have a retention problem. In the subscription economy, retention is the engine of compounding growth.
To dive deeper into how this metric fits into your broader dashboard, check out our guide on SaaS Metrics to Track and read our comprehensive ARR Glossary for key definitions.
The Annual Recurring Revenue Formula: Basic vs. Comprehensive Calculations
Not all subscription books are created equal. Some companies have simple, flat-rate monthly subscriptions, while others manage a complex mix of monthly, annual, and multi-year contracts with varying tiers and discounts.
Because of this complexity, there are two primary ways to calculate ARR. The basic formula works well for quick run-rate estimates, while the comprehensive formula is the standard required for investor due diligence and strategic planning.
To make these calculations easier, you can use specialized tools like this ARR Calculator to run your own scenarios. Let's break down both methods.
The Basic Annual Recurring Revenue Formula
The simplest way to calculate ARR is to take your Monthly Recurring Revenue (MRR) and multiply it by 12.
ARR = MRR × 12
For example, if your business generated $100,000 in stable, recurring MRR in June, your basic ARR is $1.2 million.
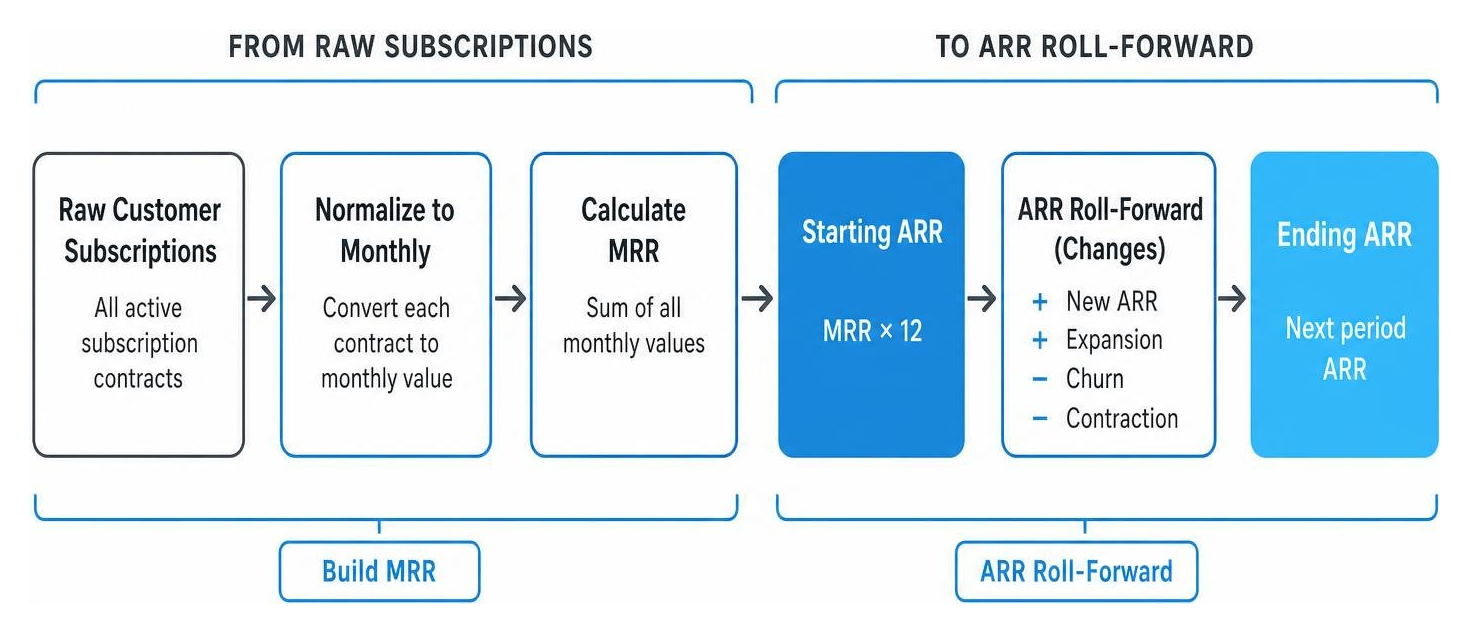
This formula works perfectly if you calculate your MRR cleanly and normalize all non-monthly contracts. For instance, if you have a mix of monthly and annual plans, you must divide the annual plan values by 12 before adding them to your MRR baseline.
However, a common mistake is multiplying a single "noisy" month by 12. If your MRR includes one-time setup fees, variable overage charges, or non-recurring professional services, your basic ARR calculation will be artificially inflated. To learn how to normalize your monthly numbers correctly, explore our MRR Formula Guide and review the MRR Glossary.
The Comprehensive Annual Recurring Revenue Formula
When investors look at your business, they want to see the mechanics of your growth. They want to know how your revenue is changing, not just where it stands today. This is where the comprehensive ARR formula comes in.
The comprehensive formula tracks the "roll-forward" of your ARR over a specific period (usually a month, quarter, or year):
Ending ARR = Starting ARR + New ARR + Expansion ARR − Contraction ARR − Churned ARR
To build an accurate ARR roll-forward schedule, you must track each of these moving parts individually:
- Starting ARR: Your recurring revenue at the beginning of the period.
- New ARR: Recurring revenue added from brand-new customer acquisitions.
- Expansion ARR: Additional recurring revenue from existing customers (upgrades, seat additions, cross-sells).
- Contraction ARR: Lost recurring revenue from customers downgrading to cheaper plans or reducing seats (without canceling entirely).
- Churned ARR: Lost recurring revenue from customers who cancel their subscriptions completely.
By breaking your ARR down into these components, you calculate your Net New MRR (and therefore Net New ARR), giving you a clear picture of your customer acquisition efficiency and product-market fit.
Key Components of ARR and What to Exclude
To calculate your annual recurring revenue formula cleanly, you must establish clear rules for what enters your calculation ledger and what stays out. Mixing recurring and non-recurring revenue is one of the quickest ways to lose credibility with investors.
Let's look at the six distinct components of ARR and how they impact your numbers:
- New ARR: The lifeblood of early-stage growth. This is the annualized value of subscriptions from entirely new customers.
- Expansion ARR: Revenue generated when existing customers buy more seats, upgrade to a higher tier, or purchase add-on features. High expansion ARR is a sign of strong product value.
- Renewal ARR: The value of contracts that successfully renew at the end of their term.
- Reactivation ARR: Revenue from former customers who canceled but have now returned to a paid plan.
- Contraction ARR: The revenue lost when customers downgrade their plans but remain customers.
- Churned ARR: The revenue lost when customers cancel their subscriptions entirely.
To maintain calculation hygiene, you must strictly exclude non-recurring items. Here is a quick reference table of what to include and what to exclude:
| What to Include | What to Exclude |
|---|---|
| Regular monthly subscription fees | One-time setup and implementation fees |
| Annual and multi-year contract values | Professional consulting and training fees |
| Committed usage minimums (floors) | Variable usage overages (non-committed) |
| Active discounts/coupons (at actual price paid) | Hardware or physical equipment sales |
| Ongoing maintenance and support fees | Unconverted free trials |
Why do we exclude one-time fees and professional services? Because they lack predictability. A customer might pay you $10,000 for custom onboarding in year one, but that revenue will not repeat in year two without additional sales effort. If you include it in your ARR, you distort your valuation and make it look like your recurring engine is larger than it actually is.
For a deeper dive into separating recurring and non-recurring revenue, check out this Recurring Revenue Guide.
ARR vs. MRR and How Investors Use These Metrics
While ARR and MRR are closely related, they serve different audiences and different strategic purposes.
MRR is primarily an operational metric. It is highly sensitive to short-term changes, making it ideal for product managers, marketing teams, and sales leaders who need to track week-over-week or month-over-month performance. If a new marketing campaign launches, you'll see the impact in your MRR first.
ARR is a strategic and valuation metric. It smooths out monthly volatility and provides a macro-level view of the business. It is the metric used for long-term forecasting, annual budgeting, and investor discussions. If your contracts are primarily annual or multi-year, MRR can actually be misleadingly volatile, making ARR the preferred metric.
To calculate your monthly baseline first, you can use our MRR Calculator.

How Investors Use ARR to Value SaaS Companies
Investors love recurring revenue because it is highly predictable. Because of this predictability, SaaS companies are valued on a multiple of their ARR rather than traditional multiples of EBITDA or net income.
The basic SaaS ARR valuation multiple formula is:
ARR Multiple = Implied Valuation ÷ ARR
For example, in a high-profile funding round, the AI startup Hebbia raised $130 million at an estimated $700+ million valuation while generating $13 million in ARR. This implied a massive ARR multiple of approximately 54x. While 54x is an exceptional outlier driven by the AI boom, typical high-performing SaaS companies in July 2026 trade at multiples between 6x and 15x ARR, depending on growth rates and market conditions.
When evaluating the quality of your ARR, investors look beyond the absolute number. They analyze:
- Growth Rate: How fast is your ARR growing year-over-year?
- Net Revenue Retention (NRR): Are your existing customers spending more with you over time? Healthy SaaS companies target NRR above 110%.
- The Rule of 40: Does your growth rate plus your profit margin equal or exceed 40%? Learn more about this benchmark in our Rule of 40 guide.
- LTV/CAC Ratio: Is your customer acquisition strategy efficient? The industry standard is 3.0x or higher. You can read more about this in our LTV/CAC Ratio overview.
Frequently Asked Questions about ARR Calculations
Does ARR include one-time setup fees or professional services?
No. One-time setup fees, onboarding charges, custom development work, and professional services must be excluded from your ARR calculations.
While these fees represent real cash coming into your bank account, they do not recur automatically. ARR is designed to measure the predictable, compounding engine of your business. Including non-recurring revenue in your ARR calculations artificially inflates your metrics, misleads investors, and can lead to over-hiring or over-spending based on non-repeating cash.
How do you calculate ARR from multi-year contracts?
To calculate ARR from multi-year contracts, you must normalize the total contract value (TCV) to a single year. You do this by dividing the total value of the contract by the number of years in the contract term.
For example, if a customer signs a 3-year contract worth $90,000 total, the calculation is:
$90,000 ÷ 3 years = $30,000 ARR
Even if the customer pays the entire $90,000 upfront on day one, the ARR is still recorded as $30,000 per year. ARR measures the annualized run-rate of the subscription, not cash collections. For more practical scenarios and deep-dive examples, see this resource on ARR Formula and Examples.
What is a good ARR growth rate for a SaaS company?
A "good" growth rate depends heavily on your company's stage and funding model.
According to SaaS industry benchmarks, the median ARR growth rate for private SaaS companies ranges between 40% and 60%. However, early-stage businesses (earning $1M to $3M ARR) experience much higher growth rates than late-stage businesses ($15M+ ARR) because they are starting from a smaller baseline.
Many venture-backed startups aim for the T2D3 model, which stands for Triple, Triple, Double, Double, Double. This ambitious framework maps out the journey from $1 million in ARR to $100 million by tripling ARR for two consecutive years, and then doubling it for the next three years.
To be in the top 25% of SaaS growth worldwide, a business must achieve and sustain a growth rate above 100% year-over-year.
Conclusion
Calculating your annual recurring revenue formula is more than a mathematical exercise — it is the key to understanding your business's true health, making confident strategic decisions, and presenting a trustworthy growth story to investors.
But as your customer base grows, tracking these metrics manually in spreadsheets becomes a nightmare. Between mixed billing cycles, mid-month upgrades, downgrades, and complex discounts, spreadsheets quickly break. In fact, sales reps already spend just 28% of their time actually selling, and finance teams shouldn't be bogged down by manual data engineering either.
This is where atSpark can help.
atSpark is an AI-powered analytics platform for SaaS companies that unifies your billing, CRM, and subscription data into a single source of truth. Instead of fighting with SQL queries or complex Excel formulas, atSpark allows your team to ask plain-English questions — like "What was our expansion ARR in Q2?" or "Show me our ending ARR by plan type" — and get instant, accurate charts, tables, and insights.
With conversational, governed analytics, atSpark gives you the power of a full data engineering team without the overhead. Ready to take control of your subscription metrics? Explore our ARR Glossary to master the terminology, and let us help you automate your growth tracking.