Why Getting Your Sales Quota Right Is the Hardest Thing in Revenue Planning
What is a good sales quota is one of the most consequential questions in revenue planning — and one of the most commonly answered wrong.
Here's the short answer:
| Benchmark | What It Means |
|---|---|
| 60–70% of reps hitting quota | The healthy sweet spot for a well-designed plan |
| 80–90% attainment rate | Typical benchmark for top B2B SaaS companies |
| 5x rep OTE | Standard rule of thumb for individual quota size |
| 20–50% YoY increase | Typical annual quota growth range in SaaS |
| Below 50% of reps hitting | Signal of a broken quota, not a rep problem |
| Above 80% of reps hitting | Signal that quotas are set too low |
If you're a RevOps or finance lead, you've probably lived this tension firsthand. Finance wants numbers that satisfy the board. Sales wants numbers the team can actually hit. And somehow, the quota that lands on each rep's desk manages to frustrate both sides.
The data backs this up. Only 24.3% of salespeople exceed their yearly quota, and in Q4 2024, the average quota attainment across B2B SaaS sat at just 43%. That's not a motivation problem. That's a design problem.
Getting this right matters more than most leaders realize. Set quotas too high, and your best reps start updating their resumes. Set them too low, and you're leaving revenue on the table and signaling soft expectations to investors.
This guide breaks down what a good sales quota actually looks like in 2026 — with benchmarks, formulas, and a practical framework for setting numbers your team can hit and your CFO can defend.
What Is a Sales Quota vs. Sales Goals and Targets?
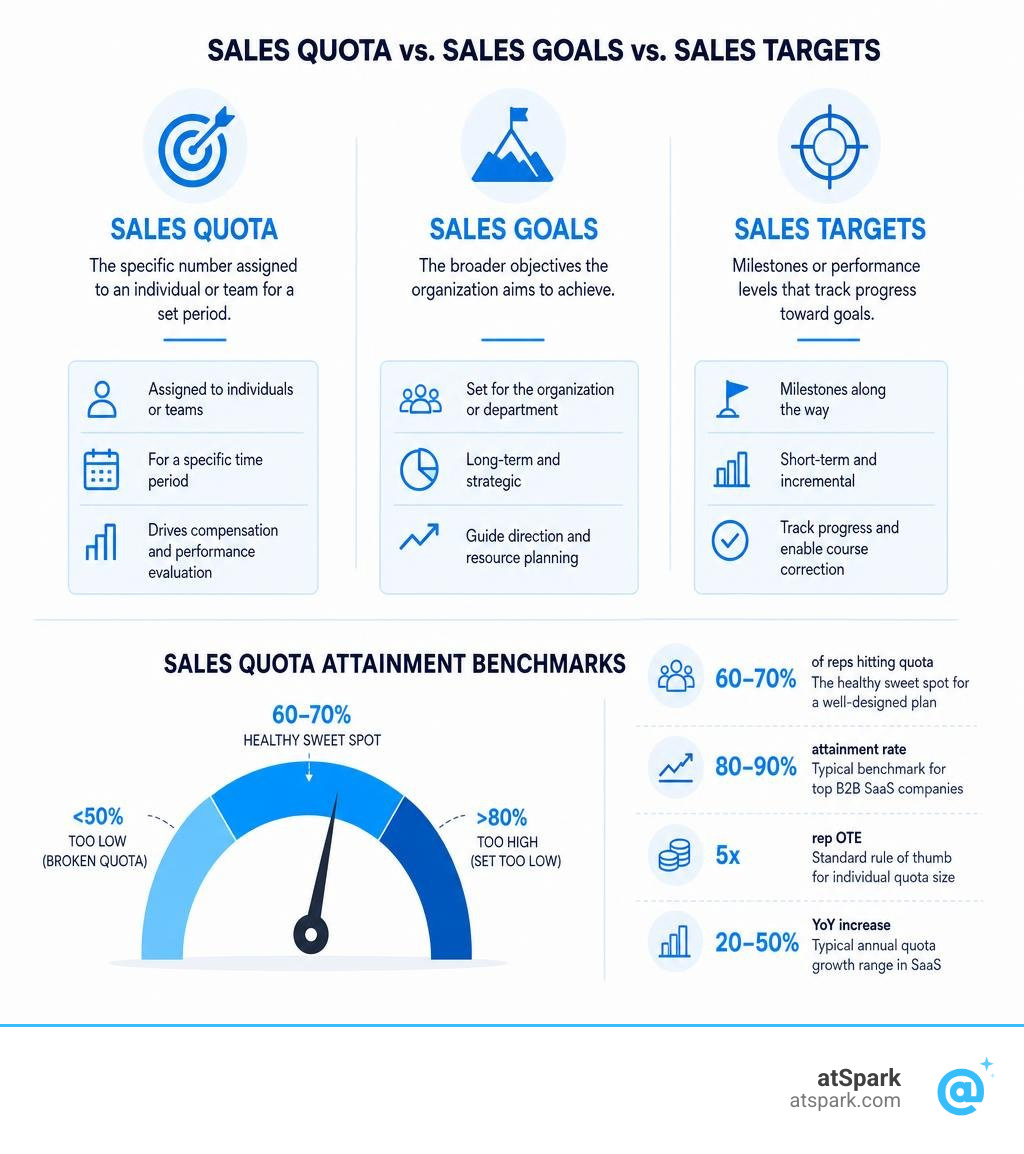
Before we dive into the math, let's clear up some terminology. In many sales organizations, the words "quota," "goal," and "target" are thrown around interchangeably. This confusion is a recipe for misaligned compensation plans and frustrated reps.
A Sales Quota is the minimum, legally binding performance expectation tied directly to a rep's compensation plan. It is a highly specific, time-bound metric (usually monthly or quarterly) that carries real-world consequences. If a rep misses their quota, their variable pay drops, and their job security may be on the line. If they exceed it, they enter accelerator zones where commission rates multiply.
In contrast, a sales goal is a broader, macro-level business objective. For example, a company might set an annual goal to expand into the European market, increase average contract value (ACV) by 15%, or hire ten new enterprise account executives.
A sales target sits in the middle. It is often an aspirational or stretch objective used for strategic planning or team contests. For instance, while a rep's official quota might be $200,000 for the quarter, the sales leader might challenge the team with a "stretch target" of $250,000 to win a trip or a special bonus.
To set quotas that actually work, leaders must align these individual expectations with the broader Sales Forecast. When quotas are treated as arbitrary numbers passed down from the executive team without a clear link to historical capability, they fail to motivate. As outlined in These Simple Strategies Will Help You Set Sales Quotas, the best quotas act as realistic stepping stones that help individual reps contribute directly to the company's macro financial goals.
What Is a Good Sales Quota? Benchmarks and Attainment Rates
When determining what is a good sales quota, you have to look beyond individual performance and analyze the health of your entire sales engine.

A common trap for sales leaders is assuming that a "good" quota is one that 100% of their reps hit. In reality, if every single salesperson on your team is hitting their quota, your targets are likely far too conservative, and you are leaving money on the table. Conversely, if fewer than half of your reps are meeting their numbers, your quotas are broken.
So, where is the sweet spot?
Industry standards show that a healthy sales organization should aim for 60% to 70% of its reps to hit or exceed their individual quotas. This distribution ensures that your targets are challenging enough to drive growth but realistic enough to keep the team motivated. Within this model, the top 10% to 20% of your team should be blowing past their numbers into accelerators, while the bottom 10% to 20% fall into the performance-management zone.
According to Sales Quota Attainment: Formula & Benchmarks, a good overall team-wide quota attainment rate falls between 80% and 90%. This means that when you aggregate the total revenue generated by the team and divide it by the total allocated quota, the resulting percentage should sit comfortably in this range. Verified real-world reviews from top-performing companies support this benchmark:
- Miro: 85% average team attainment
- Veeva Systems: 84% average team attainment
- Gusto: 83% average team attainment
If your team's average attainment drops below 50%, it is a structural signal that your quotas are disconnected from market reality, your Win Rate is slipping, or your territory design is unbalanced.
Defining What Is a Good Sales Quota for SaaS Teams
The B2B SaaS sector has its own unique set of rules. In 2026, SaaS valuation models have shifted dramatically from "growth at all costs" to capital efficiency and sustainable unit economics. Because of this, setting realistic SaaS quotas is more critical than ever.
According to Sales Quota: 2026 Guide to Setting & Hitting It, a typical annual sales growth target for established SaaS companies ranges from 20% to 50% year-over-year. For early-stage startups, however, annual projections are often too volatile, making month-over-month (MoM) growth targets of 10% to 20% a more honest and manageable benchmark.
When translating these company-level growth targets into individual quotas, you must ensure the math respects the limitations of your sales team's capacity and the actual market demand.
The Quota-to-OTE Ratio: Finding the Sweet Spot
To design a compensation plan that is both financially viable for the company and fair to the salesperson, you must master the quota-to-OTE (On-Target Earnings) ratio. OTE represents a rep's total expected compensation, consisting of a 50/50 split between base salary and variable commission.
The standard industry rule of thumb is the 5x OTE "Golden Ratio". This means a rep's annual quota should be approximately five times their total on-target earnings. If a mid-market account executive has an OTE of $150,000, their annual quota should be set at $750,000.
Paying more than 20% to 25% of first-year contract value back to sales reps in commissions and salaries quickly breaks the unit economics of a SaaS business. However, this ratio is not one-size-fits-all and should vary based on your sales motion and market segment:
| Segment | Typical Quota Range | Typical OTE Range | Healthy Quota-to-OTE Ratio |
|---|---|---|---|
| Enterprise AE | $1.2M – $2.0M | $280K – $400K | 3:1 to 5:1 |
| Mid-Market AE | $700K – $1.1M | $160K – $220K | 4:1 to 6:1 |
| SMB / High-Volume AE | $500K – $800K | $90K – $140K | 6:1 to 8:1 |
| SDR (Pipeline Quota) | $4M – $8M | $70K – $95K | 8:1 to 10:1 |
As explored in How to Set Sales Quotas in 2026: The Goldilocks Ratio for Growth | Siplify Blog, pushing your quota-to-OTE ratio past 8:1 or 10:1 for standard sales roles is a primary driver of rep attrition. When the math is that heavily stacked against them, reps do the calculations on the back of a napkin, realize they can't make a living, and leave.
The 5 Main Types of Sales Quotas and When to Use Them
Not all sales quotas are built the same. Depending on your business model, sales cycle, and strategic goals, you should deploy different types of quotas to incentivize the right behaviors.
| Quota Type | What It Measures | Best Used For | Pros | Cons |
|---|---|---|---|---|
| Revenue / Volume Quota | Total dollar value or number of units sold | Mature markets with predictable sales cycles | Simple to understand and track | Can lead to discounting or ignoring smaller accounts |
| Activity Quota | Number of calls, emails, meetings, or demos | SDRs, new hires, or long sales cycles | Keeps reps focused on input metrics | Does not guarantee revenue outcomes |
| Profit Quota | Gross margin or profit generated from deals | Highly customizable pricing or services | Encourages value selling and discourages heavy discounting | Extremely complex to calculate and track |
| Forecast Quota | Performance against a predicted regional target | Seasonal businesses or established territories | Accounts for regional demand differences | Can penalize reps in rapidly growing territories |
| Combination Quota | A blend of revenue and activity metrics | Multidisciplinary roles (e.g., hybrid AE/AM) | Promotes a balanced sales approach | Can dilute focus if too many metrics are tracked |
Let's look at these in more detail:
- Revenue/Volume Quotas: This is the most common model. It simply states that a rep must close a specific dollar amount (e.g., $100,000 in New ARR per quarter) or a specific number of units (e.g., selling 50 software licenses a month).
- Activity Quotas: Essential for early-stage pipeline generation. Instead of holding an SDR accountable to a closed revenue number they cannot control, you hold them to activities like making 50 dials a day or booking 8 qualified meetings a month.
- Profit Quotas: Common in industries where reps have high flexibility over pricing. If a rep can discount a service at will, a profit quota ensures they only get paid on the actual margin they bring in, keeping your unit economics healthy.
- Forecast Quotas: These are set based on historical performance and regional expectations. If the Pacific Northwest historically brings in 30% more revenue than the Southwest, the Northwest rep is assigned a higher forecast quota to match the local market potential.
- Combination Quotas: A hybrid approach. For example, an AE might have a quota that is 80% weighted on closed-won revenue and 20% weighted on maintaining a clean CRM and running a set number of discovery calls.
How to Set Sales Quotas: Balancing Top-Down and Bottom-Up Approaches
One of the greatest points of failure in quota design is relying entirely on a top-down approach. This happens when the board or CFO looks at investor growth expectations, decides the company must hit $20 million in revenue, and simply divides that number by the headcount of the sales team.
This pure top-down model completely ignores territory differences, market demand, and rep capacity. It's how you wind up with unrealistic quotas that destroy team morale.
To build quotas that are both mathematically sound and realistic, you must use a hybrid approach that reconciles top-down goals with bottom-up market realities.
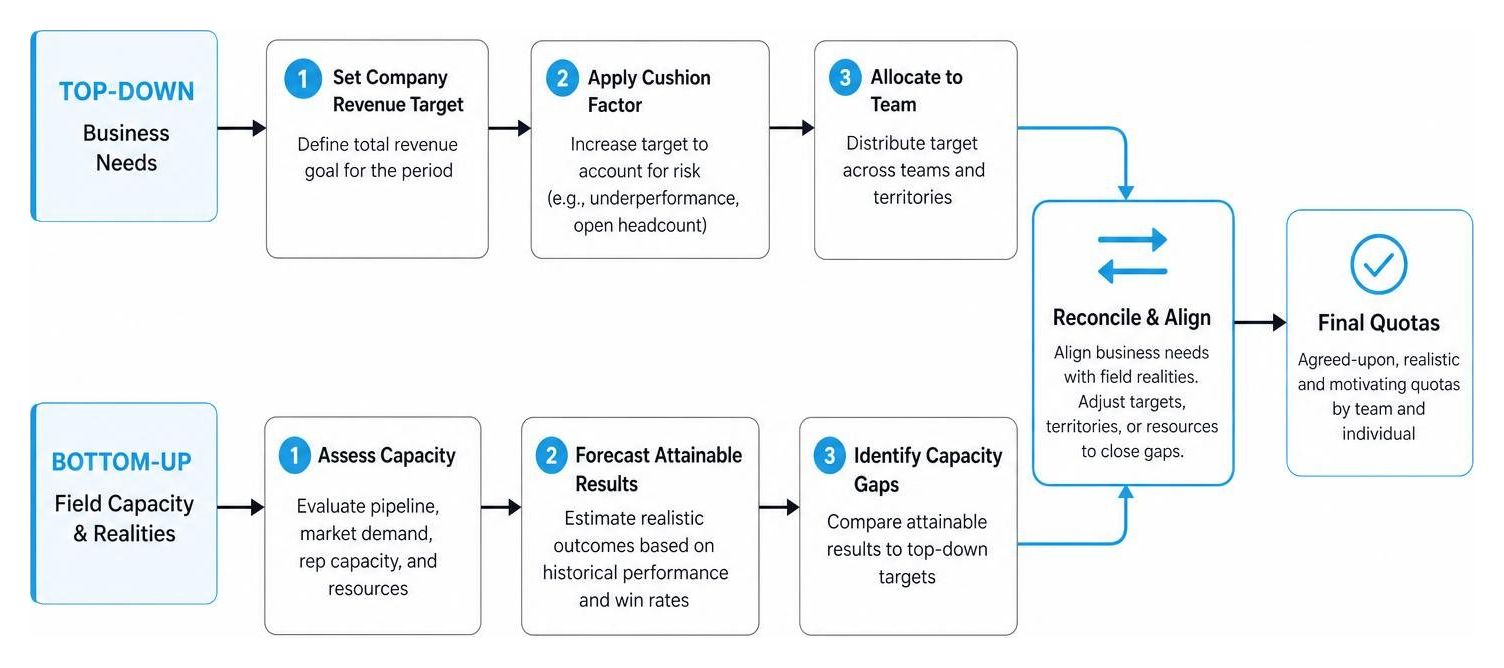
As outlined in Sales Quota Setting Methodology: A Data-Driven Approach — Fairview, a hybrid methodology allows you to bridge the gap between what the business needs to grow and what the field is actually capable of delivering.
First, you establish your top-down revenue target, applying a standard "cushion factor" (usually 115% to 125% of the company's actual target) to account for expected rep underperformance or open headcount.
Next, you conduct a bottom-up capacity analysis. This means looking at your current Sales Pipeline, your historical win rates, and your actual sales capacity. If your top-down target requires every rep to close 15 enterprise deals a quarter, but your historical data shows your top performer has never closed more than 6, you have a "capacity gap" that must be resolved by adjusting the target, changing the territory design, or hiring more reps.
Step-by-Step Methodology for Calculating What Is a Good Sales Quota
To calculate a fair and accurate quota for an individual rep, follow this data-driven framework:
- Establish a Baseline: Pull 24 to 36 months of historical sales data. Calculate the median performance of your fully ramped reps. Do not use your top-performing outlier as the baseline; doing so will result in a quota that 80% of your team cannot hit.
- Score Your Territories: Not all territories are created equal. Score each territory based on active accounts, market penetration, historical win rates, and competitive density.
- Calculate Territory-Adjusted Quota: Use a standardized formula to adjust the base quota for each rep based on their territory's potential. For example: $$\text{Territory Quota} = \left( \frac{\text{Territory Potential Score}}{\text{Average Territory Potential Score}} \right) \times \text{Base Quota}$$
- Sense-Check Against Capacity: Multiply the rep's expected Average Deal Size by their historical close rate to ensure the required deal volume is physically possible within a standard work week.
Managing Ramp Periods and Seasonality
Two of the biggest "silent killers" of sales performance are ignored ramp periods and flat seasonality models.
If you hire a new AE and hand them a full quota on day one, you are setting them up to fail. A realistic ramp schedule must match your actual Sales Cycle Length. If your average sales cycle is 4 months, your ramp period should be at least 4 to 6 months (1.5x the sales cycle length).
A standard, humane ramp schedule looks like this:
- Month 1: 0% of full quota (focus on onboarding and training)
- Month 2: 25% of full quota
- Month 3: 50% of full quota
- Month 4: 75% of full quota
- Month 5+: 100% of full quota
Similarly, do not divide an annual quota by 12 and call it a day. Most B2B industries experience heavy seasonality, where Q4 can represent up to 40% of annual revenue, while Q1 and Q3 are historically slower. Use your historical cohort data to weight monthly and quarterly quotas accordingly, so reps aren't penalized during naturally slow periods.
The Risks of Poor Quota Setting and How to Improve Attainment
The consequences of getting your sales quotas wrong extend far beyond a missed quarterly revenue target.
When quotas are set too high, you trigger a destructive cycle. Reps realize the goals are mathematically impossible, check out mentally, and eventually leave. According to research from Pavilion, companies experience a 40% increase in sales rep attrition when they miss their revenue plans by more than 25%. This high turnover is incredibly expensive, costing organizations months of lost productivity and thousands of dollars in recruitment and onboarding costs.
Conversely, setting quotas too low leads to a massive waste of capital. Reps hit their targets early, coast through the rest of the quarter, and collect high accelerator commissions on deals that would have closed anyway.
To prevent these outcomes, sales leaders must take a proactive approach to improving quota attainment. According to How do you set sales quotas that reps actually hit? | Pulse News, there are four key levers to lift your team's performance:
- Invest in Sales Enablement: Provide your team with the playbooks, competitive intelligence, and content assets they need to shorten sales cycles.
- Rethink Your Commission Structure: Build tiered accelerators that kick in at 80% and 100% of quota to keep reps motivated, and offer targeted bonuses for strategic products.
- Keep Over-Allocation Trim: Most organizations over-allocate quotas from the top goal down to the front line to create a buffer. However, limit this over-allocation to 3% to 5%. Excessive over-allocation (e.g., 15% to 20%) creates a toxic disconnect between executive expectations and front-line realities.
- Provide Real-Time Visibility: Do not keep your reps in the dark about their progress. Give them real-time visibility into their quota attainment and pending commissions to drive motivation and ownership.
Frequently Asked Questions about Sales Quotas
What is the difference between a sales quota and a sales target?
A sales quota is the formal, minimum performance expectation tied directly to a rep's commission plan and job security. A sales target is a broader, often aspirational or stretch goal used by leadership for strategic planning, forecasting, or team-wide motivational contests. Quotas carry direct compensation consequences; targets carry aspirations.
What is a realistic pipeline coverage ratio to hit quota?
While many legacy sales managers cling to the "3x pipeline coverage rule," it is largely a myth. Your required pipeline coverage should be calculated directly from your actual win rate. If your team has a 25% win rate, you need at least 4x qualified pipeline coverage to reliably hit your quota. If you are targeting a new territory or market segment, you may need 5x to 7x coverage. Always track your Weighted Pipeline to ensure you are filtering out stale or "zombie" deals from your calculations.
How often should sales quotas be adjusted?
Quotas should be set annually but reviewed quarterly. You should build clear, objective triggers into your quota policy that allow for mid-year recalibrations in the event of major macroeconomic shifts, significant product changes, or major territory realignments. Avoid changing quotas mid-quarter, as constantly shifting the goalposts is the fastest way to destroy team trust.
Conclusion: Let Data Drive Your Quota Strategy
Setting a good sales quota is not a matter of guesswork, intuition, or giving in to top-down pressure from the board. It is a precise mathematical exercise that requires a deep, unified understanding of your historical performance, your territory potential, and your team's actual capacity.
To make these data-driven decisions, you need instant access to your company's core metrics. That is where atSpark comes in.
atSpark is an AI-powered analytics platform designed specifically for SaaS companies. By unifying your billing, CRM, and subscription data into a single, cohesive source of truth, atSpark allows your RevOps, finance, and sales leadership teams to ask plain-English questions and get instant charts, tables, and insights. With our conversational, governed analytics, you can model your pipeline coverage, analyze historical win rates, and verify your quota-to-OTE ratios in seconds — all without needing to write a single line of SQL or wait on engineering help.
Stop setting quotas in the dark. Let data drive your growth strategy, protect your team's motivation, and build a predictable engine for revenue success.
Ready to see how atSpark can transform your revenue planning? Learn more about optimizing your team's performance by exploring our guide to quota attainment today.