Why Your Pipeline Number Is Lying to You
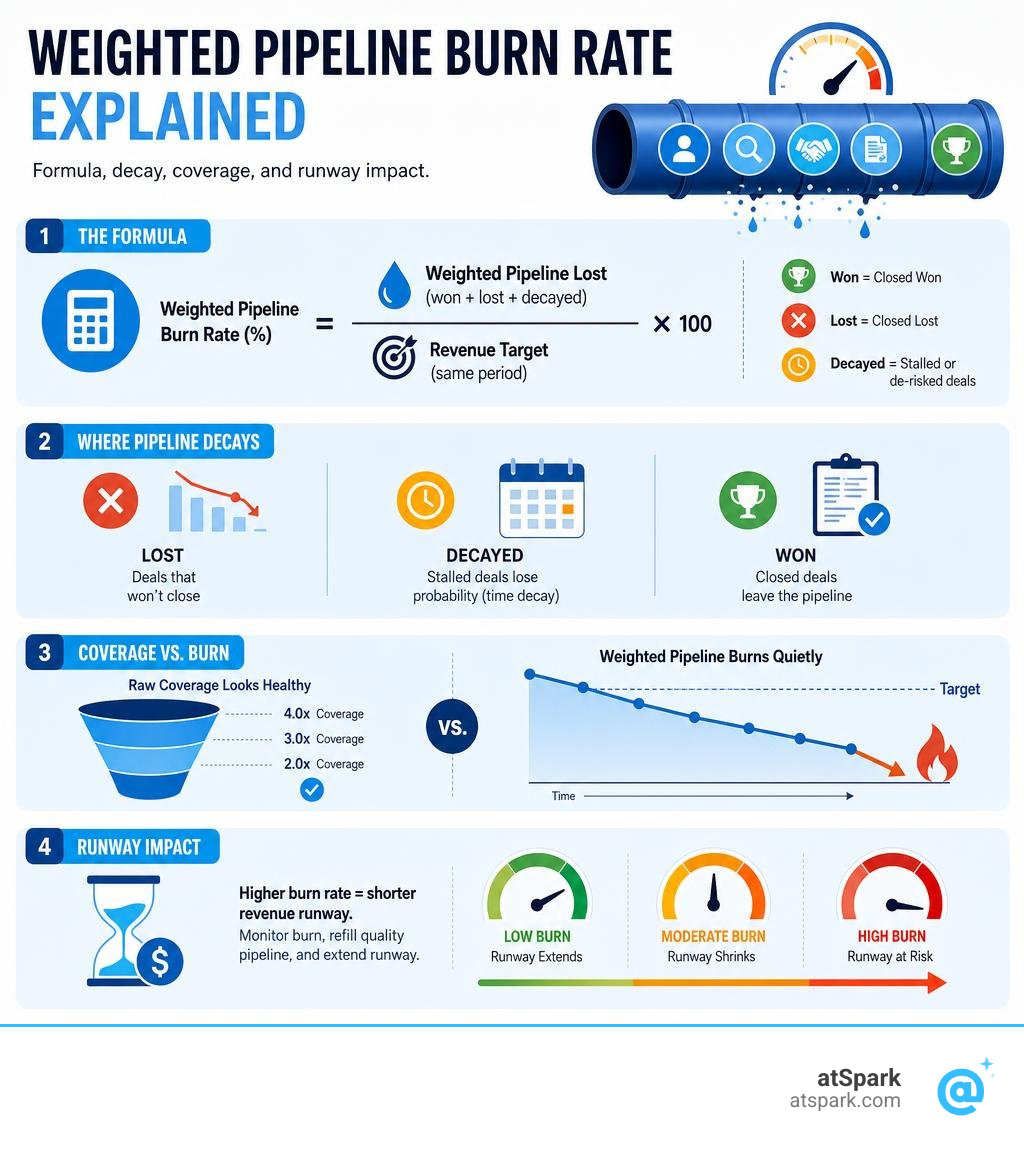
Your weighted pipeline burn rate tells you how fast your qualified, probability-adjusted pipeline is being consumed relative to your revenue target — and most SaaS finance and RevOps teams are flying blind without it.
Here's the quick answer if you need it now:
Weighted pipeline burn rate = how quickly your weighted pipeline value is being depleted (through wins, losses, and stalled deals) against your bookings target over a given period.
To calculate it:
- Weight your pipeline — multiply each deal's value by its stage win probability (e.g., a $100K deal at 30% = $30K weighted value)
- Sum the weighted values — this is your total weighted pipeline
- Track changes week-over-week — how much weighted pipeline is leaving (closed-won, closed-lost, or decayed)?
- Divide the weekly/monthly loss by your revenue target — this gives you your burn rate as a percentage of what you need to close
Example:
| Week | Weighted Pipeline | Change | Revenue Target | Burn Rate |
|---|---|---|---|---|
| Week 1 | $800,000 | — | $200,000 | — |
| Week 2 | $680,000 | -$120,000 | $200,000 | 60% of target burned |
| Week 3 | $540,000 | -$140,000 | $200,000 | 70% of target burned |
If your pipeline is burning faster than it's being replenished, you will miss your number — even if your raw coverage ratio looks healthy.
That's the core problem. A pipeline stuffed with stalled deals and optimistic close dates can show a comfortable 3x or 4x coverage while the actual probability-adjusted value quietly erodes toward zero. High-growth SaaS companies often miss revenue targets not because deals fail to close, but because there simply weren't enough real deals in the pipeline to begin with.
Raw pipeline gives you a volume number. Weighted pipeline burn rate gives you a velocity and survival number — one that finance and RevOps teams can actually use to protect cash runway and make smarter capacity decisions before a bad quarter becomes a crisis.
What is a Weighted Pipeline vs. Unweighted Pipeline?
To understand how pipeline consumption impacts your financial health, we first need to distinguish between raw, unweighted numbers and a true Weighted Pipeline Glossary.
An unweighted (or raw) pipeline is simply the sum of every active deal in your CRM, regardless of what stage it is in. If you have ten deals in your Sales Pipeline Glossary, each worth $50,000, your unweighted pipeline is $500,000.
The problem with this approach is obvious: it treats an early-stage discovery lead, which has perhaps a 10% chance of closing, exactly the same as a deal in final contract negotiations with a 90% chance of closing. Building a revenue forecast on raw pipeline is like planning a vacation based on the assumption that every flight you look at online will automatically become a ticket you bought. It is built on hope, not reality.
A weighted pipeline solves this by multiplying each deal's total dollar value by its stage-specific win probability. This probability represents the historical likelihood that a deal at that specific stage will successfully convert to closed-won.
For example, let's look at how an agency or B2B SaaS company might weight four active deals:
- Deal A (Discovery stage): $100,000 value × 10% probability = $10,000 weighted value
- Deal B (Demo Completed stage): $50,000 value × 30% probability = $15,000 weighted value
- Deal C (Proposal Sent stage): $50,000 value × 50% probability = $25,000 weighted value
- Deal D (Negotiation stage): $30,000 value × 80% probability = $24,000 weighted value
In this scenario, your raw, unweighted pipeline is $230,000. However, your realistic weighted pipeline is only $74,000.
As outlined in this guide on Weighted Pipeline Definition: Formula & How to Use It, many sales teams make the mistake of using static, round-number probabilities (like 20/40/60/80) that they guessed years ago. For forecasting accuracy, these probabilities must reflect actual historical CRM data over the past 12 months. When you calculate probabilities based on real performance, your pipeline becomes a reliable leading indicator of future revenue, rather than a collection of rep wishful thinking.
How to Calculate Weighted Pipeline Coverage
Once you have your weighted pipeline, you can calculate your Pipeline Coverage Glossary. This ratio tells you whether you have enough active deals in play to realistically hit your revenue targets.
The basic formula for raw pipeline coverage is:
$$\text{Raw Pipeline Coverage} = \frac{\text{Total Unweighted Pipeline Value}}{\text{Revenue Quota}}$$
However, to get a true picture of team health, we must calculate the weighted pipeline coverage ratio:
$$\text{Weighted Pipeline Coverage} = \frac{\text{Total Weighted Pipeline Value}}{\text{Revenue Quota}}$$
Let's look at how raw and weighted coverage compare in practice:
| Metric | Company A (Raw View) | Company A (Weighted View) |
|---|---|---|
| Active Pipeline | $3,500,000 | $1,150,000 |
| Quarterly Revenue Target | $1,000,000 | $1,000,000 |
| Coverage Ratio | 3.5x | 1.15x |
| What it actually means | Looks incredibly healthy. | You are in serious trouble and will likely miss your target. |
As this table shows, relying solely on raw coverage can create a dangerous, false sense of security.
So, what is a "good" target? Historically, sales teams have used a generic 3x to 4x raw pipeline coverage rule of thumb. But we believe your target pipeline coverage should be the exact mathematical inverse of your historical win rate:
$$\text{Target Pipeline Coverage} = \frac{100}{\text{Win Rate Percentage}}$$
If your team converts 25% of qualified opportunities into closed-won deals, you need a 4x coverage ratio. If your win rate is 50%, you only need 2x coverage. If your win rate is 10%, you mathematically require 10x coverage—a massive volume that often signals the need for a complete Go-To-Market (GTM) rethink rather than just hiring more reps.
These targets also vary widely by sales model and segment:
- Enterprise sales: 3x to 5x coverage (due to long, complex 6-to-12-month sales cycles)
- Mid-market sales: 2.5x to 4x coverage
- SMB outbound: 2.5x to 3x coverage (typically with 35% to 45% win rates)
- SMB inbound: 1.7x to 2.5x coverage (typically with 45% to 60% win rates)
- Expansion and upsells: 1.5x to 2x coverage (typically with 50% to 70% win rates)
Understanding these ratios is critical because they dictate your sales velocity—the speed at which opportunities move through your pipeline and convert into hard revenue.
Understanding the Weighted Pipeline Burn Rate and Decay
While coverage ratios give you a static, point-in-time snapshot of your pipeline, they do not tell you how fast that pipeline is changing. That is where we must look at pipeline decay and the weighted pipeline burn rate.
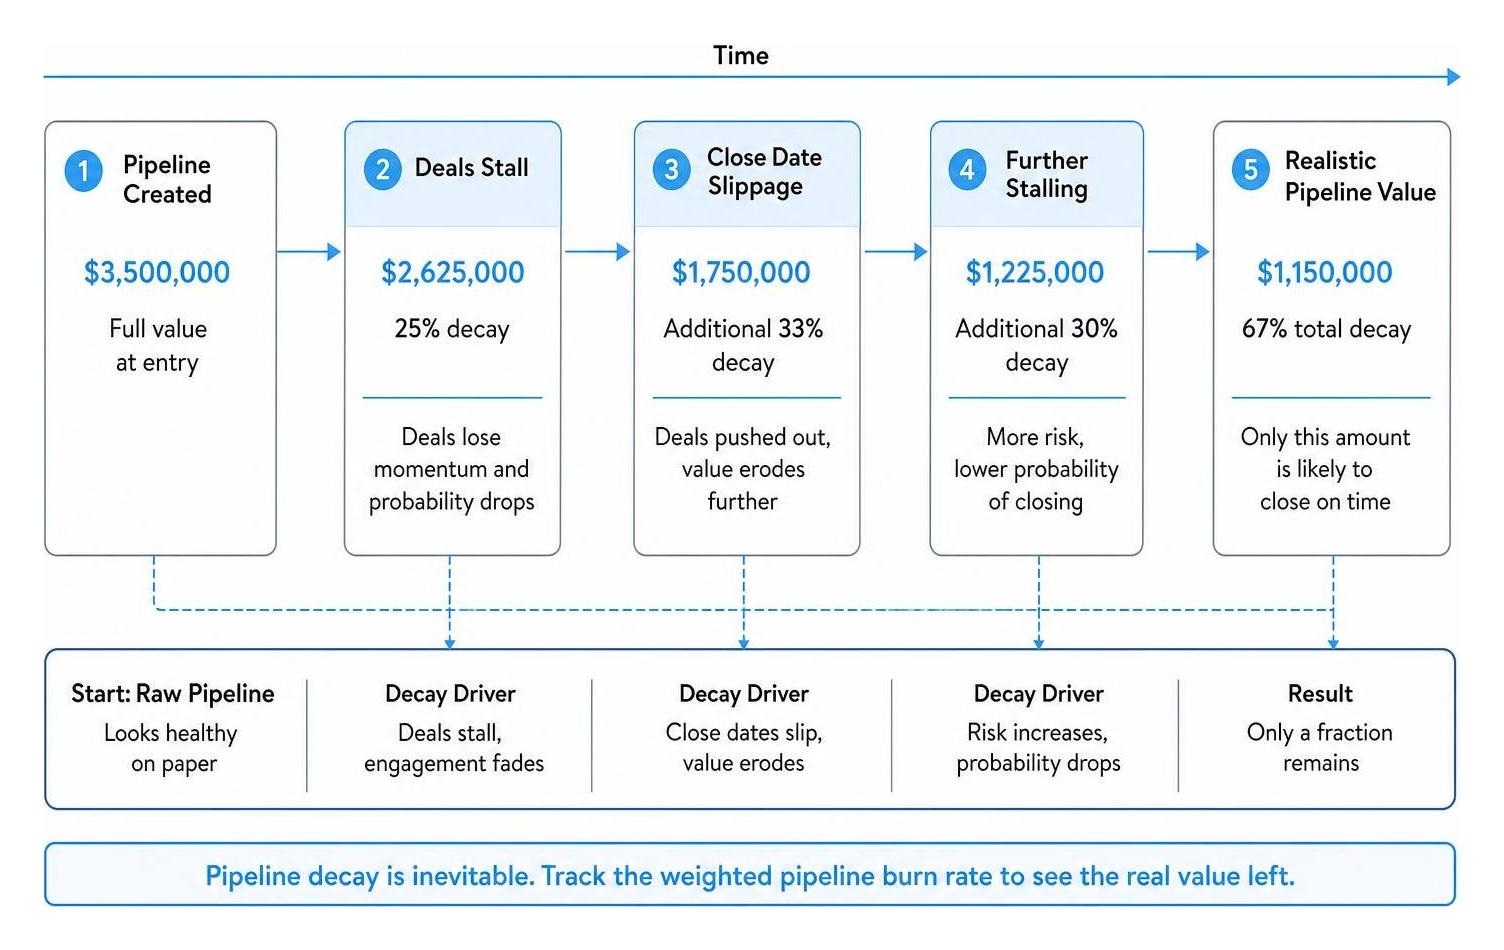
Over time, sales pipelines naturally decay. Deals get stuck, prospect priorities shift, and close dates slip. If you do not actively monitor your pipeline's consumption speed, you run the risk of relying on "zombie deals"—opportunities that are technically open in your CRM but have practically a 0% chance of ever closing.
To manage this, finance teams must track cash burn alongside pipeline burn. According to the Burn Rate Glossary, your cash burn rate is the speed at which your company consumes its capital reserves before generating positive cash flow.
When you combine this with a Startup Burn Rate Calculator — Know Your Runway | CalcFi, you quickly realize that pipeline decay is not just a sales problem; it is a cash runway problem. If your sales pipeline is decaying faster than you can generate new opportunities, your net cash burn will spike, shortening your survival timeline.
Defining the Weighted Pipeline Burn Rate Formula
To mathematically track this, we define the weighted pipeline burn rate as the speed at which weighted pipeline is consumed to generate a specific unit of revenue.
The formula is:
$$\text{Weighted Pipeline Burn Rate} = \frac{\text{Weighted Pipeline Consumed (Won + Lost + Decayed)}}{\text{Net New ARR Generated}}$$
This metric acts as a leading indicator for your capital efficiency. It is closely tied to your burn multiple, which is defined in the Burn Multiple Glossary and popularized in this guide on The Burn Multiple: Why Capital Efficiency Matters | Opagio.
Your burn multiple measures how much cash you burn for every dollar of net new ARR you generate:
$$\text{Burn Multiple} = \frac{\text{Net Cash Burn}}{\text{Net New ARR Generated}}$$
A burn multiple under 1.0x indicates highly efficient, sustainable growth. If your weighted pipeline burn rate is high—meaning you are consuming massive amounts of weighted pipeline just to eke out a small amount of net new ARR—your burn multiple will inevitably rise, signaling to investors that your growth is becoming too expensive to sustain.
How Stalled Deals Artificially Inflate Your Coverage
The primary culprit behind a misleadingly healthy pipeline is the presence of stalled deals. When sales reps feel pressure to maintain a 3x or 4x coverage ratio, they often keep dead deals on life support. They do this by continuously pushing close dates out by 15 or 30 days, creating "bloated" pipelines.
This false security masks the true velocity of your sales engine. If a deal has been sitting in "Proposal Sent" for three times your average sales cycle length, its actual win probability is near zero. Yet, in standard CRM calculations, it continues to be weighted at 50%, artificially inflating your coverage ratio and leading the finance team to believe that future revenue is secure.
Using Weighted Pipeline Burn Rates for Triangulation Forecasting
For finance and revenue operations (RevOps) teams, relying on a single sales forecast is a recipe for missed quarters. Instead, we use triangulation forecasting—combining multiple independent data points to build a highly accurate, predictive model of future revenue.
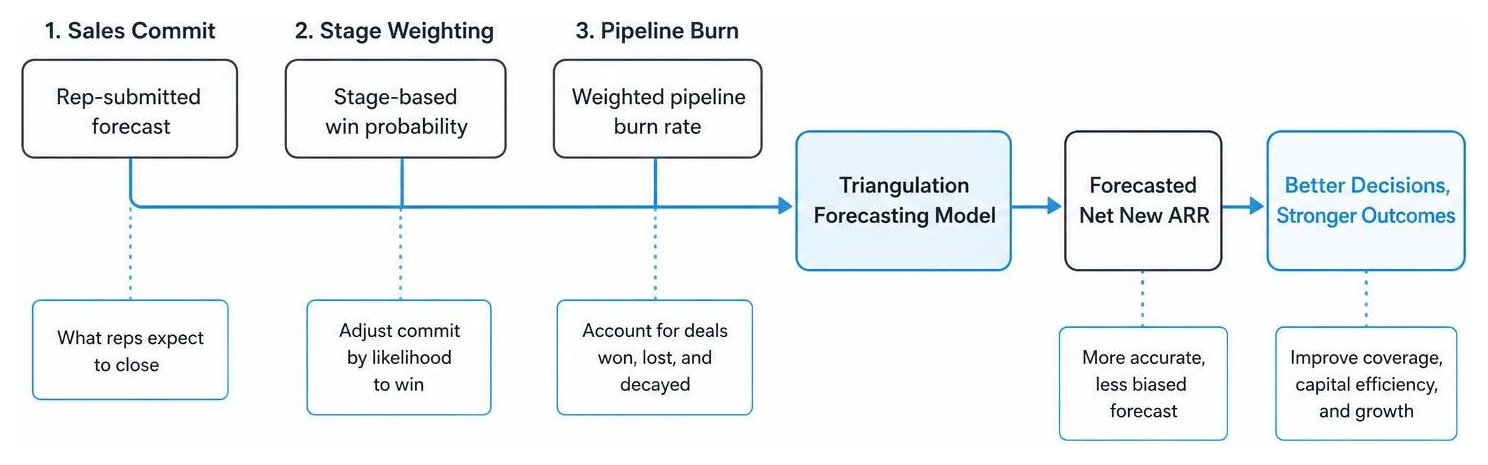
One of the most powerful ways to triangulate your forecast is to combine your weighted pipeline burn rate with a Create & Close (C&C) methodology.
As a quarter progresses, your final bookings will come from two sources:
- The pipeline you started the quarter with (which converts based on your weighted probabilities).
- The pipeline that is both created and closed within the same quarter.
By calculating your historical start-of-quarter pipeline conversion rates and pro-rating your remaining Create & Close estimates linearly by the calendar days left in the quarter, you can build a highly precise forecast. This reduces reliance on sales managers' "gut-feel" predictions, which almost always gravitate toward hitting the exact target bookings number regardless of what the data actually says.
Integrating Your Weighted Pipeline Burn Rate with Cash Runway
When planning headcount and capital allocation, finance teams must look at how sales pipeline performance directly influences cash runway.
According to Seed burn rate benchmarks by stage (2026) | Causo Hub, seed-stage startups typically operate within specific net monthly burn bands:
- Pre-product: $40K to $90K monthly burn (2 to 4 headcount)
- Post-product, pre-revenue: $120K to $200K monthly burn (5 to 8 headcount)
- Post-revenue, pre-Series A: $200K to $350K monthly burn (8 to 12 headcount)
If you are post-revenue and planning to scale your team, your headcount math must be grounded in pipeline reality. Adding a new sales lead and another engineer on a $2M seed round can easily increase your monthly burn by $30,000 (especially when budgeting for an extra 18% to 25% on top of base salaries to cover payroll taxes, benefits, and equipment burden).
If your weighted pipeline burn rate shows that your sales pipeline is not converting fast enough to support this new cost base, you will cut your runway from 18 months to 9 months without noticing—forcing you to raise your next round from a position of extreme weakness.
Building More Accurate Triangulation Forecasts
To build a robust triangulation forecast, we recommend running three parallel forecasting models every week:
- The Sales Roll-Up: The traditional bottom-up commit where reps tell managers what they think will close, and managers apply their own qualitative filters.
- The Stage-Weighted Model: A purely mathematical calculation based on current open pipeline multiplied by historical stage probabilities.
- The Historical Conversion Model: An analysis of your trailing seven-quarter (T7Q) average conversion rates applied to your start-of-quarter pipeline.
By comparing these three numbers, you can easily spot anomalies. For example, in a historical audit of one high-growth company, we discovered that more than half of the closed deals in a given quarter were completely missing from the week-3 pipeline. This was a clear signal of sandbagging—reps were hiding active deals or keeping close dates artificially far out to avoid executive scrutiny, completely undermining the accuracy of the stage-weighted model.
Best Practices for CRM Hygiene and Automating Decay Rules
Your forecasting models are only as good as the data feeding them. To prevent "zombie deals" from ruining your calculations, you must implement automated pipeline hygiene rules in your CRM.
Just as engineering teams must audit their background data pipelines to prevent runaway costs—as detailed in this technical analysis of docs/cost-architecture.md—RevOps teams must actively audit their CRM pipelines to prevent "data bloat."
Here are the best practices we recommend for automating pipeline hygiene:
- Implement an Automatic Slip Policy: If a rep changes a deal's close date more than twice in a single quarter, automatically reduce its stage probability by 50%. If it slips a third time, flag it for executive review or move it to a "Stalled" stage.
- Enforce Activity-Based Decay: Set maximum time thresholds for each pipeline stage. If an opportunity shows no activity signals (emails, meetings, or calls) for more than 45 days, automatically archive the deal as closed-lost.
- Normalize Multi-Currency Deals: If you sell globally, ensure all multi-currency deal values are normalized using monthly FX rates before they are summed up into your global pipeline calculations.
- Keep Qualification Binary: Ensure that your entry criteria for early-stage deals are strictly binary (e.g., "BANT criteria met: Yes/No") to prevent unqualified leads from entering and inflating your early-stage pipeline volume.
Frequently Asked Questions about Pipeline Metrics
What is a good weighted pipeline coverage ratio?
A healthy weighted pipeline coverage ratio typically sits between 2x and 3.5x, but the ideal number depends entirely on your historical win rate and sales cycle length. Enterprise teams with long, complex sales cycles require higher coverage (3x to 5x) to cushion against deal slippage, while transactional SMB outbound teams can operate safely with 2.5x to 3x coverage.
How often should you calculate your pipeline burn rate?
We recommend performing a quick pulse check on your pipeline burn rate weekly during revenue alignment meetings, followed by a deep-dive analysis monthly. Quarterly calibration is essential to update your stage win probabilities based on the trailing 12 months of historical CRM data.
Why do stalled deals ruin forecast accuracy?
Stalled deals create a false sense of security by inflating your pipeline coverage ratio. Because they technically remain in active stages, standard CRM calculators apply historical win probabilities to them, even though their real-world probability of closing has dropped to near zero. This leads to over-optimistic revenue projections and dangerous capacity planning decisions.
Conclusion
Managing a high-growth SaaS business requires absolute alignment between sales velocity and financial planning. Relying on raw, unweighted pipeline numbers is no longer enough to survive. By implementing a strict weighted pipeline burn rate methodology, you can accurately measure how fast your pipeline is converting, protect your cash runway, and make strategic hiring decisions with confidence.
At atSpark, we help SaaS companies eliminate the complexity of manual pipeline tracking. Our AI-powered analytics platform unifies your billing, CRM, and subscription data, allowing you to ask plain-English questions and get instant, accurate insights into your metrics.
Whether you want to calculate your exact Weighted Pipeline Glossary metrics, track your cash burn, or build multi-scenario triangulation forecasts, atSpark gives you governed, real-time answers without requiring SQL or engineering resources.
Ready to see how? Get started with atSpark today.