Why Getting SaaS Churn Rate Calculation Right Is Make-or-Break for Subscription Growth
SaaS churn rate calculation is simpler than most people think — but getting it wrong is one of the most expensive mistakes a subscription business can make.
Here's the quick answer:
Customer Churn Rate = (Customers Lost ÷ Customers at Start of Period) × 100
Revenue Churn Rate = (MRR Lost ÷ MRR at Start of Period) × 100
For example: if you started the month with 1,000 customers and lost 20, your customer churn rate is 2%.
To convert monthly churn to annual, use the compound formula — not simple multiplication:
Annual Churn Rate = 1 − (1 − Monthly Churn Rate)¹²
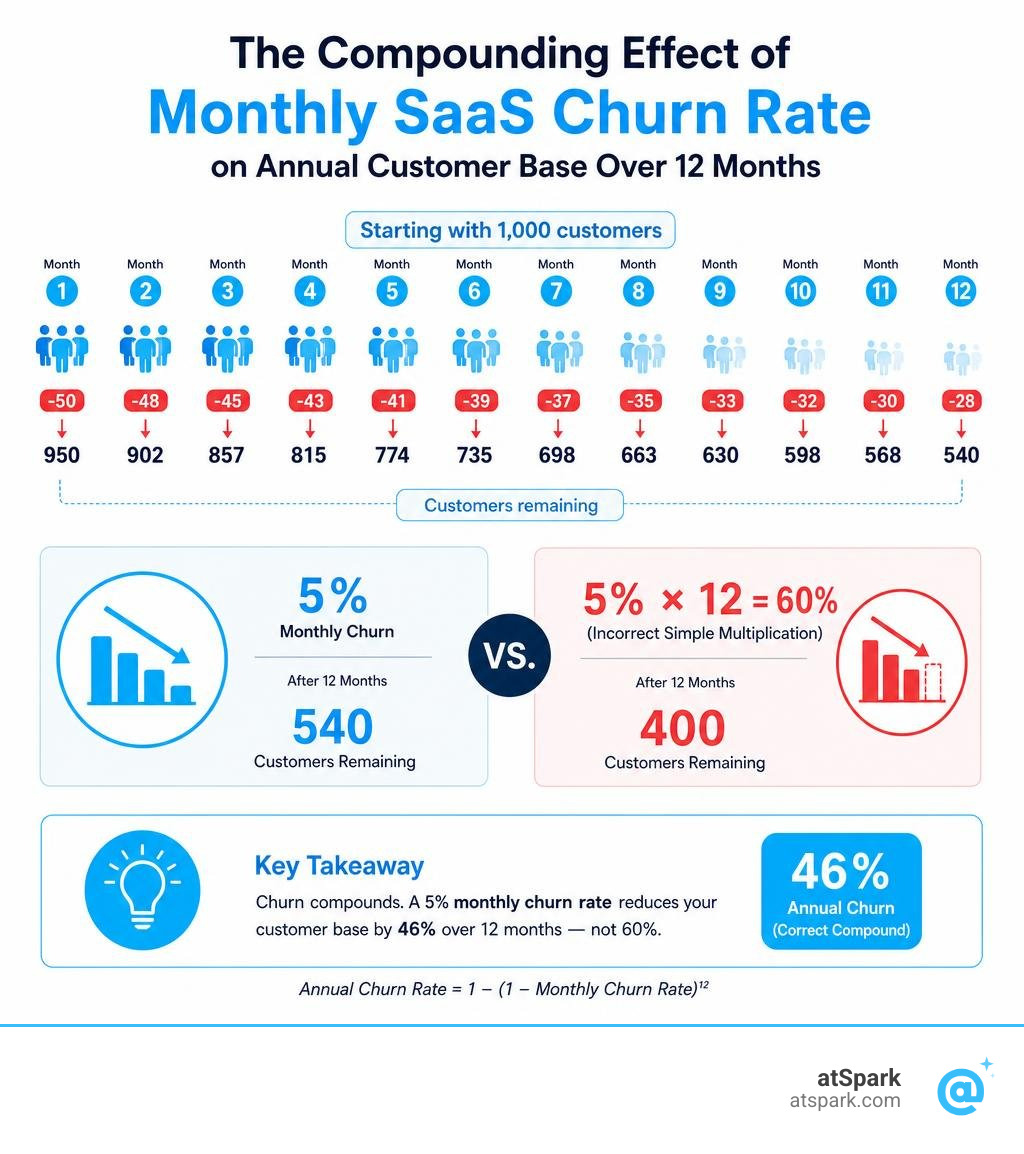
A 5% monthly churn rate doesn't equal 60% annually. It compounds to 46% — and that difference matters enormously for forecasting, valuation, and survival.
Every SaaS business loses customers. The question is whether you know exactly how fast, and whether you're measuring it correctly.
Most finance and RevOps teams think they have a handle on churn. Then they reconcile the spreadsheets, run the numbers a different way, and get three different answers. The denominator changes. Trial users slip in. Someone annualizes monthly churn by multiplying by 12. Suddenly the number you're reporting to the board is wrong — and every downstream metric built on top of it is wrong too.
Churn doesn't just measure customer loss. It drives your LTV, your LTV:CAC ratio, your fundraising story, and your revenue forecast. A single percentage point of monthly churn, compounding over 12 months, can mean the difference between a business that scales and one that quietly stalls.
This guide walks you through exactly how to calculate SaaS churn rate — customer churn, revenue churn, gross versus net — without the guesswork.
What is SaaS Churn Rate and Why Does It Matter?
At its core, SaaS churn rate measures the rate at which your subscription business loses customers or recurring revenue over a specific period. It is the direct opposite of customer retention. If your business has a 95% retention rate, it has a 5% churn rate.
But why does this single percentage point command so much attention in boardrooms?
In a subscription model, growth is cumulative. You do not just sell a product once and move on; you lease access to a service that must continually prove its value. When customer attrition occurs, you are not just losing today's transaction—you are losing the compounding stream of future cash flows that sustains your operations.
Tracking churn provides a direct window into your business health. It serves as a critical indicator of product-market fit, customer satisfaction, and pricing alignment. If your churn is high, it means you are pouring money into customer acquisition only to watch those users slip out of a leaky bucket.
According to our Customer Churn Rate Glossary, churn is fundamentally a lagging indicator. By the time a customer officially cancels their subscription, the underlying issues—such as poor onboarding, low feature adoption, or unhelpful customer support—have already done their damage weeks or months prior. This is why mastering your SaaS churn rate calculation is the first step toward building a proactive retention strategy.
Logo Churn vs. Revenue Churn
To truly understand retention, we have to look at churn through two distinct lenses: customer count (often called logo churn) and financial impact (revenue churn).
- Logo Churn (Customer Churn): This tracks the raw number of accounts that leave your platform. It answers the question: Are customers staying with us?
- Revenue Churn: This tracks the financial value of the accounts that leave, measured in Monthly Recurring Revenue (MRR) or Annual Recurring Revenue (ARR). It answers the question: Are our revenue streams secure?
The distinction is critical because account sizes are rarely uniform. If you lose ten small self-serve customers paying $50 a month, your logo churn might look high, but the financial impact is minimal ($500 MRR). However, if you lose a single enterprise customer paying $10,000 a month, your logo churn is tiny, but your revenue impact is devastating.
Understanding this balance, as outlined in our Revenue Churn Glossary, prevents you from misdiagnosing the root causes of customer loss.
Customer Churn vs. Revenue Churn: Understanding the Difference
To build a reliable metric system, you must track both customer and revenue churn side-by-side. They tell completely different stories about how your product is performing in the market.
| Metric | Focus | Primary Question Answered | Best For |
|---|---|---|---|
| Customer (Logo) Churn | Headcount / Accounts | Is our product appealing and usable for the average customer? | Product-market fit, onboarding success, and user experience analysis. |
| Revenue Churn | Dollar Value (MRR/ARR) | Is our business financially sustainable and growing efficiently? | Financial planning, cash flow forecasting, and investor reporting. |
If you want to quickly test different scenarios and see how these metrics interact, you can use our SaaS Churn Rate Calculator to model your own customer and revenue numbers.
Gross Churn vs. Net Churn
When evaluating revenue churn, we must separate gross revenue churn from net revenue churn.
Gross Revenue Churn measures the absolute dollar value lost from cancellations and downgrades during a period, completely ignoring any new revenue generated from your existing customer base. It tells you the pure "leakage" of your bucket.
Net Revenue Churn factors in expansion revenue—such as upsells, cross-sells, add-on features, and plan upgrades from your surviving customers.
The formula for Net Revenue Churn is:
$$\text{Net Revenue Churn Rate} = \frac{\text{Churned MRR} + \text{Downgraded MRR} - \text{Expansion MRR}}{\text{Starting MRR}} \times 100$$
This allows net revenue churn to become a negative number. Negative churn is the holy grail of SaaS. It means that the expansion revenue from your remaining customers is outstripping the losses from those who cancelled or downgraded.
To calculate how your expansion revenue impacts your overall retention, check out our NRR Calculator to see where you stand.
Step-by-Step SaaS Churn Rate Calculation
Calculating churn accurately requires strict data hygiene. Follow this step-by-step framework to ensure your metrics remain clean and trustworthy.
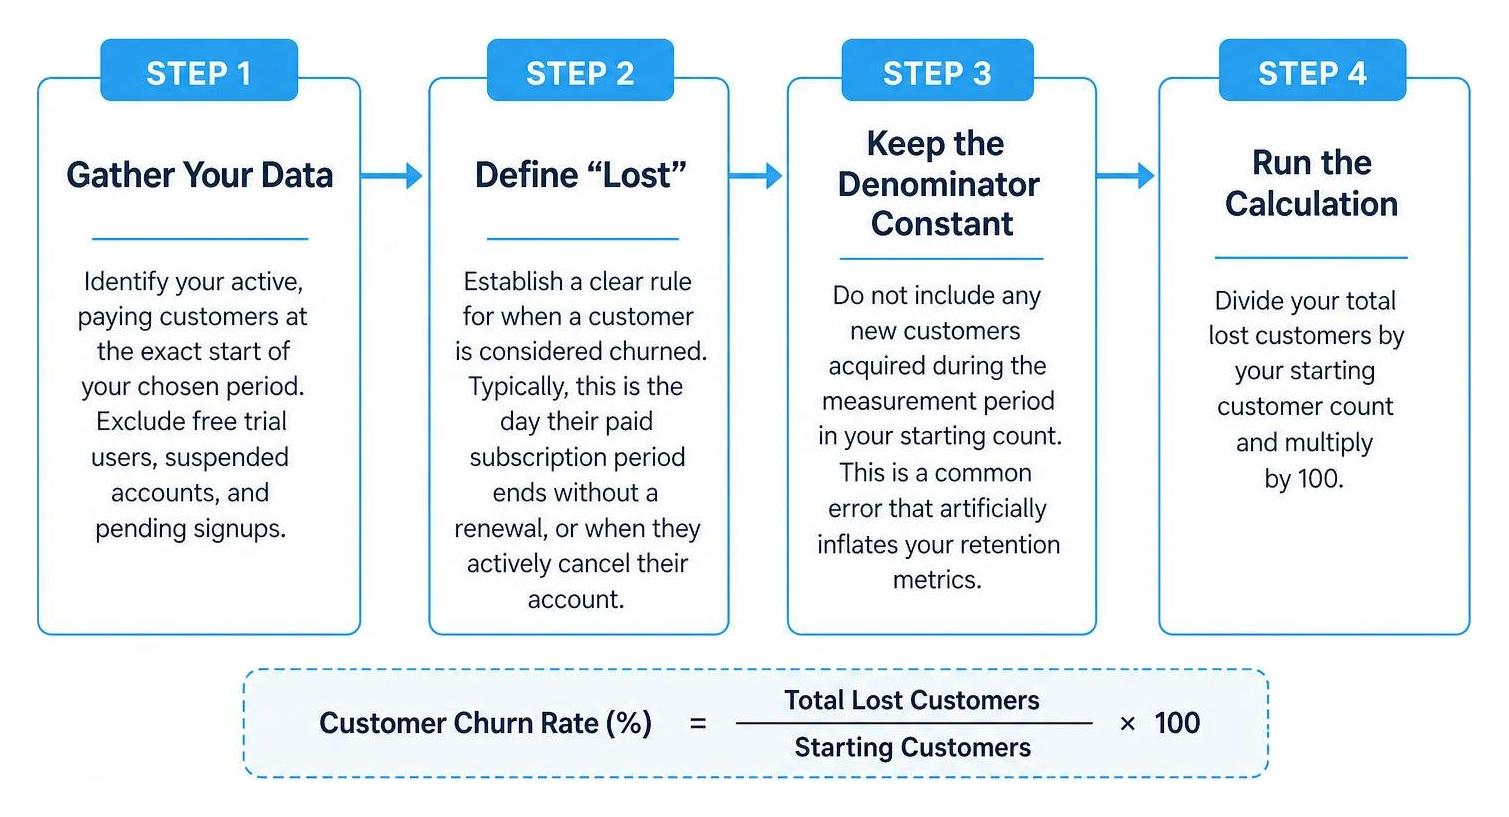
- Step 1: Gather Your Data: Identify your active, paying customers at the exact start of your chosen period. Exclude free trial users, suspended accounts, and pending signups.
- Step 2: Define "Lost": Establish a clear rule for when a customer is considered churned. Typically, this is the day their paid subscription period ends without a renewal, or when they actively cancel their account.
- Step 3: Keep the Denominator Constant: Do not include any new customers acquired during the measurement period in your starting count. This is a common error that artificially inflates your retention metrics.
- Step 4: Run the Calculation: Divide your total lost customers by your starting customer count and multiply by 100.
For a fast, interactive way to check your math, you can use our SaaS Churn Rate Calculator.
The Basic Formula for SaaS Churn Rate Calculation
The standard formula for SaaS churn rate calculation is:
$$\text{Customer Churn Rate} = \frac{\text{Customers Lost During Period}}{\text{Customers at Start of Period}} \times 100$$
While this formula works perfectly for stable, mature companies, it can run into issues during periods of rapid customer acquisition. If you are adding hundreds of new customers a week, using only the starting customer count as your denominator can distort your actual retention trends.
In these high-growth environments, finance teams sometimes opt for a midpoint adjustment formula:
$$\text{Adjusted Churn Rate} = \frac{\text{Customers Lost}}{\frac{\text{Customers at Start} + \text{Customers at End}}{2}} \times 100$$
By using the average customer count of the period, you smooth out the distortion caused by rapid mid-month growth. For more details on choosing the right mathematical approach, review our Customer Churn Rate Glossary.
Common Mistakes in SaaS Churn Rate Calculation
Even seasoned finance professionals occasionally fall into calculation traps. Here are the most common pitfalls to avoid:
- Using Ending Customer Count as the Denominator: If you include mid-month signups in your denominator, you mask your true losses. Always use the starting count.
- Including Trial Users: Trial users have not committed financial capital. Mixing them with paying customers will skew your retention metrics downward when trials naturally expire.
- Mixing Time Periods: Never compare a monthly churn rate directly to a quarterly or annual rate without normalizing the math.
- Ignoring Cohort Differences: New customers naturally churn at higher rates than customers who have been with you for over a year. Aggregating everyone into a single number can hide critical onboarding issues.
To avoid these blind spots, we recommend setting up a cohort-based tracking system. You can learn how to build one in our MRR Cohort Analysis Complete Guide.
Converting Monthly Churn to Annual Churn
A common shortcut in SaaS financial reporting is to take a monthly churn rate and multiply it by 12 to estimate annual churn. This is mathematically incorrect because churn compounds over time.
Because each month's churn applies to a smaller remaining customer base, you must use geometric normalization to convert your rates accurately.
The Compounding Effect of Monthly Churn
To convert monthly churn to an annual rate, use this formula:
$$\text{Annual Churn Rate} = 1 - (1 - \text{Monthly Churn Rate})^{12}$$
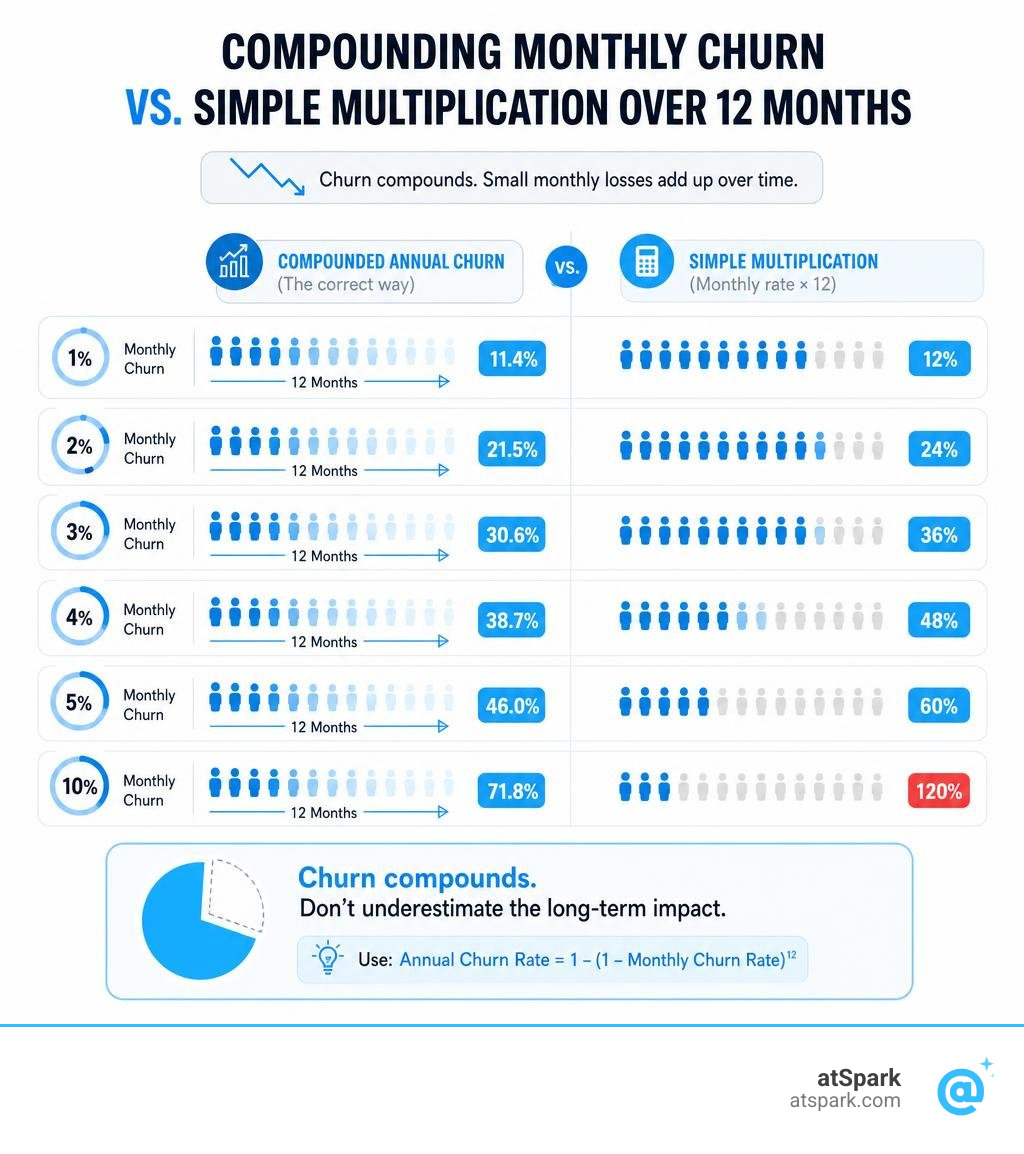
Let's look at how monthly churn rates compound over a 12-month period:
- 1% Monthly Churn = 11.4% Annual Churn
- 2% Monthly Churn = 21.5% Annual Churn
- 3% Monthly Churn = 30.6% Annual Churn
- 4% Monthly Churn = 38.7% Annual Churn
- 5% Monthly Churn = 46.0% Annual Churn
- 10% Monthly Churn = 71.8% Annual Churn
If you are comfortable with a "seemingly small" 5% monthly churn rate, you are actually accepting the loss of nearly half your customer base every single year.
This compounding decay directly impacts your customer lifetime value (LTV). If you can reduce your monthly churn from 3% to 2%, you extend your average customer lifetime from 33 months to 50 months—a 50% increase in LTV without changing your pricing or CAC.
To model how different churn rates impact your unit economics, try our LTV Calculator to project your revenue decay.
SaaS Churn Benchmarks and Business Valuation Impact
SaaS benchmarks vary wildly depending on your target customer segment, contract structure, and average contract value (ACV).
As of July 2026, the average annual SaaS churn rate sits around 3.8% overall, with B2B SaaS averaging 4.9% annually according to industry benchmarks on Statista. However, when we break this down by customer segment, the differences become clear:
- Enterprise B2B: Target < 1% monthly (under 10% annually). High ACV, custom integrations, and multi-year contracts create natural stickiness.
- Mid-Market B2B: Target 1% to 2% monthly (10% to 20% annually).
- SMB B2B: Target 3% to 5% monthly (30% to 50% annually). Small businesses have higher natural business failure rates and lower switching costs.
- B2C / Consumer: Target 5% to 10% monthly (45% to 70% annually).
If your churn rates are significantly higher than these benchmarks, it directly harms your business valuation. Venture capitalists and buyers look closely at your LTV:CAC ratio. A healthy SaaS model targets an LTV:CAC of 3:1 or higher. If your churn is high, your LTV drops, your CAC payback period expands, and your business becomes far less attractive to investors.
To understand how your retention metrics stack up against top-performing peers, explore our comprehensive guide on SaaS Customer Retention Metrics.
Strategies to Reduce SaaS Churn
To defend your recurring revenue, you need a mix of product, operational, and billing strategies:
- Optimize the First 14 Days: The vast majority of voluntary churn happens because a customer fails to find value quickly. Build guided onboarding paths and automated triggers to drive activation.
- Tackle Involuntary Churn: Payment failures (expired cards, network declines) account for 20% to 40% of overall SaaS churn. Implementing automated dunning management, card updater services, and retry logic can instantly recover this revenue.
- Incentivize Annual Contracts: Moving customers from monthly to annual billing cycles can reduce your churn by 30% to 50% by removing 11 opportunities to cancel throughout the year.
- Align Pricing with Usage: Usage-based pricing models ensure that small customers pay less while growing customers naturally scale their spend, driving expansion revenue.
Frequently Asked Questions about SaaS Churn
Is a 5% monthly churn rate acceptable for SaaS?
While a 5% monthly churn rate is often cited as a common baseline for early-stage startups, it is unsustainable for long-term growth. Because of compounding decay, 5% monthly churn means you will lose 46% of your starting customers within a single year. To stay flat, you would have to acquire almost half your customer base all over again next year, making profitable scaling nearly impossible.
What is the difference between voluntary and involuntary churn?
Voluntary churn occurs when a customer actively decides to cancel their subscription—often due to budget cuts, poor product adoption, or a competitor's offer.
Involuntary churn happens when a customer's subscription is cancelled automatically due to payment failures, such as expired credit cards, credit limits, or bank routing issues. Involuntary churn is a billing operations problem, not a product problem, and is highly preventable with the right tools.
How does churn rate impact LTV and CAC?
Customer Lifetime Value (LTV) is directly linked to your churn rate. The formula for simple average customer lifetime is:
$$\text{Customer Lifetime} = \frac{1}{\text{Monthly Churn Rate}}$$
If your monthly churn is 2%, your average customer stays for 50 months. If your churn rises to 4%, that lifetime drops to 25 months—effectively cutting your LTV in half. This directly damages your LTV:CAC ratio, meaning you must spend far more money on marketing and sales just to maintain your current revenue levels.
Conclusion: Take the Headache Out of SaaS Metrics
Calculating your churn rate shouldn't require a master's degree in spreadsheet modeling or hours of manual database queries.
At atSpark, we believe that SaaS founders, finance leaders, and RevOps teams should spend their time acting on retention insights rather than fighting with SQL. Our AI-powered analytics platform unifies your billing, CRM, and subscription data, allowing you to ask plain-English questions—like "What was our net revenue churn last month by customer cohort?"—and get instant, board-ready charts and tables.
By automating your SaaS churn rate calculation, you can spot declining usage patterns, identify at-risk enterprise accounts, and forecast your revenue with absolute confidence.
Ready to stop guessing and start growing? Explore important SaaS metrics with us today, or try our SaaS Churn Rate Calculator to run a quick health check on your current numbers.