Why Most Sales Forecasts Are Wrong — And What to Do About It
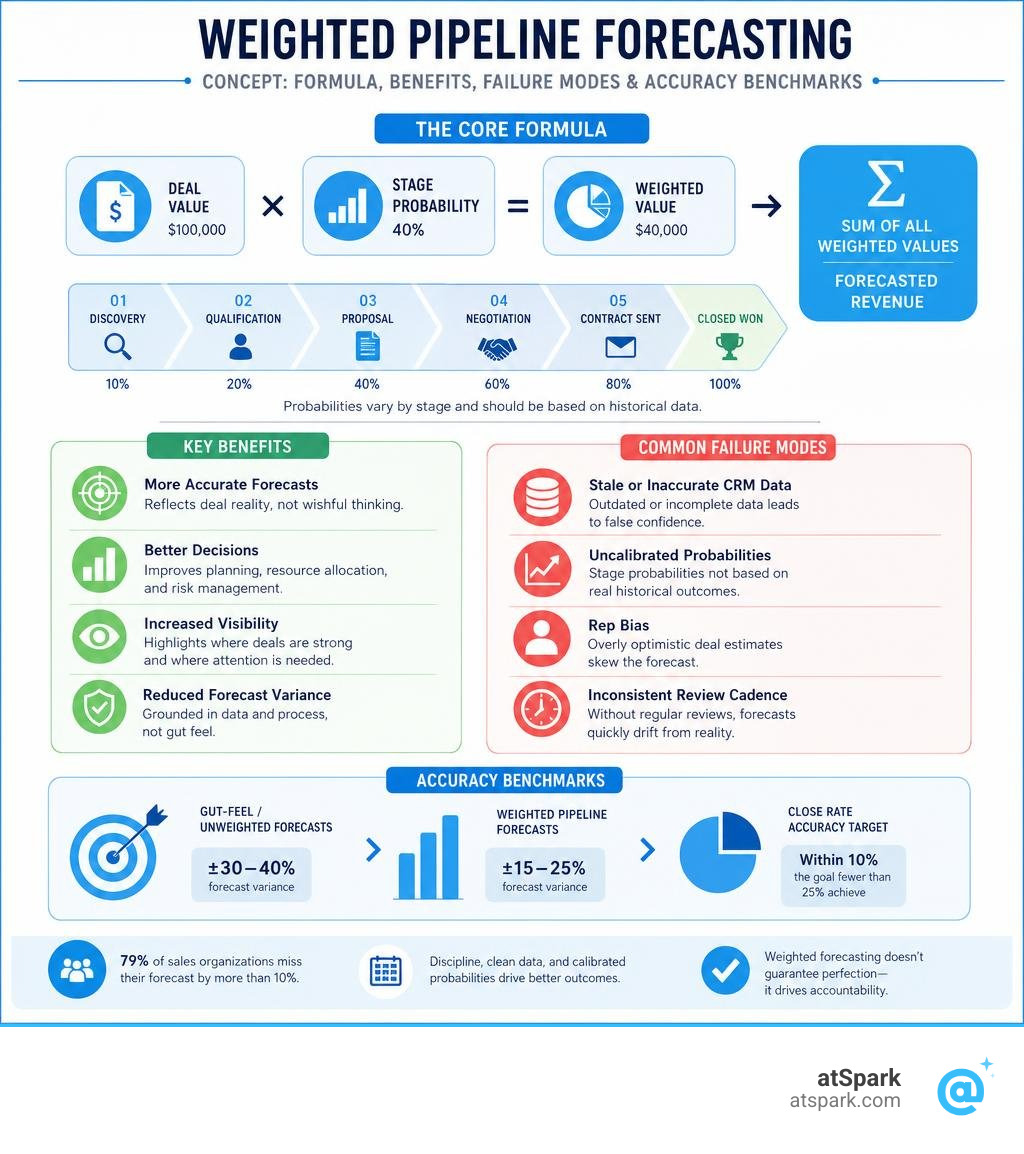
Weighted pipeline sales forecasting is the practice of multiplying each open deal's value by the probability it will close — based on its current stage — and summing those figures to produce a realistic revenue estimate.
Here's the quick version:
| Question | Answer |
|---|---|
| What is it? | A forecasting method that applies close probabilities to deals by pipeline stage |
| Core formula | Deal Value × Stage Probability = Weighted Value; sum all deals |
| Why it matters | Reduces forecast variance from ±30–40% (gut-feel) down to ±15–25% |
| Who uses it | 74% of sales organizations rely on it as their primary forecasting method |
| Biggest risk | Stale CRM data, uncalibrated probabilities, and rep bias erode accuracy fast |
| When it breaks | Small deal volumes, high deal-size variance, or long unpredictable sales cycles |
Here's the uncomfortable truth: your raw pipeline number is probably lying to you.
A $2.4M pipeline that treats every deal as a guaranteed close is not a forecast. It's a wish list. And yet that's exactly what an unweighted pipeline shows — every deal at full face value, regardless of how likely it is to actually close.
That gap between what the pipeline says and what actually closes is where quarters go wrong. According to research, 79% of sales organizations miss their forecast by more than 10%. Fewer than 25% ever hit within 10% of their actual results.
Weighted pipeline forecasting exists to close that gap. When it's set up correctly — with stage probabilities grounded in real historical data, clean CRM records, and a disciplined review cadence — it can be one of the most reliable tools a RevOps or finance leader has.
When it's set up incorrectly — which is most of the time — it just gives you a more complicated wish list.
This guide covers everything: how weighted forecasting actually works, where it breaks down, how to calibrate it properly, and when to layer in more advanced methods like forecast categories and AI-driven models.
What is Weighted Pipeline Sales Forecasting?
To understand weighted pipeline sales forecasting, we first have to look at the anatomy of a B2B sales cycle.
Every sales organization maps its customer journey through a series of sequential milestones. These milestones are called deal stages. When a new prospect enters your system, they start at the top of the funnel (e.g., Discovery) and gradually progress toward the bottom (e.g., Contract Sent) before finally reaching Closed Won or Closed Lost.
In an unweighted pipeline, a dollar is a dollar. A $100,000 deal that was qualified yesterday is treated with the exact same weight as a $100,000 deal sitting in legal waiting for a signature.
A weighted pipeline changes this by introducing the concept of probability. It recognizes that as an opportunity progresses through your Sales Pipeline Glossary, the likelihood of winning that deal increases. By assigning a close probability percentage to each of your Deal Stage Glossary, you can discount early-stage deals and give more weight to late-stage deals.
This approach provides a more balanced, statistically grounded view of expected revenue. For a deeper dive into the foundational definitions, check out the Weighted Pipeline Definition.
| Metric | Unweighted Pipeline | Weighted Pipeline |
|---|---|---|
| Treatment of Deals | All deals valued at 100% of contract value | Deals valued at a percentage of their total value |
| Core Assumption | Every deal in the pipeline has an equal chance of closing | Close likelihood increases as deals progress through stages |
| Primary Use Case | Measuring total pipeline health and coverage | Tactical revenue forecasting and resource planning |
| Inherent Bias | High risk of overestimating revenue (optimism bias) | Can underrepresent revenue if probabilities are uncalibrated |
What is the formula for weighted pipeline sales forecasting?
The math behind a weighted pipeline is straightforward. To calculate the weighted value of an individual deal, you multiply its total potential contract value by the Deal Win Probability Glossary of its current stage:
Weighted Deal Value = Total Deal Value × Stage Probability
To find your total weighted pipeline forecast for a given period, you simply sum the weighted values of every active opportunity scheduled to close within that timeframe:
Total Weighted Pipeline = Sum of (Individual Deal Value × Stage Probability)
Let's look at a concrete example. Imagine we are reviewing four active opportunities in our CRM for the current quarter:
- Deal A (Discovery Stage — 10% Probability): Valued at $50,000.
- Weighted Value: $50,000 × 0.10 = $5,000
- Deal B (Demo Completed — 30% Probability): Valued at $100,000.
- Weighted Value: $100,000 × 0.30 = $30,000
- Deal C (Proposal Sent — 50% Probability): Valued at $80,000.
- Weighted Value: $80,000 × 0.50 = $40,000
- Deal D (Negotiation — 80% Probability): Valued at $120,000.
- Weighted Value: $120,000 × 0.80 = $96,000
If we look at our unweighted pipeline, the total is $350,000 ($50,000 + $100,000 + $80,000 + $120,000). However, our weighted pipeline sales forecasting model tells us a much more realistic story: our expected revenue from these four deals is $171,000 ($5,000 + $30,000 + $40,000 + $96,000).
How does a weighted pipeline differ from an unweighted pipeline?
The primary difference lies in how they handle risk and uncertainty.
An unweighted pipeline assumes a binary world where every deal is either a 100% win or a 100% loss, but it defaults to treating them all as wins for the sake of the total sum. This creates massive forecast inflation. If a sales team has a $10M unweighted pipeline and a $3M quota, they might feel incredibly secure—until they realize that 80% of that pipeline is sitting in the "Discovery" stage with a historical win rate of only 10%.
A weighted pipeline introduces a portfolio approach to sales. It acknowledges that while we cannot predict with absolute certainty which specific deals will close, we can predict what percentage of deals at a certain stage will close based on historical patterns. This probability weighting dampens the impact of early-stage deals and gives leadership a much clearer, data-backed view of where the company will actually land at the end of the quarter.
Benefits and Strategic Value of Weighted Forecasting
For modern SaaS and B2B organizations, accurate sales forecasting is not just about giving the board a warm, fuzzy feeling. It is a critical operational input that drives key strategic decisions across the entire business.
By utilizing structured Pipeline-Weighted Techniques, finance and revenue operations teams can move away from volatile, "gut-feel" predictions and build a reliable operational baseline. Let's look at how this impacts the broader business through the lens of our Sales Forecast Glossary.
Improving Forecast Accuracy
The most immediate benefit of a weighted pipeline is the reduction of forecast variance.
When sales organizations rely on individual reps to submit their own "gut-feel" forecasts, the results carry a massive variance of roughly plus-or-minus 30% to 40% from actual outcomes. Reps are naturally optimistic; they tend to believe every deal they talk to is "highly likely" to close, or they sandbag their numbers to make their end-of-quarter performance look better.
Implementing a weighted pipeline with calibrated, historically backed stage probabilities brings that forecast variance down to plus-or-minus 15% to 25%.
Furthermore, the research shows that combining a weighted pipeline with a second forecasting method—such as historical trend analysis or AI-driven predictive forecasting—can push aggregate forecast accuracy up to 89%, compared to just 67% for teams relying on a single, unweighted method. This level of revenue predictability is what allows executive teams to make high-confidence decisions.
Optimizing Resource Allocation
A reliable weighted forecast is the foundation of sound Financial Planning & Analysis (FP&A). When finance leaders have a realistic view of upcoming revenue, they can optimize resource allocation across several departments:
- Headcount Planning: Knowing whether you will hit your revenue targets allows you to time your hiring cycles. If the weighted pipeline shows a revenue shortfall, you can pause non-essential hiring before it impacts your runway.
- Marketing Alignment: If the weighted pipeline reveals that mid-funnel deals are progressing well but top-of-funnel weighted value is dangerously low, marketing can immediately pivot resources toward lead generation campaigns to fill the gap.
- Sales Capacity and Support: Revenue leaders can identify which deals deserve extra executive support. If a $200,000 deal is in the Negotiation stage (80% probability) and a $500,000 deal is in the Qualification stage (20% probability), a sales manager can make a data-backed decision to allocate technical resources to secure the smaller, higher-probability win first.
- Reducing Budget Variance: Overly optimistic sales forecasts lead to over-hiring and budget overruns. A disciplined weighted pipeline helps SaaS companies maintain a tight grip on cash flow and avoid painful mid-year corrections.
Why Weighted Pipelines Fail: Common Challenges and Failure Modes
If weighted pipeline forecasting is so mathematically sound, why do so many teams still get it wrong? As noted in the benchmarks, fewer than 50% of teams relying on weighted pipeline forecasting achieve forecast accuracy higher than 75%.
The math itself is rarely the problem. The failure points almost always lie in human behavior, data hygiene, and structural limitations of the model itself.
The Human Element and Rep Bias
A weighted pipeline model is only as good as the data fed into it. The most common failure modes stem directly from sales rep behavior and lack of CRM discipline:
- Arbitrary CRM Default Probabilities: Many organizations simply use the default probabilities that came out of the box with their CRM (e.g., Prospecting = 10%, Proposal = 50%, Negotiation = 80%). These numbers are arbitrary fictions. If your actual historical win rate for proposals is only 22%, using a 50% multiplier will instantly inflate your forecast.
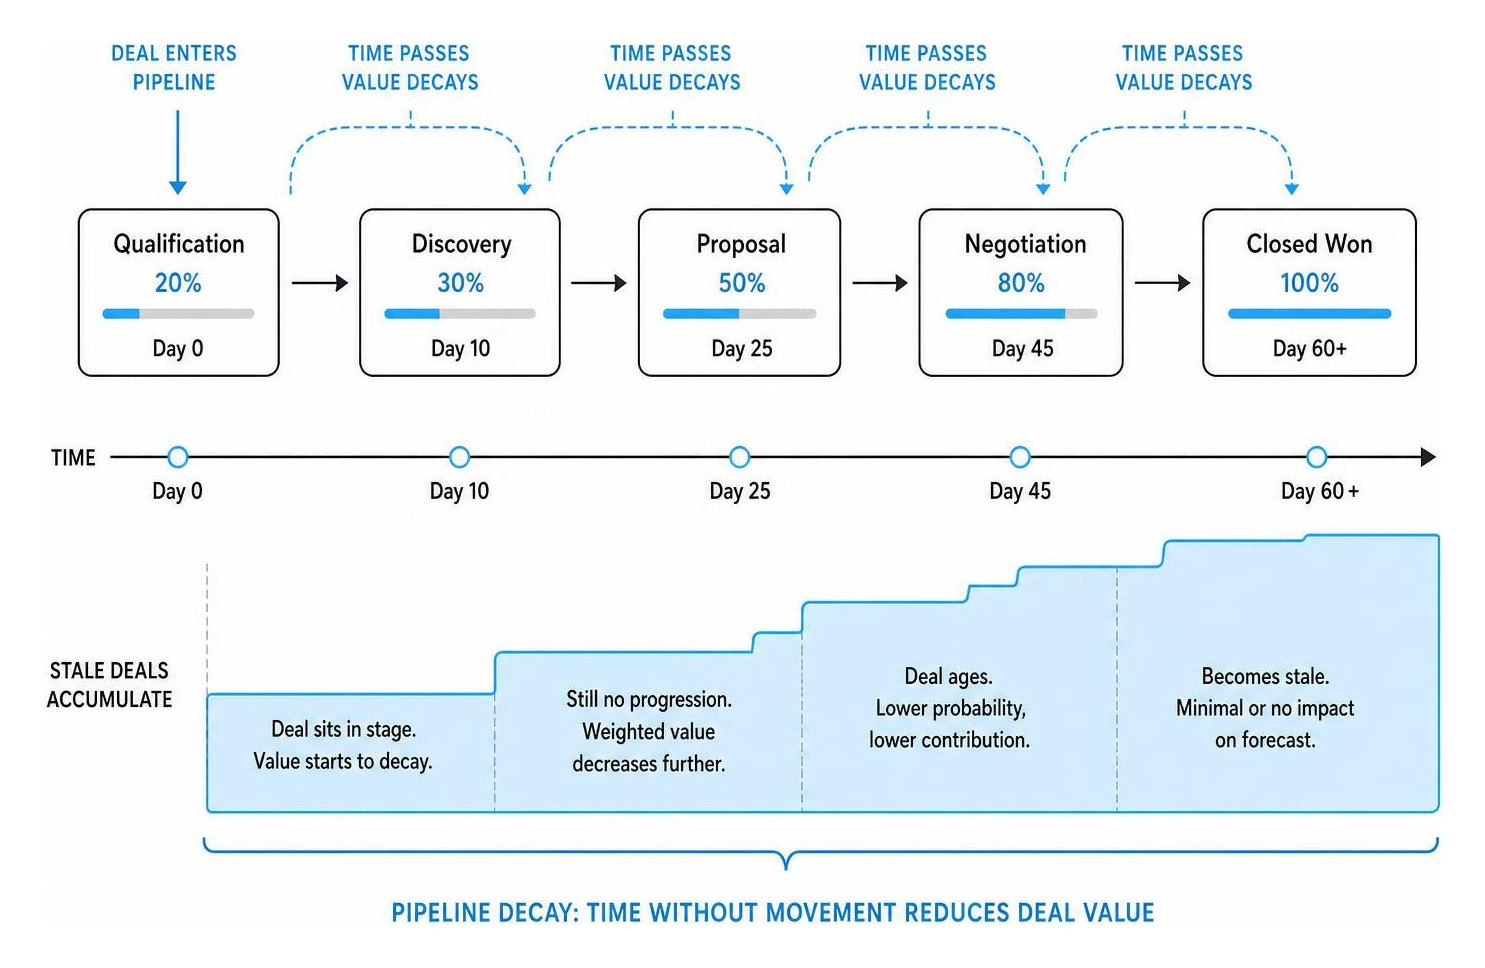
- Stale Deals and "Phantom Pipeline": Reps often leave dead or stalled deals in late stages of the CRM because they dread having difficult conversations with their managers. A deal that has been sitting in the "Negotiation" stage for 90 days with no activity is mathematically treated as an 80% win, but in reality, it is completely dead. This "phantom pipeline" severely distorts the forecast.
- Rep Sandbagging and Inflation: Some reps intentionally hold back deals in early stages to keep their managers from asking too many questions, while others inflate deal values to make their pipelines look healthy. Both behaviors break the statistical average required for weighted forecasting to work.
The Small-Team and Large-Deal Problem
The mathematical foundation of a weighted pipeline relies heavily on the law of large numbers. For the overestimations and underestimations of individual deals to naturally cancel each other out, you need a high volume of relatively uniform deals.
If your sales organization has a small deal volume or high variance in deal sizes, the weighted pipeline model completely breaks down.
Consider a company with only two active deals in its pipeline:
- Deal 1: $100,000 value at 50% probability (Weighted Value: $50,000)
- Deal 2: $10,000 value at 50% probability (Weighted Value: $5,000)
The total weighted forecast is $55,000. However, the actual real-world outcome of these two deals is binary. You will either win Deal 1 or lose it. If you win it, you make at least $100,000. If you lose it, you make at most $10,000. The predicted $55,000 is an impossible middle ground that you will never actually land on.
For smaller teams or enterprise sales motions with massive, highly volatile deals, relying solely on aggregate stage weighting is a recipe for a major forecasting miss.
How to Calibrate and Recalibrate Your Stage Probabilities
To make weighted pipeline sales forecasting actually work, you must replace arbitrary CRM defaults with custom probabilities calculated from your own historical performance. This process requires analyzing your Sales Funnel Glossary data to see how deals actually progress over time.
How often should we recalibrate weighted pipeline sales forecasting models?
Your sales environment is not static. Changes in your product, pricing, sales team composition, and overall market conditions will naturally cause your conversion rates to drift.
Because of this, you should review and recalibrate your stage probabilities every quarter at a minimum. Rebuilding your conversion models quarterly ensures that your forecast remains grounded in current sales execution capabilities rather than historical anomalies. If a stage's historical win rate has drifted by more than 5 percentage points, update your CRM settings immediately.
The Transition Matrix Method
The most accurate way to calculate your stage probabilities is by building a Markov chain-based transition matrix using 12 to 24 months of historical CRM data. Instead of just looking at the final win rate of deals that started in a certain stage, a transition matrix calculates the probability of a deal moving from any given stage to any other stage (including regression or closed-lost).
Here is how to set it up:
- Extract Deal History: Pull a report from your CRM showing every stage change for all opportunities over the past year.
- Build the Matrix: Create a grid mapping "Stage From" on the vertical axis to "Stage To" on the horizontal axis. Count how many deals made each transition.
- Convert to Probabilities: Divide the count in each cell by its row total to get the transition percentage.
- Calculate Cumulative Win Rate: Work bottom-up from your final stages to calculate the cumulative probability of reaching Closed Won from each preceding stage.
Additionally, remember to segment your pipeline. Do not mix new business, expansion, and renewal opportunities into the same model. Renewals typically carry much higher win rates than cold outbound acquisition. Combining them into a single, blended stage probability will result in a forecast that is wildly inaccurate for both segments.
Advanced Frameworks: Layering Forecast Categories and AI
As sales organizations grow and their data matures, they often outgrow simple stage-based weighted pipelines. To achieve maximum accuracy, top-performing teams layer additional qualitative and quantitative frameworks on top of their weighted models.

Layering Commit and Best Case Categories
While stage-based weighting provides a great statistical baseline, it does not account for the real-time human judgment of the sales rep and manager. To bridge this gap, organizations layer Forecast Categories on top of their pipeline.
Unlike pipeline stages (which are objective and tied to buyer actions), forecast categories represent the sales team's subjective confidence in a deal's outcome for the current period. The standard categories include:
- Pipeline: Early-stage deals with low predictability.
- Best Case: Opportunities with some risk, but a clear path to close if everything goes right (the "upside").
- Commit: High-confidence deals that the rep and manager are willing to guarantee will close this period.
- Closed: Deals that are already won.
By mapping these categories against your Pipeline Coverage Glossary, you can run a dual-layered forecast review. For example, you can compare your purely mathematical weighted pipeline total against your sales team's bottom-up "Commit + Best Case" manual forecast. If the two numbers are wildly misaligned, it flags an immediate need for a deal-by-deal pipeline review.
Transitioning to AI-Driven Predictive Models
The future of sales forecasting lies in combining historical baselines with machine learning. While a standard weighted pipeline looks at a single variable—deal stage—modern AI-powered forecasting tools analyze hundreds of historical and real-time data points simultaneously.
AI models evaluate variables such as:
- Engagement Activity: How many emails have been exchanged? Is the prospect replying within hours or days? Has the economic buyer been cc'd?
- Historical Rep Performance: Does this specific rep historically close deals at this stage, or do they suffer from late-stage slip?
- Deal Velocity: How long has this opportunity spent in the current stage compared to the historical average for won deals?
- Data Enrichment: Are the contacts associated with the deal verified, active decision-makers?
According to industry benchmarks, AI-powered forecasting can improve forecast accuracy by up to 15% compared to traditional weighted pipeline methods alone. However, AI models require massive volumes of highly clean data to train effectively. For many mid-market and growing SaaS companies, a well-calibrated, disciplined weighted pipeline remains the most practical and trusted baseline.
Frequently Asked Questions about Sales Forecasting
What is a good weighted pipeline coverage ratio?
A pipeline coverage ratio measures how much active pipeline you have compared to your sales quota.
When calculated using weighted pipeline values, a healthy coverage ratio is typically 1.5x to 2x your remaining quota. If you are using unweighted (raw) pipeline, the standard industry benchmark is 3x to 4x coverage.
However, this benchmark varies significantly by sales motion:
- SaaS/SMB (Short cycles): Needs 1.5x to 2x weighted coverage.
- Mid-Market: Needs 2x to 3x weighted coverage.
- Enterprise (Long, complex cycles): Needs 4x to 5x weighted coverage due to higher deal volatility.
When does weighted pipeline forecasting break down?
A weighted pipeline model fails to provide accurate forecasts under three main conditions:
- Low Deal Volume: If your team manages fewer than 50 active deals per quarter, statistical anomalies on individual deals will completely destroy the average.
- High Deal-Size Variance: If a single enterprise deal represents 50% of your total pipeline value, a stage-based probability calculation will produce a highly inaccurate, binary-risk forecast.
- Poor CRM Hygiene: If your reps do not regularly update close dates, deal stages, and opportunity values, the mathematical model is simply processing "garbage in, garbage out."
How does data hygiene affect forecast accuracy?
Data hygiene is the single biggest lever for improving forecast accuracy. Research shows that improving CRM data hygiene can increase forecast accuracy by up to 30%.
When contact records decay (which happens at a rate of roughly 34% per year) or when reps fail to log activity, it creates "phantom pipeline." Outdated emails, missing decision-makers, and stale close dates lead to false confidence. Cleaning your CRM data and enforcing strict entry criteria is often far more effective at fixing a broken forecast than purchasing expensive forecasting software.
Conclusion: Conversational, Governed Analytics with atSpark
Building a reliable weighted pipeline sales forecasting model is a journey that requires combining mathematical discipline, historical data analysis, and strict CRM hygiene.
But once you have calibrated your stage probabilities and cleaned up your data, how do you actually extract those insights without drowning in complex spreadsheets or waiting weeks for a data analyst to build a custom dashboard?
This is where atSpark comes in.

At atSpark, we have built an AI-powered analytics platform specifically for SaaS and B2B companies. By unifying your billing, CRM, and subscription data into a single, governed source of truth, we eliminate the friction of traditional RevOps reporting.
With atSpark, you do not need to write complex SQL queries or build fragile pivot tables to understand your pipeline. You can simply ask plain-English questions like:
- "Show me our weighted pipeline for Q3 segmented by new business vs. expansion."
- "Which deals in the Negotiation stage have had no email activity in the last 21 days?"
- "What is our current weighted pipeline coverage ratio against this quarter's quota?"
Our platform instantly generates the exact charts, tables, and insights you need, allowing your leadership team to make fast, data-backed decisions with complete confidence.
Ready to transform your sales data into a predictable revenue engine? Explore our Weighted Pipeline Glossary to learn more about mastering your sales metrics, or get in touch with us today to see how atSpark can bring conversational, code-free analytics to your organization.