Why Your SaaS ARR Growth Rate Determines Everything — Valuation, Fundraising, and Survival
Your SaaS ARR growth rate is the single most scrutinized number in your business. Investors weight it more heavily than any other metric when setting revenue multiples. Your board uses it to judge whether you're on plan. And internally, it tells you whether the decisions you made over the last 12 months actually worked.
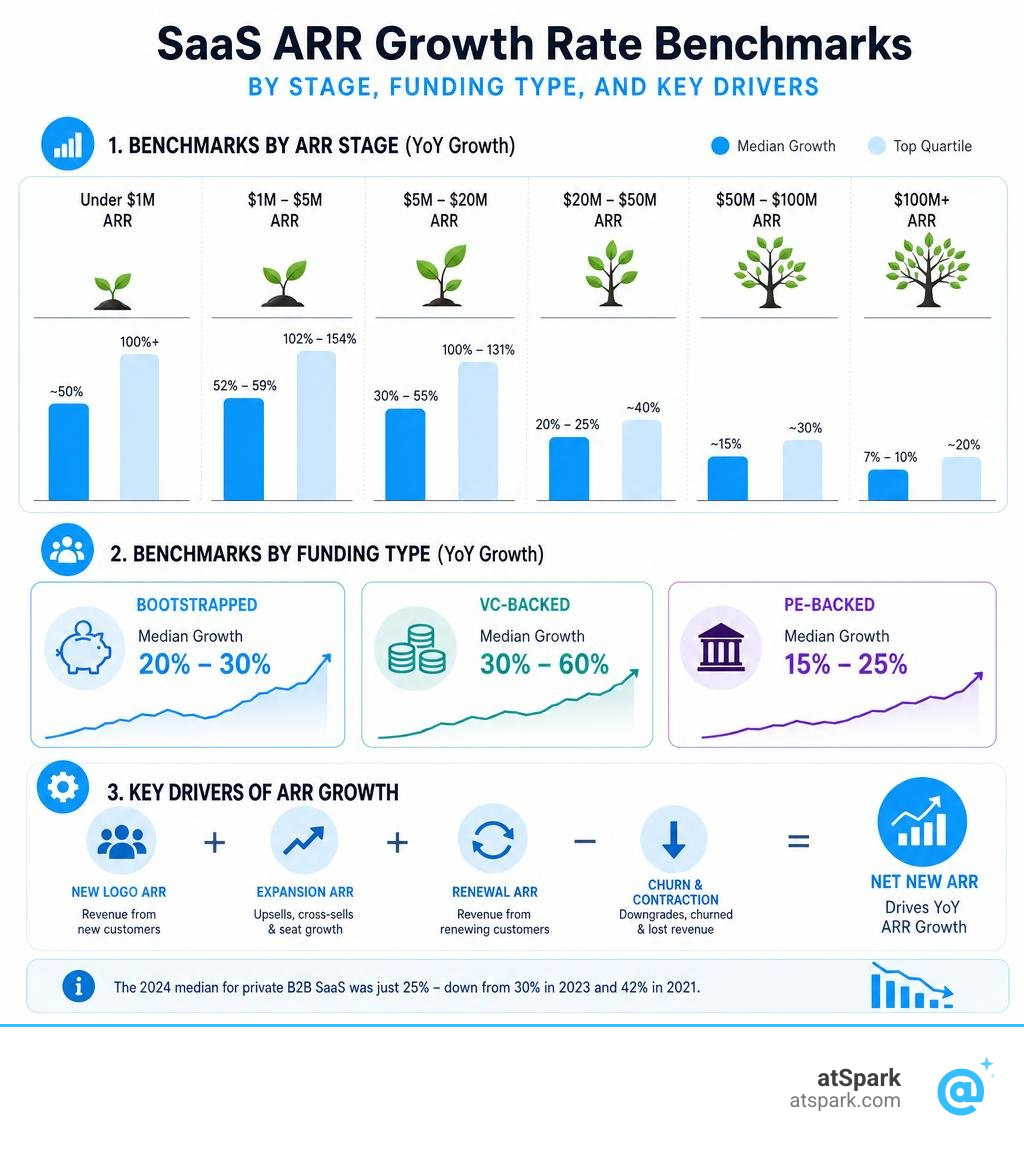
Here's a quick benchmark snapshot so you can orient yourself immediately:
| ARR Band | Median YoY Growth | Top Quartile |
|---|---|---|
| Under $1M ARR | ~50% | 100%+ |
| $1M – $5M ARR | 52% – 59% | 102% – 154% |
| $5M – $20M ARR | 30% – 55% | 100% – 131% |
| $20M – $50M ARR | 20% – 25% | 40% |
| $50M – $100M ARR | ~15% | ~30% |
| $100M+ ARR | 7% – 10% | ~20% |
The overall 2024 median for private B2B SaaS was just 25% — down from 30% in 2023 and 42% in 2021. Growth rates have compressed across every stage. If you're comparing yourself to public company benchmarks or old T2D3 playbooks, you're likely benchmarking against the wrong number.
A few things make this metric harder to use correctly than most founders and RevOps leads realize:
- The formula looks simple —
(Current ARR − Previous ARR) / Previous ARR × 100— but the inputs get corrupted constantly - The right benchmark depends entirely on your ARR band — 30% growth means something very different at $5M versus $50M
- Growth rate without context is incomplete — NRR, burn multiple, and net new ARR added all change the story
Most SaaS teams track this number. Very few benchmark it against the right peer group, calculate it cleanly, or decompose it into the components that actually explain what's driving it — or leaking from it.
This guide walks through all of it: the formula, the benchmarks by stage, the NRR connection, the valuation implications, and the most common mistakes that quietly corrupt your number before it ever reaches a board deck.
What is the SaaS ARR Growth Rate and How Do You Calculate It?
At its core, your ARR (Annual Recurring Revenue) growth rate measures the percentage change in your recurring revenue over a specific twelve-month period. It represents the compounding momentum of your subscription engine.
While many teams rely on a simplified "lazy" calculation—taking their MRR (Monthly Recurring Revenue) at the end of a month, multiplying it by 12, and comparing it to the previous year—this approach can mask underlying volatility. A truer, more robust method involves a component-level build of your revenue.
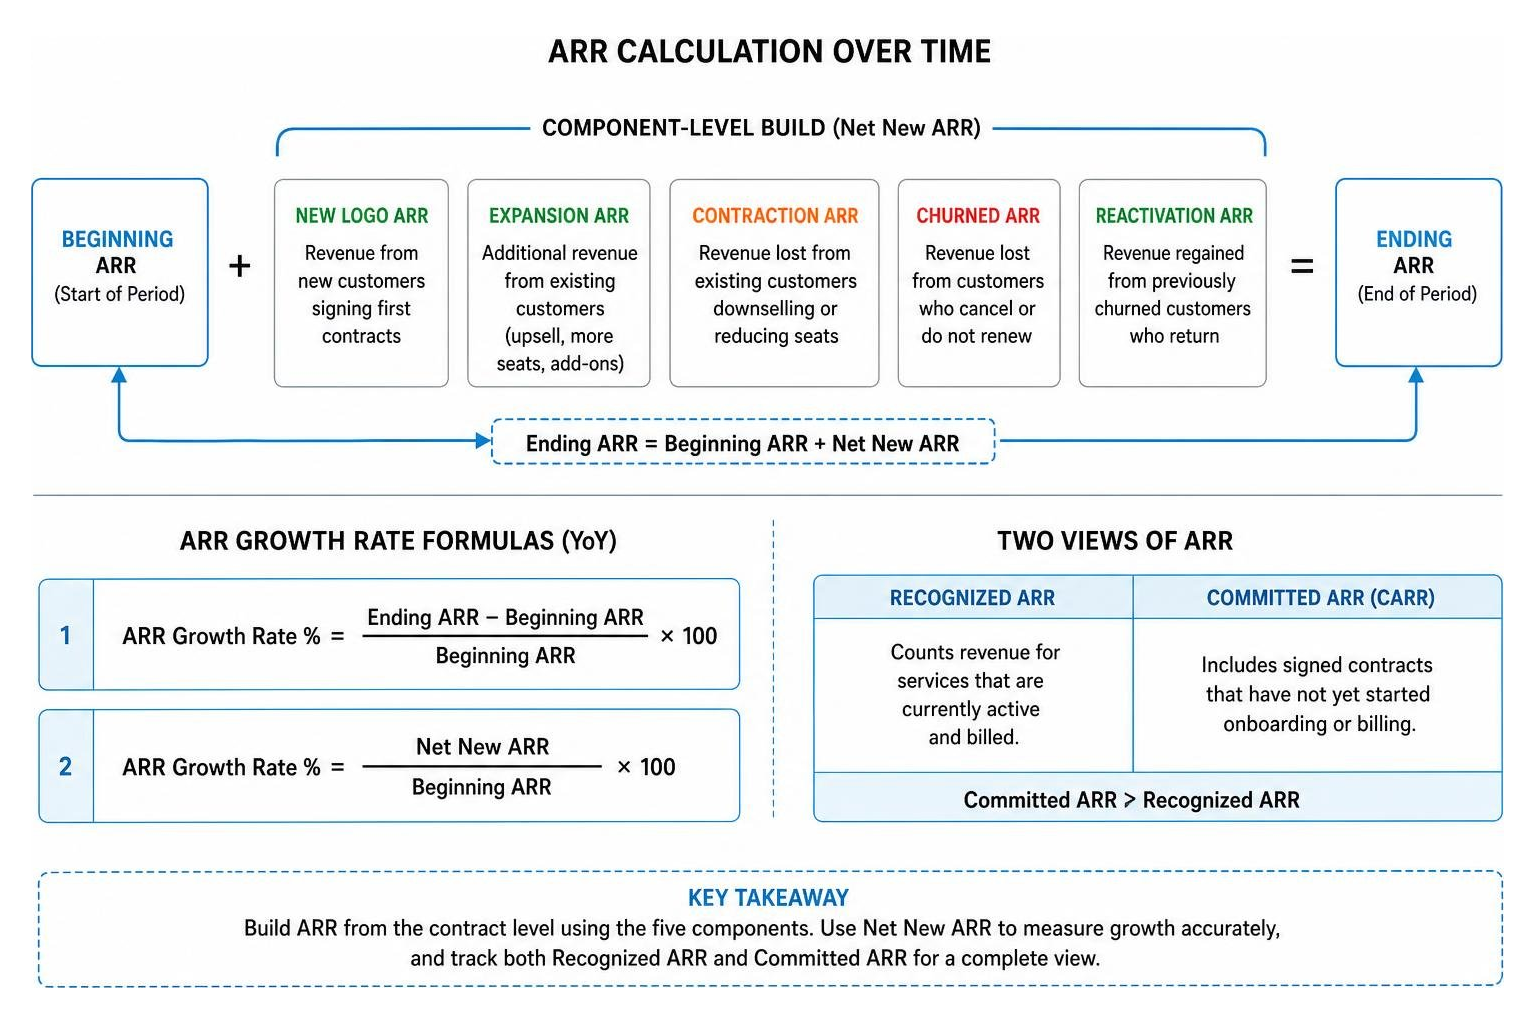
The primary formula for calculating your Year-over-Year (YoY) SaaS ARR growth rate is:
ARR Growth Rate % = ((Ending ARR - Beginning ARR) / Beginning ARR) x 100
Alternatively, you can calculate it by summing your Net New ARR generated over the period and dividing it by your starting point:
ARR Growth Rate % = (Net New ARR / Beginning ARR) x 100
To make sure your calculations align with standard institutional definitions, you can utilize tools like the ARR Calculator: Free Tool + 2026 Benchmarks. This helps you keep your inputs clean and prepares you for investor diligence.
The Component-Level Build
To calculate ARR correctly, you must build it from the contract level upward. This means tracking five distinct movements for every single customer account:
- New Logo ARR: Revenue added from entirely new customers signing their first contracts.
- Expansion ARR: Additional revenue from existing customers upgrading their plans, buying more seats, or purchasing add-on features.
- Contraction ARR: Revenue lost when existing customers downgrade their plans or reduce seat counts, but do not churn entirely.
- Churned ARR: Revenue completely lost when a customer cancels their subscription or fails to renew.
- Reactivation ARR: Revenue regained from historical customers who had churned but have returned to a active paid plan.
When performing this calculation, you must also distinguish between Committed ARR (CARR) and Recognized ARR.
- Recognized ARR only counts revenue for services that are currently being active and billed.
- Committed ARR (CARR) includes signed contracts that have not yet started onboarding or billing.
While CARR is an excellent leading indicator for internal capacity planning, quoting CARR as active ARR during fundraising is one of the fastest ways to fail due diligence.
Why Your SaaS ARR Growth Rate Differs from MRR Growth
It is common for early-stage founders to confuse their annual growth rate with their MRR Growth Rate. While closely related, they serve completely different audiences and operational needs.
Your MRR growth rate is typically measured Month-over-Month (MoM). It is an operational monitoring tool used by product, marketing, and sales teams to gauge immediate traction, run quick experiments, and identify short-term demand anomalies.
However, because monthly revenue can fluctuate due to billing cycles, seasonal factors, or localized churn spikes, MoM growth is too volatile for long-term strategic planning or investor reporting.
For early-stage companies where YoY comparisons are less meaningful due to a small starting base, the Compound Monthly Growth Rate (CMGR) is often used as a more honest metric. CMGR smooths out monthly spikes to show your average monthly compounding rate:
CMGR = ((Ending MRR / Beginning MRR) ^ (1 / n)) - 1
Where n is the number of months in the period. For example, growing from $2M to $4M ARR over 12 months is equivalent to a 5.9% CMGR.
While early-stage SaaS companies with mostly monthly billing may grow the fastest on a MoM basis, mature enterprise SaaS companies with annual or multi-year contracts rely almost exclusively on YoY ARR growth. YoY ARR growth normalizes these longer contract cycles, providing a clear picture of year-over-year expansion and retention.
Common Mistakes in Calculating Your SaaS ARR Growth Rate
When preparing reports for the board or potential buyers, accuracy is everything. Several common mistakes can artificially inflate your headline growth rate, creating a gap that will be uncovered during professional audits:
- Including One-Time Fees: Setup charges, professional services, onboarding fees, and custom development work are non-recurring. They must be completely excluded from ARR.
- Over-Annualizing Short-Term Contracts: Annualizing a single 30-day usage spike or a one-month pilot contract into "12x MRR" creates fake ARR that will inevitably contract or churn.
- Ignoring Contract Duration: True ARR calculations should only include contractually committed revenue. If a customer is on a monthly plan with no long-term commitment, it is safer to treat it as annualized MRR rather than strict, committed ARR.
- Double-Counting Expansion and Reactivations: Failing to cleanly segment expansion revenue from reactivated accounts can lead to double-counting, giving a false sense of customer success performance.
Benchmarking Your Annual Growth by Revenue Band and Stage
Setting growth targets requires comparing your business to peers at the same scale. Expecting a $30M ARR company to grow at the same percentage rate as a $2M ARR startup is unrealistic. Growth naturally decelerates as your revenue base expands—a phenomenon known as growth decay.
To see where your business stands, we can evaluate your performance against the latest ARR Growth Rate Benchmarks for SaaS | knowledgelib.io. Let's look at how these expectations change as you scale, drawing from comprehensive SaaS Growth Metrics and SaaS Business Metrics.
Bootstrapped vs. VC-Backed Growth Realities
A common misconception is that venture-backed SaaS companies always grow significantly faster than bootstrapped ones. While VC-backed companies often have higher top-quartile performance due to aggressive capital deployment, the median gap is surprisingly small.
According to research on private B2B SaaS companies:
- Bootstrapped companies reported a median growth rate of 23%.
- Equity-backed companies reported a median growth rate of 25%.
The real difference lies in efficiency. Bootstrapped companies must prioritize capital efficiency and profitability, meaning their growth is organic and sustained by customer revenue. VC-backed companies, on the other hand, are often expected to chase high-velocity growth paths, even if it means carrying a high burn multiple.
How to Benchmark Your Annual Growth Against the T2D3 Rule
For venture-backed startups, the gold standard has historically been the T2D3 framework (Triple, Triple, Double, Double, Double). This model outlines a path to scale from $1M ARR to $100M+ ARR in five years:
- Year 1: $1M to $3M ARR (200% growth)
- Year 2: $3M to $9M ARR (200% growth)
- Year 3: $9M to $18M ARR (100% growth)
- Year 4: $18M to $36M ARR (100% growth)
- Year 5: $36M to $72M ARR (100% growth)
While T2D3 is a popular framework in venture capital presentations, it is an aspirational outlier. In reality, fewer than 5% of VC-backed SaaS companies sustain this path.
Most software companies experience a gradual growth decay rather than hitting a wall all at once. The median startup drops from 65% growth to 28% within a single year. Only 18% of startups manage to maintain or improve their growth rate year-over-year.
Benchmarks for Early-Stage SaaS (Under $5M ARR)
At the early stage, your primary goal is proving product-market fit and establishing a repeatable sales motion.
For companies in the $1M to $5M ARR range, the median YoY ARR growth rate typically sits between 52% and 59%. However, to be competitive for a top-tier Series A, you generally need to be in the top quartile, which requires a growth rate between 102% and 154%.
Your growth velocity at this stage is heavily influenced by your customer acquisition strategy. SaaS companies generally fall into different categories based on their target account sizes:
- Rabbit Hunters: Companies targeting small accounts paying around $100/month. Roughly 53% of SaaS and AI companies reach their first $10k MRR this way.
- Deer Hunters: Companies targeting mid-market accounts paying $300 to $2,999/month. Deer hunters grow the fastest, often scaling 3-5x faster than rabbit or mouse hunters because they balance healthy deal sizes with manageable sales cycles.
At this stage, tracking your Net New MRR monthly is critical to ensuring your customer acquisition pace is outstripping churn.
Benchmarks for Mid-Stage and Scale SaaS ($5M to $50M+ ARR)
As you scale from $5M to $15M ARR, median growth rates typically compress to 46% to 55%, with the top quartile performing between 100% and 131%.
Once a company passes $20M ARR (typically Series B and Series C stages), the narrative shifts from raw growth to an efficiency story. At this scale, a median growth rate of 20% to 35% is considered solid, while anything above 40% to 50% puts you in the top quartile.
To put this in perspective, look at the public SaaS market. Even public companies with hundreds of millions in revenue show a wide spread of growth rates:
- High Growth Leaders: Rubrik (54%), PegaSystems (50%), AppLovin (40%), Palantir (39%), Klaviyo (33%), and Monday.com (30%).
- Steady Scale Performers: Snowflake (26%), DataDog (25%), Gitlab (27%), Cloudflare (27%), and Crowdstrike (20%).
- Mature Giants: Salesforce (8%), Zoom (3%), and ZoomInfo (-1.4%).
As your revenue base grows, maintaining high percentage growth rates becomes mathematically harder. This is why investors look closely at the operational levers driving your numbers.
Decomposing Your Growth: The Operational Levers That Drive ARR
A single headline ARR growth rate can be misleading. For example, two companies might both report 40% YoY growth, but their underlying business health could be completely different:
- Company A achieves 40% growth by acquiring a high volume of new logos, but suffers from 20% annual churn.
- Company B achieves 40% growth by maintaining a 95% gross retention rate and driving strong expansion within its existing customer base.
Company B has a much more durable and valuable business model. To understand the health of your growth, you must decompose your Net New ARR for board and investor reporting.
Your Net New ARR is driven by four primary operational levers:
- New Logo Acquisition: The efficiency of your sales and marketing teams in winning new customers.
- Net Revenue Retention (NRR): Your ability to keep and expand revenue from existing accounts.
- Churn Reduction: Minimizing the revenue leaving your business.
- Pricing and Packaging: Optimizing your plan catalog and pricing tiers. Research shows a positive correlation between plan count and revenue; businesses with broader plan catalogs show higher ARR growth and stronger customer growth velocity.
The NRR Connection: Why Retention is the Secret Growth Engine
Your NRR (Net Revenue Retention) is often the most underweighted driver of long-term ARR growth. NRR measures the percentage of recurring revenue retained from existing customers over a given period, including expansion but deducting contraction and churn.
NRR = ((Starting ARR + Expansion ARR - Contraction ARR - Churned ARR) / Starting ARR) x 100
The math is simple: companies with NRR over 100% grow 1.5x to 3x faster than their peers.
If your NRR is 115%, your business will grow by 15% year-over-year even if you don't acquire a single new customer. This is why top-performing SaaS companies focus heavily on customer success and account management to drive Expansion MRR. For companies scaled to $15M–$30M+ ARR, expansion revenue often contributes up to 40% of their total growth.
To deeply understand these dynamics, running a cohort analysis is essential. Using a resource like the MRR Cohort Analysis Complete Guide helps you track how specific customer groups expand or contract over their lifecycle, revealing whether your product is truly sticky.
Connecting Growth to the Rule of 40 and Valuation Multiples
Your ARR growth rate is also the primary input for the Rule of 40, a classic health metric for SaaS businesses. The Rule of 40 states that a company's growth rate plus its profit margin (typically EBITDA margin or Free Cash Flow margin) should equal or exceed 40%.
Rule of 40 Score = YoY ARR Growth Rate % + Profit Margin %
In the current market, capital efficiency is highly valued. Investors use your burn multiple—the ratio of net cash burned to net new ARR added—to evaluate how efficiently you are generating growth.
Burn Multiple = Net Cash Burned / Net New ARR Added
A burn multiple under 1.0x is considered amazing, while anything above 2.0x raises questions about GTM efficiency.
Your growth rate and efficiency metrics directly impact your valuation multiples. High-growth companies (100%+ YoY) with strong efficiency can command 8-15x ARR valuation multiples, while slower-growing companies (under 20% YoY) are often valued on EBITDA or lower revenue multiples.
Frequently Asked Questions About Annual Recurring Revenue Growth
What is a good annual growth rate for a bootstrapped company?
For a bootstrapped SaaS company, a "good" growth rate is highly dependent on your scale, but generally ranges between 15% and 30% annually once you are past $1M ARR.
Because bootstrapped companies do not have external capital to fund high-burn marketing campaigns, they must prioritize profitability and cash flow. A 25% growth rate with a 15% net profit margin is often healthier and more sustainable for a bootstrapped founder than 50% growth with high cash burn.
How does usage-based pricing affect ARR growth calculations?
Usage-based pricing introduces revenue volatility into your ARR calculations. Because customers pay based on consumption (e.g., API calls, data stored, or compute hours), your monthly revenue can fluctuate.
To manage this, many usage-based SaaS companies use a hybrid pricing model—combining a predictable base subscription with a usage-based overage. Hybrid models tend to deliver the highest retention, with a median NRR of 110% and top-quartile NRR reaching 117%. When calculating ARR for purely usage-based models, teams often use a trailing 3-month average to smooth out short-term consumption spikes.
Should one-time setup fees be included in ARR calculations?
No. One-time setup fees, onboarding charges, custom integrations, and professional services must always be excluded from your ARR.
ARR stands for Annual Recurring Revenue. Since these fees are non-recurring and cannot be expected to renew next year, including them inflates your metrics and will be flagged as an error during financial audits or investor due diligence.
Conclusion
Your SaaS ARR growth rate is more than just a headline percentage to share in board meetings—it is a reflection of your product-market fit, GTM efficiency, and customer retention. Managing this metric effectively requires clean data, proper segmentation, and the right tools.
At atSpark, we help SaaS companies eliminate spreadsheet errors and gain real-time visibility into their subscription data. Our AI-powered analytics platform unifies your billing, CRM, and subscription data, allowing you to ask plain-English questions and instantly generate accurate charts, tables, and cohort analyses—all without needing SQL or engineering support.
If you are ready to stop guessing and start tracking your metrics with institutional-grade accuracy, explore our guide on Important SaaS Metrics and see how we can help you streamline your financial reporting.