Why Connecting Power BI to Salesforce Is Harder Than It Looks
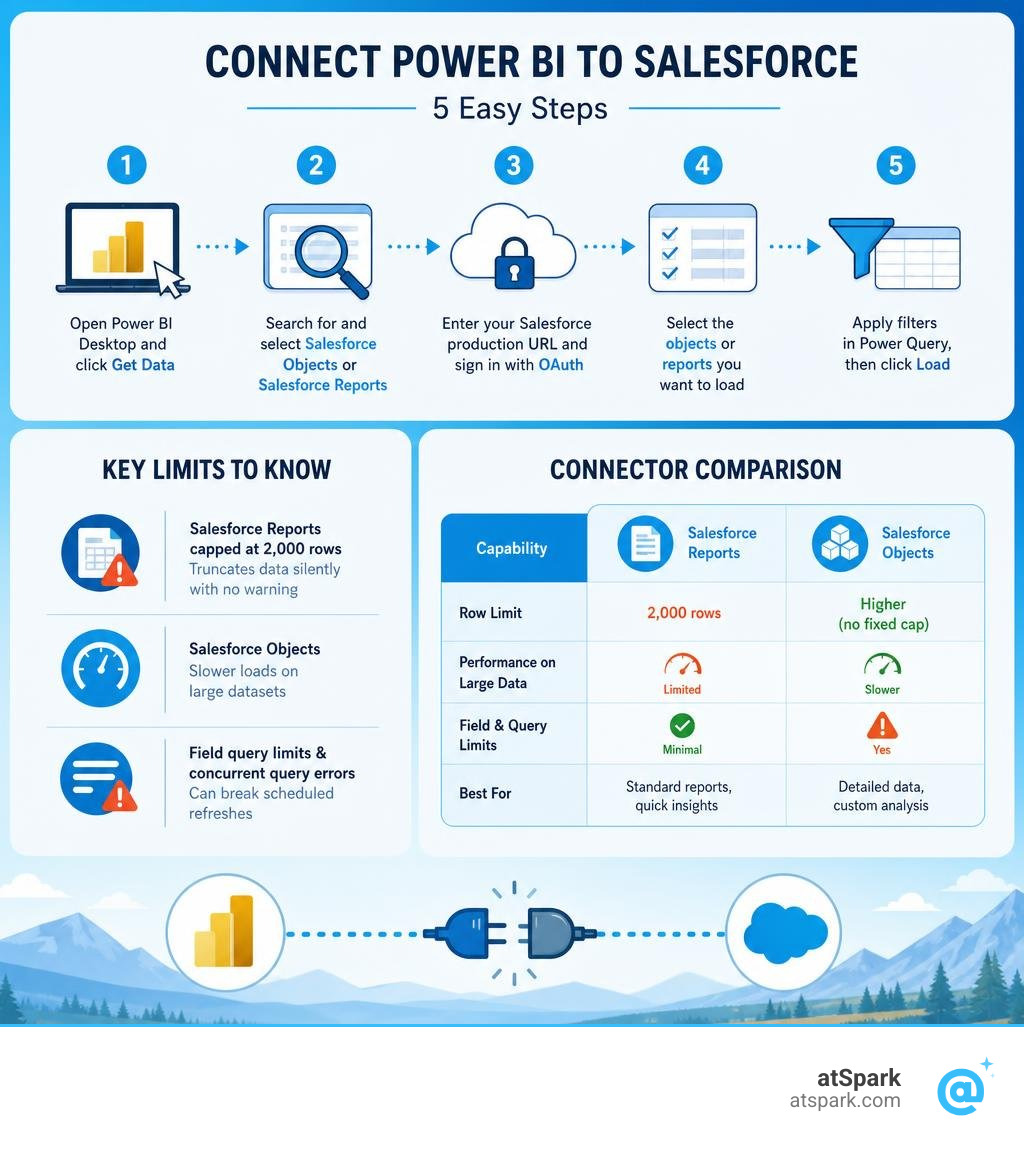
To connect Power BI to Salesforce, follow these five steps:
- Open Power BI Desktop and click Get Data
- Search for and select either Salesforce Objects or Salesforce Reports
- Enter your Salesforce production URL and sign in with OAuth
- Select the objects or reports you want to load
- Apply filters in Power Query, then click Load
If you've ever tried to pull your Salesforce pipeline into Power BI for a board meeting, you already know the frustration.
The setup looks simple. Click a few buttons, sign in, done. But then your report only shows 2,000 rows. Or the refresh breaks overnight. Or your Salesforce admin has to get involved because of an OAuth error you've never seen before.
These aren't edge cases. They're the standard experience for anyone connecting these two platforms at any real scale.
The native Salesforce Reports connector in Power BI is capped at 2,000 rows — and here's the part that stings: it truncates your data silently, with no warning or error message. If you're a RevOps or Finance lead trying to report on thousands of opportunities, leads, or accounts, you may have been making decisions on incomplete data without knowing it.
The Salesforce Objects connector can pull more records, but it comes with its own tradeoffs — slow loads on large datasets, field query limits, and concurrent query errors that crash your scheduled refreshes.
This guide walks you through exactly how to make the connection work, what limits to watch for, and how to get clean, complete Salesforce data into Power BI without the guesswork.
Prerequisites for Connecting Power BI to Salesforce
Before we click a single button in Power BI, we must ensure both our Salesforce and Microsoft Power BI environments are configured correctly. Skipping these prerequisites is the number one cause of connection failures.
Salesforce Subscription and API Access
First, your Salesforce subscription must support API access. Salesforce Developer, Enterprise, Unlimited, and Performance editions have API access enabled by default. If you are on a Professional edition, your organization may need to purchase API access as an add-on.
Please note that Salesforce trial accounts do not have API access. If you are testing this workflow in a sandbox or a trial environment, verify with your Salesforce administrator that the API Enabled permission is checked in your user profile settings.
Power BI Licensing
To build reports in Power BI Desktop, you only need the free version. However, if you plan to publish your reports to the cloud, share them with colleagues, or configure automated data refreshes, you will need a Power BI Pro or Premium Per User (PPU) license.
2026 Reporting Standards and Security
As of July 2026, security standards require secure, modern authentication protocols. Salesforce has deprecated older API versions and strictly enforces Multi-Factor Authentication (MFA) and OAuth 2.0. To avoid connection drops, your Salesforce user account must be configured with a permission set that allows API logins while satisfying your company's SSO and MFA requirements.
How to Connect Power BI to Salesforce in 5 Steps
Now that your permissions are in order, let us walk through the native connection process. Power BI Desktop provides two primary native options: the Objects connector and the Reports connector.
Here is a quick comparison of how they behave under production conditions:
| Feature | Salesforce Objects Connector | Salesforce Reports Connector |
|---|---|---|
| Row Limit | None (retrieves all records in the table) | Hard limit of 2,000 rows (silently truncated) |
| Speed | Can be slow on massive tables | Very fast for small datasets |
| Ease of Use | Requires manual table relationships and filtering | Highly convenient; all columns are pre-joined |
| API Call Consumption | High (queries entire tables) | Low (queries pre-aggregated reports) |
Step 1: Choose Your Connector to Connect Power BI to Salesforce
Open Power BI Desktop. On the Home ribbon, click Get Data and select More... to open the full catalog of sources. In the search bar, type "Salesforce."
You will see two distinct options:
- Salesforce Objects
- Salesforce Reports
For a deep dive into the technical capabilities of each, you can refer to the official Power Query Salesforce Objects connector documentation or the Power Query Salesforce Reports connector documentation.
For most scalable deployments, we recommend choosing Salesforce Objects to ensure you do not run into the silent 2,000-row truncation limit. Select your chosen option and click Connect.
Step 2: Configure the Connection Settings
Once you select your connector, a configuration window will appear. Here, you must choose your environment:
- Production: Use this for your live Salesforce instance. This defaults to the standard login URL (https://login.salesforce.com/).
- Custom: Select this if your company uses a custom domain (e.g., https://yourcompany.my.salesforce.com/) or if you are connecting to a Salesforce Sandbox.
Tip: Do not use Lightning URLs (which contain ".lightning.force.com") because they are not supported by the Power BI connector. Always use your standard MyDomain URL.
Under the advanced options, you can also specify the relationship columns to load or target a specific Salesforce API version. If you run into missing tables, you can manually override the API version in Power Query's Advanced Editor by adding the ApiVersion parameter to your query string, such as setting ApiVersion to 54.0 or higher.
Step 3: Authenticate and Sign In
After clicking OK, Power BI will prompt you to authenticate.
- Click Sign in.
- A browser window or pop-up will open directing you to the Salesforce login portal.
- Enter your Salesforce credentials.
- If your company enforces Multi-Factor Authentication (MFA) or Single Sign-On (SSO), complete the secondary verification step.
- Salesforce will ask you to grant Power BI permission to access your data. Click Allow.
Once the connection is successful, return to Power BI Desktop and click Connect.
Note on Session Settings: If your Salesforce administrator has enabled the setting "Lock sessions to the IP address from which they originated," your Power BI cloud refreshes will fail. Ask your admin to disable this setting for integration users to ensure stable refreshes.
Step 4: Select and Filter Your Salesforce Data
Power BI will now display the Navigator window, showing a list of available tables (for Objects) or custom reports (for Reports).

If you chose the Objects connector, search for the tables you need — such as Account, Contact, Lead, or Opportunity. Check the boxes next to the tables you want to import.
Instead of clicking "Load" immediately, we highly recommend clicking Transform Data. This opens the Power Query Editor, where you can filter out old records (e.g., filtering out opportunities closed before 2025) and remove unnecessary columns. Filtering at this stage reduces the amount of data Power BI has to process, saving memory and keeping your reports fast.
Step 5: Load Data and Build Your SaaS KPI Dashboard
Once you have filtered and cleaned your columns in Power Query, click Close & Apply in the top-left corner. Power BI will now pull the data from Salesforce and load it into its in-memory data model.
With your Salesforce data successfully loaded, you can begin constructing your custom SaaS KPI Dashboard to monitor critical operational metrics. By combining object tables like Accounts, Opportunities, and Leads, you can track the exact SaaS Metrics to Track that your executive team needs to see daily.
Overcoming Key Limitations of Native Salesforce Connectors
While the native connectors are great for simple models, they come with technical limitations that can disrupt enterprise-level reporting. Understanding these boundaries will save you hours of debugging.
Bypassing the 2,000-Row Limit to Connect Power BI to Salesforce
If you connect to Salesforce Reports, the API enforces a hard cap of 2,000 rows. If your underlying Salesforce report has 5,000 rows, Power BI will pull the first 2,000 and stop — without throwing an error.
To bypass this limit, you have a few options:
- Use the Objects Connector: The Objects connector does not have a row limit. You can pull the raw tables and reconstruct your report logic inside Power BI using DAX and Power Query.
- Power Query Parameters: You can filter your tables dynamically by date ranges or regions using Power Query parameters to pull manageable chunks of data.
- Incremental Refresh: For massive tables, configure Incremental Refresh in Power BI. This setup ensures that Power BI only pulls newly created or modified records during each refresh cycle rather than downloading millions of rows every time.
Managing API Limits and Concurrent Queries
Salesforce limits the number of API calls your organization can make in a 24-hour period. If you have several Power BI datasets refreshing multiple times a day, you can quickly exhaust your API quota, locking out other integrations.
Additionally, Salesforce limits the number of concurrent queries a single account can run. If Power BI attempts to run multiple queries at the same time using the same credentials, Salesforce will block them, resulting in the dreaded INVALID_QUERY_LOCATOR error.
To manage these limits and protect your SaaS Business Metrics reports:
- Avoid scheduled refreshes that overlap with other heavy system integrations.
- Use Power BI Dataflows to stage your Salesforce data. A dataflow can pull the data from Salesforce once a day and store it within Power BI's internal storage. Multiple reports can then query the dataflow without hitting the Salesforce API again.
Configuring Automated Refresh and Troubleshooting Connection Errors
Once your report is built and published to the Power BI Service, you will want to schedule automated refreshes so your team always sees current data.
Resolving OAuth and Publishing Errors
A common point of failure occurs when a report works perfectly on Power BI Desktop but fails to publish or refresh in the cloud. Typically, this presents as an OAuth authentication error.
To resolve this, your Salesforce administrator must install and approve the official Microsoft Power BI applications within your Salesforce organization.
Have your administrator verify the following settings:
- Navigate to Connected Apps Approved Apps in Salesforce.
- Ensure PowerBI Query and PowerBI Query Refresh are listed and approved.
- Set Permitted Users to Admin approved users are pre-authorized.
- Set IP Relaxation to Relax IP restrictions.
- If your organization enforces strict Single Sign-On (SSO) or Multi-Factor Authentication (MFA), ensure that the integration account has an OAuth exemption or is configured to use refresh tokens that do not expire rapidly.
For step-by-step community workarounds on this exact issue, check out this thread on Troubleshooting Salesforce publishing errors.
Managing Authentication Tokens and Session Settings
Salesforce limits applications to five active authentication tokens per user account. If you import more than five separate Salesforce datasets into Power BI using the same credentials, older connections will lose their authentication tokens, causing scheduled refreshes to fail silently.
To manage this, keep your imported Salesforce datasets to five or fewer per integration user, or consolidate your tables into unified data models. Managing these connections carefully is essential For RevOps teams who rely on stable, unbroken data pipelines to track sales funnels and commissions.
To monitor your active connections, you can track your scheduled refreshes against your system health dashboards to ensure your pipeline remains reliable:
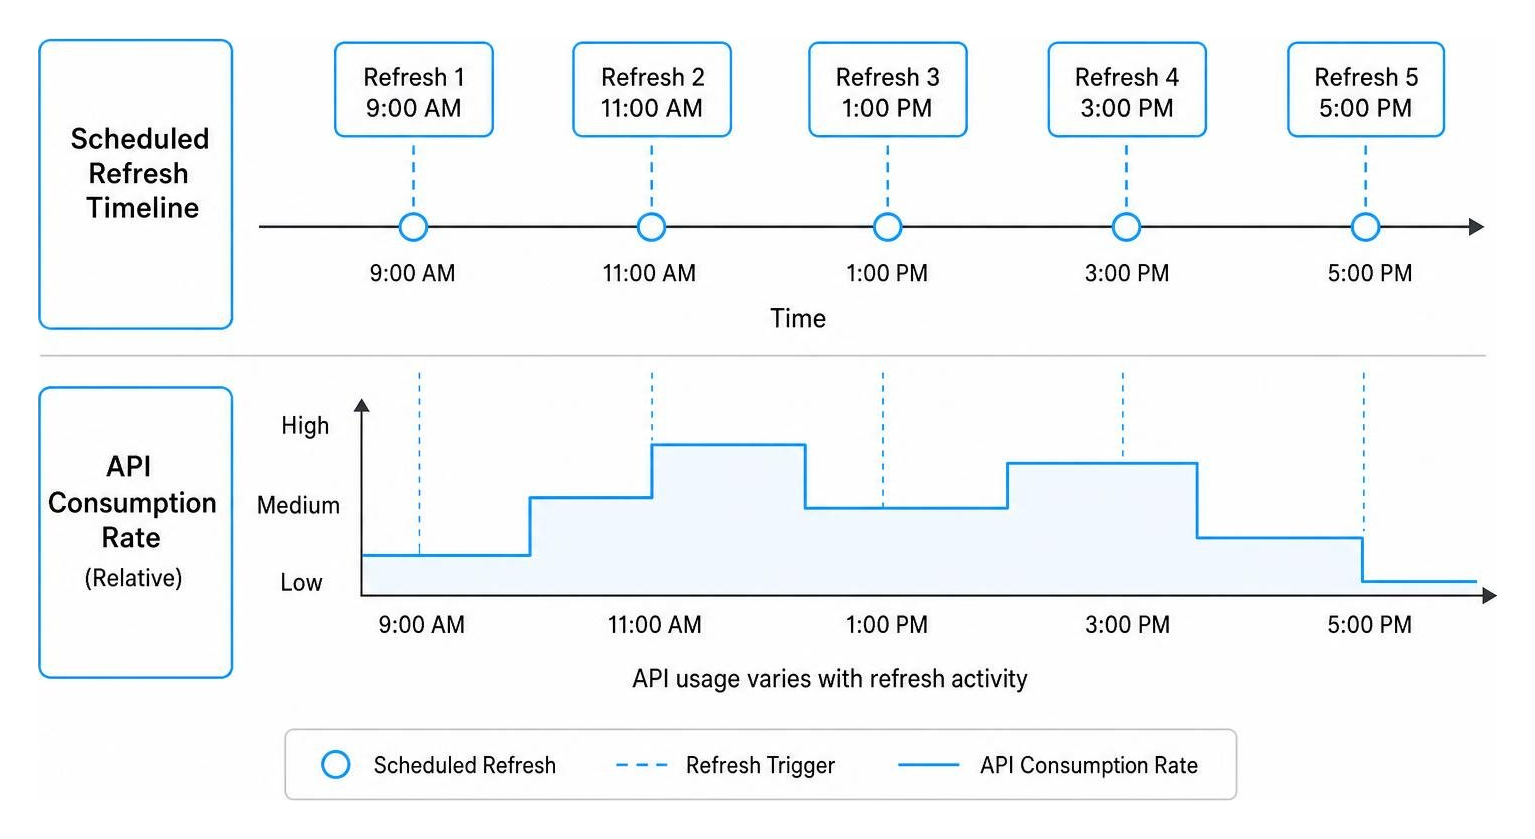
By monitoring your refresh times and keeping your queries consolidated, you can maintain high SaaS Performance Metrics across all your executive dashboards.
Analyzing Salesforce Data with Template Apps
If you want to skip the manual modeling process, Microsoft offers pre-built template apps designed specifically for Salesforce data. The "Salesforce Analytics for Sales Managers" template app is a popular choice.
To install and use a template app:
- Go to the Power BI Service (app.powerbi.com).
- Click on Apps in the left-hand navigation pane, then select Get Apps.
- Search for "Salesforce Analytics for Sales Managers" and click Get it now.
- Once installed, open the app and click Connect your data in the top banner.
- Sign in with your Salesforce credentials.
This template app automatically builds standard dashboards to track your sales performance, including:
- KPI Dashboard: A high-level overview of open opportunities, expected revenue, and pipeline health.
- Sales Manager Dashboard: Tracks representative performance, pipeline coverage, and win rates.
- Account Dashboard: Breaks down top accounts by industry, revenue, and active opportunities.
- Lead Dashboard: Analyzes lead sources, conversion rates, and lead-to-opportunity velocity.
- Representative Dashboard: Displays individual sales representative pipelines and performance metrics.
These pre-built dashboards are incredibly useful For Finance Teams and sales leaders who need immediate visibility into their pipelines without waiting weeks for custom engineering resources.
Frequently Asked Questions about Salesforce and Power BI
Why does the Salesforce Reports connector only load 2,000 rows?
The 2,000-row limit is a restriction of the Salesforce Reports API itself, not Power BI. To protect server performance, Salesforce caps report exports via this API. Because Power BI truncates this data silently, you should use the Salesforce Objects connector or a staging dataflow to load larger datasets safely.
How do I fix the INVALIDQUERYLOCATOR error in Power BI?
This error is triggered when you exceed Salesforce's concurrent query limit. To fix it, reduce the number of queries running at the same time. You can do this by removing unnecessary tables from your model, consolidating multiple queries into a single step, or staging your raw Salesforce data in a Power BI Dataflow.
Can I connect Power BI to a Salesforce Sandbox environment?
Yes. When configuring your connection settings in Step 2, select Custom under the login URL options and enter your sandbox login URL (typically https://test.salesforce.com/). Once connected, you can build and test your dashboards using test data before switching the URL to your production environment.
Tracking these connection details helps maintain clean SaaS Growth Metrics without corrupting your production reports.
Conclusion: A Simpler Way to Analyze Your SaaS Data
Connecting Power BI to Salesforce is a powerful way to visualize your sales pipeline, but maintaining the integration is often a full-time job. Between silent row truncation, API limits, expiring OAuth tokens, and complex table relationships, your RevOps and Finance teams can easily spend more time troubleshooting data pipelines than actually analyzing the business.
If you are tired of wrestling with API versions, custom domains, and complex SQL or DAX formulas, there is an easier way.
At atSpark, we provide an AI-powered analytics platform built specifically for SaaS companies. We unify your billing, CRM, and subscription data into a single, secure environment. Instead of building complex data models in Power BI, atSpark lets your team Ask your data anything without SQL.
Simply type a question in plain English — like "What is our expansion MRR by industry this quarter?" — and get instant, accurate charts, tables, and insights. It is fully governed, requires zero engineering support, and completely bypasses the limitations of native connectors.