Why Most Sales Teams Are Flying Blind Without a Daily Activity Report
A daily sales activity report is one of the highest-leverage tools a revenue team can use — yet most teams either skip it entirely or build one that nobody reads.
Here's the fast answer if you need it now:
A daily sales activity report is a structured record of what your sales reps did today — calls made, emails sent, meetings booked, deals moved — along with the outcomes those activities produced. It gives managers and RevOps leads a same-day view of pipeline health, rep productivity, and quota pacing.
What it typically includes:
- Date and rep name
- Activity counts (dials, emails, meetings)
- Outcomes (connects, replies, demos booked)
- Pipeline movement (deals advanced, new opportunities created)
- Closed revenue for the day
- Commentary on blockers or wins
The stakes are real. According to industry data, 69% of B2B sales reps missed quota last year — and that's not purely a strategy problem. It's a visibility problem. Teams using a structured daily reporting format are 2.8x more likely to hit their numbers than teams without one.
Yet reps spend just 28% of their time actually selling. The rest goes to admin, meetings, and — ironically — manual reporting. A well-designed daily report should take under 10 minutes, not consume the selling time it's meant to protect.
The core tension is this: you can't course-correct on Friday what went wrong on Tuesday. Weekly rollups catch trends. Daily reports catch fires.
What is a Daily Sales Activity Report (and How It Differs from a Standard Sales Report)
When you look at your sales engine, it is easy to confuse different types of dashboards. A standard daily sales report typically focuses on trailing financial outcomes: How much revenue did we book today? How many units did we ship?
In contrast, a daily sales activity report is a highly specialized tool designed to measure the raw energy and operational execution of your team. It is a record of Sales Activity—the direct inputs that your sales representatives control entirely.
While a standard report tells you what happened, an activity report tells you why it happened and how it will impact your future Sales Funnel.
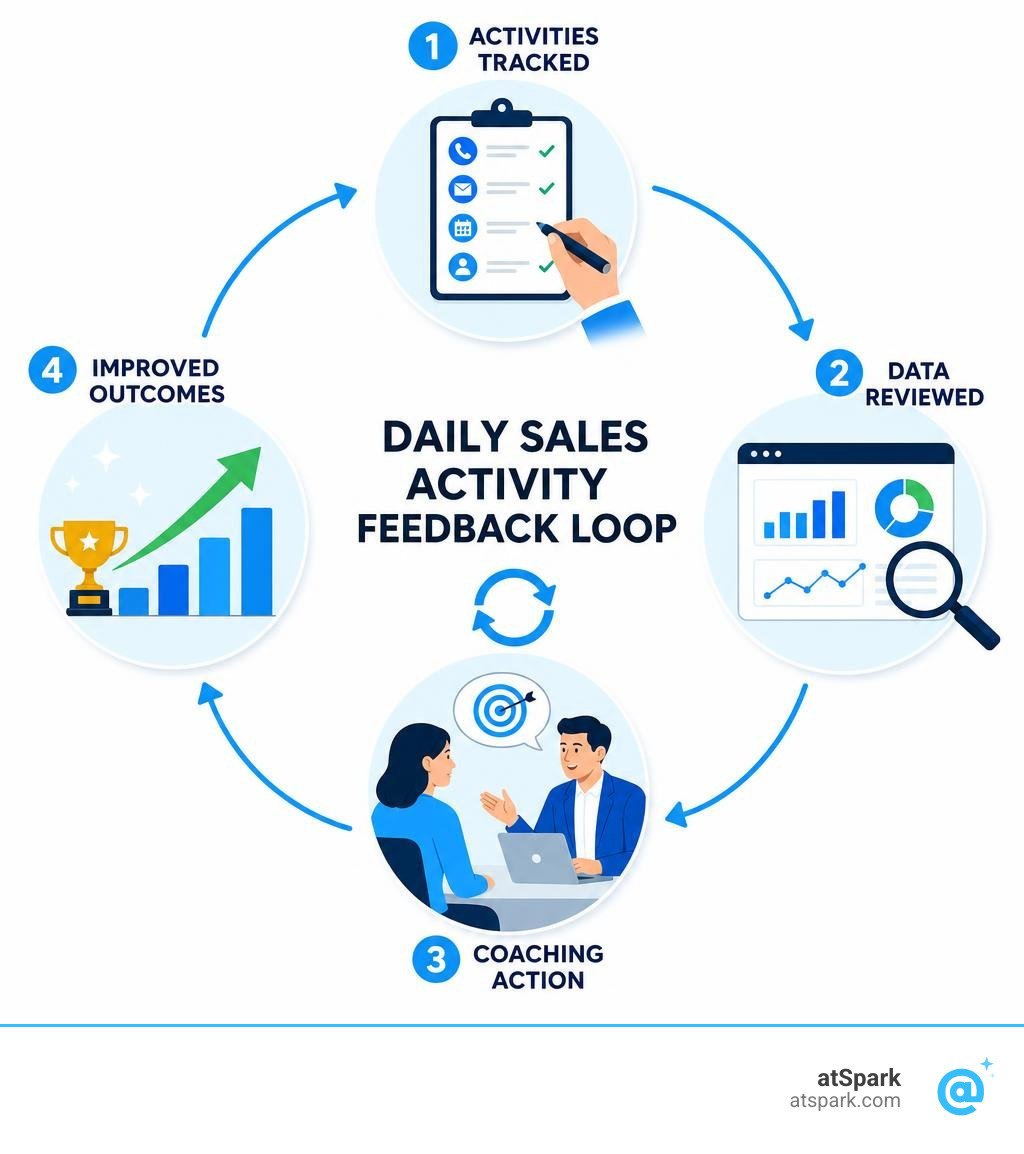
By focusing on these daily inputs, we transition our management style from historical autopsy to real-time guidance. If a sales rep has a week of zero closed deals, a standard report simply flags the failure. A daily activity report, however, will show you that their outbound dial volume dropped by 40% on Tuesday, giving you a chance to step in and coach before the week is lost.
Process Metrics vs. Outcome Metrics
To build a high-performing sales machine, we must split our data into two camps: process metrics (leading indicators) and outcome metrics (lagging indicators).
- Process Metrics (Leading Indicators): These are the inputs. They include dials made, emails sent, social outreach touches, and meetings scheduled. Your reps have 100% control over these numbers. If we tell a rep to make 50 dials today, they can physically do it.
- Outcome Metrics (Lagging Indicators): These are the results. They include deals closed, pipeline value added, and revenue generated. Reps cannot directly control these; they can only influence them through high-quality process execution.
On a daily basis, process metrics are far more valuable. If we only track outcome metrics daily, we invite panic. A long sales cycle means revenue is lumpy; a rep might go four days without a closed deal and then close a massive enterprise contract on Friday. Tracking revenue daily in that environment creates artificial anxiety. Tracking their movement through the Sales Funnel daily, however, ensures the pipeline stays healthy and predictable.
The Strategic Value: How Daily Reports Drive Executive Decisions
For sales managers and executives, a daily sales activity report acts as a control tower. It bridges the gap between daily floor activity and long-term strategic planning.
When executives analyze daily activity trends, they can make informed, data-driven decisions that impact the entire organization. For example, a retail or field sales executive can look at daily volume trends over several quarters to optimize operational staffing allocations—scheduling more staff on historically high-volume days and scaling back during quiet periods to protect margins.
Furthermore, daily activity tracking allows managers to cross-reference performance spikes with individual activity logs. If one rep is consistently driving a higher volume of quality conversations, we can isolate their tactics and share them with the rest of the team.
This level of granular visibility feeds directly into the master Sales Forecast. When we understand the exact conversion rate of daily dials to booked meetings, and booked meetings to closed deals, our revenue forecasting becomes incredibly precise. We no longer have to guess our future numbers; we can calculate them based on today's inputs.
Daily vs. Weekly vs. Monthly Sales Reports
Each reporting frequency serves a different audience and a different strategic purpose. Mixing up these cadences is a fast track to bloated dashboards and confused teams.
| Reporting Cadence | Primary Audience | Key Metrics Tracked | Strategic Purpose |
|---|---|---|---|
| Daily | Sales Reps & Line Managers | Dials, emails, connects, meetings scheduled, daily blockers | Same-day course correction, accountability, and tactical coaching |
| Weekly | Sales Managers & Directors | Lead-to-opportunity ratios, pipeline value added, activity-to-meeting conversions | Trend analysis, pipeline health audits, and weekly sales coaching |
| Monthly | VPs, RevOps, & Executives | Closed-won revenue, average sales cycle length, customer lifetime value, win rates | Strategic planning, resource allocation, and quota attainment reviews |
By keeping these cadences distinct, we protect our reps from over-reporting and ensure executives only receive the high-level, synthesized data they need to make board-level decisions.
Designing the Framework: Metrics, Roles, and Best Practices
To build a report that actually gets used, we must design it with the end-user in mind. A great report balances simplicity with depth, ensuring we capture critical data without overwhelming our sales reps. Our goal is to accelerate Sales Velocity and drive consistent Quota Attainment.
Key Metrics to Include in Your Daily Sales Activity Report
A comprehensive daily activity report unifies data across several key areas. While you want to keep the report lean, every high-performing template should track these essential metrics:
- Activity Volume: The raw number of outbound attempts (dials, emails, LinkedIn messages).
- Connection and Engagement Rates: The number of actual conversations had or email replies received. This is a crucial sanity check on your list quality.
- Pipeline Progress: The number of new opportunities created or deals moved to the next stage of the funnel.
- Financial Health Metrics: Daily sales quantity, gross revenue, and adjusted profit margins to ensure we are chasing high-value deals, not just empty volume.
- Qualitative Context: A short, 2-3 bullet commentary section highlighting daily wins, customer objections, or operational blockers.
Tracking these metrics in tandem helps you maintain healthy Quota Attainment across the entire team.
Role-Specific Formats for Your Daily Sales Activity Report
A generic, one-size-fits-all template rarely works because different sales roles have completely different daily workflows.

Here is how you should vary the format based on the role:
- Inside Sales (SDR/BDR): This format should be highly transactional. Focus heavily on process metrics like dials, emails sent, connect rates, and meetings booked. Establish clear benchmarks, such as 40-50 dials per day and a 3-10% connect rate.
- Field Sales Representatives: Field reps spend their days traveling. Their reports must track travel hours and geographic territory coverage alongside client visits and face-to-face presentations. If a field rep spends 4 hours driving for a single 30-minute meeting, the report will flag a territory planning issue rather than a performance problem.
- Retail and Transactional Sales: In retail, the focus shifts to register reconciliation, payment mix (cash, card, mobile wallets), transaction volumes, and average order value. Crucially, retail reports must track returns and refunds daily to prevent dangerously inflated revenue figures.
Best Practices for High-Adoption Reporting
The biggest challenge with daily reporting is getting reps to actually do it. If your reporting process is painful, reps will log inaccurate data at 5:55 PM just to get it over with.
To prevent this, we recommend sticking to a few golden rules:
- The 5-Minute Rule: Filling out the daily report should take no longer than 5 minutes. If it takes longer, your format is too complex.
- Use Dropdown Menus: Eliminate free-text fields wherever possible. Use standardized dropdowns for activity types, pipeline stages, and next steps to keep your data clean and roll-up ready.
- Context Over Raw Numbers: A report showing "45 calls" is useless without context. Pair raw numbers with goal-vs-actual variance tracking so reps can see exactly where they stand.
- Review and Coach: If reps see that managers never open the daily reports, they will stop caring about data quality. Review the reports during morning huddles and use the data for constructive, real-time coaching.
For a deeper dive into structuring these templates, check out this guide on the Daily Sales Activity Report Format (+Templates) 2026 .
Overcoming the Friction: Automation, Data Quality, and Common Pitfalls
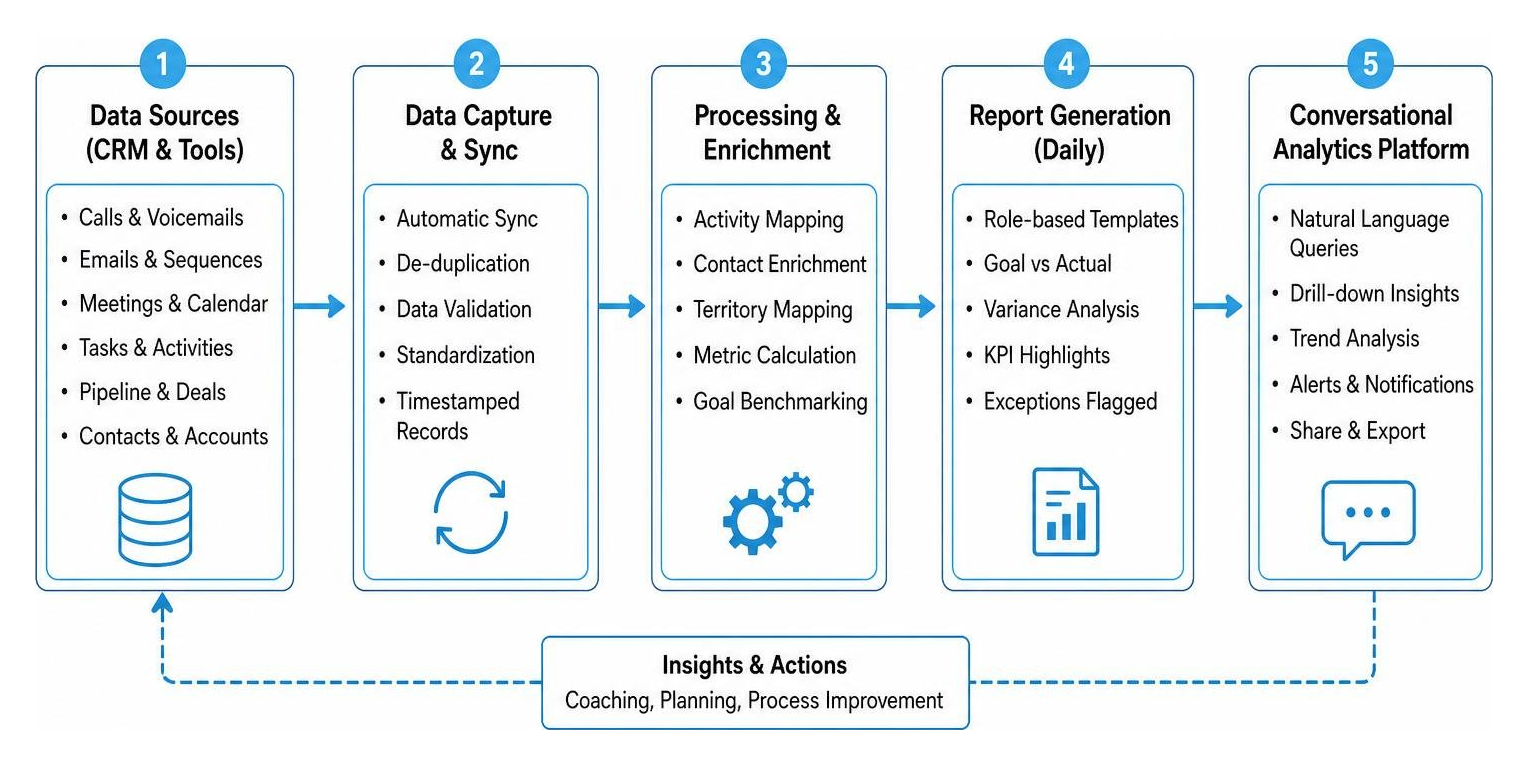
Manual data entry is the ultimate productivity killer. When reps spend hours copy-pasting numbers from their phone logs into messy spreadsheets, they aren't selling. Fortunately, modern technology allows us to automate almost the entire process.
The Impact of Data Quality and Contact Accuracy
Your daily activity report is only as good as the data feeding it. A beautiful report built on disconnected phone numbers and bounced emails is just a prettier way to document failure.
Consider this scenario: Rep A makes 100 dials and gets zero connects. Rep B makes 30 dials and gets 10 connects. On paper, Rep A looks incredibly busy, but they are wasting their time on a low-quality list.
Dirty data and high bounce rates inflate your activity metrics while completely stalling your pipeline. To make your daily reports worth reading, you must prioritize list hygiene and contact accuracy upstream.
For strategies on keeping your lead lists clean, see this guide on the Daily Sales Report Template (Free) + How to Use It .
How to Automate Your Daily Reporting Workflow
To eliminate administrative friction, aim to automate up to 80% of your daily reporting workflow.
You can connect your communication tools directly to your CRM using APIs or workflow automation tools like Zapier. When a rep finishes a call or sends an email, the activity should automatically log in the background.
Furthermore, you can use automated BI tools and AI meeting assistants to transcribe calls, extract key action items, and sync the summaries directly to your database. This saves your team hours of manual post-call admin work every week.
To learn more about setting up automated reporting flows, check out the Daily Sales Report : Guide & Template | Noota .
Five Common Reporting Mistakes to Avoid
When building out your reporting structure, watch out for these five common pitfalls:
- Tracking Vanity Metrics: Tracking metrics that make the team look busy but don't correlate with revenue (like total emails sent without tracking reply rates).
- Relying on Manual Entry: Forcing reps to manually type in numbers that should be auto-populated by your CRM.
- Bloating the Fields: Including more than 8-10 fields in a daily report. Keep it lean; if a metric doesn't change daily, move it to the weekly report.
- Lack of Goal Variance: Displaying raw numbers without comparing them to the daily target.
- Ignoring Returns and Refunds: In transactional and retail environments, failing to subtract returns from your daily gross sales, which distorts your true profitability.
Free Templates and Tools to Get Started Today
You don't need a multi-million dollar tech stack to start tracking daily sales activities. If you are a team of 1-5 reps, a well-structured spreadsheet is often the perfect place to start.
To help you hit the ground running, we recommend exploring these excellent, free resources:
- For a comprehensive, structured workbook that links daily logs to monthly dashboards, download this 영업일지 템플릿 — 고객 방문·상담 기록 + 성과 분석 — DXForms .
- If you prefer a digital form format to streamline end-of-shift reporting for your team, try this Free Daily Sales Report Form Template | FormCreatorAI .
As your team grows beyond 5 representatives, you will want to transition from static spreadsheets to a centralized CRM and an intelligent analytics platform to avoid version control conflicts and manual data bottlenecks.
Frequently Asked Questions about Daily Sales Reporting
How long should it take a sales rep to fill out a daily report?
A well-designed daily report should take no longer than 3 to 7 minutes to complete. By utilizing automated CRM tracking, dropdown menus, and locked spreadsheet structures, the administrative overhead for your reps remains virtually non-existent.
Should our team use spreadsheets or a CRM for daily tracking?
For small teams of 1 to 5 reps, spreadsheets work perfectly fine. However, once you scale past 5 reps, a CRM becomes essential to maintain a single source of truth, prevent lead duplication, and manage your Sales Pipeline without chaotic manual updates.
Why does my report show high activity but low sales results?
This is almost always a symptom of poor contact data quality or a specific skill gap in the sales funnel. If your reps are making a high volume of dials but getting zero connects, they are likely working from a dirty lead list. If they are getting connects but booking no meetings, it points to a coaching opportunity regarding their pitch or objection handling.
Conclusion: Stop Guessing and Start Growing
At the end of the day, running a sales organization on gut feeling is a recipe for missed quotas. A structured daily sales activity report gives you the visibility you need to catch pipeline issues early, deliver accurate forecasts, and provide targeted coaching to your team.
But let's be honest: nobody got into sales to spend their life building SQL queries, configuring complex BI dashboards, or fighting with spreadsheet formulas.
That is exactly why we built atSpark.
As an AI-powered analytics platform designed specifically for fast-growing companies, atSpark unifies your billing, CRM, and subscription data into a single, secure source of truth. Instead of scrambling to build reports, you can simply ask atSpark plain-English questions like:
"Show me a chart of yesterday's sales activities compared to our daily target." "Which reps had the highest connect rate this week?"
You get instant, beautifully formatted charts, tables, and insights — without touching a single line of SQL or waiting on an engineering team.
Ready to transform your Sales Activity data into your ultimate growth engine? Stop guessing and start leading with data.