What You Need to Know Before Pulling Salesforce Reports into a BI Dashboard
Creating a Salesforce-connected BI report is one of the most common requests from sales ops and RevOps teams - and one of the most frustrating to get right. Here's the quick answer before we go deeper:
How to connect Salesforce to a BI reporting tool (fast summary):
- Confirm your Salesforce account has API access enabled (trial accounts don't have it)
- In your desktop authoring tool, go to Get Data > Salesforce Reports or Salesforce Objects
- Sign in with your Salesforce credentials via OAuth
- Select the report or object you want to import
- Load the data and build your visuals in your BI model
Important: If your Salesforce report has more than 2,000 rows, the Reports connector will silently cut off your data - with no warning. Use the Salesforce Objects connector instead.
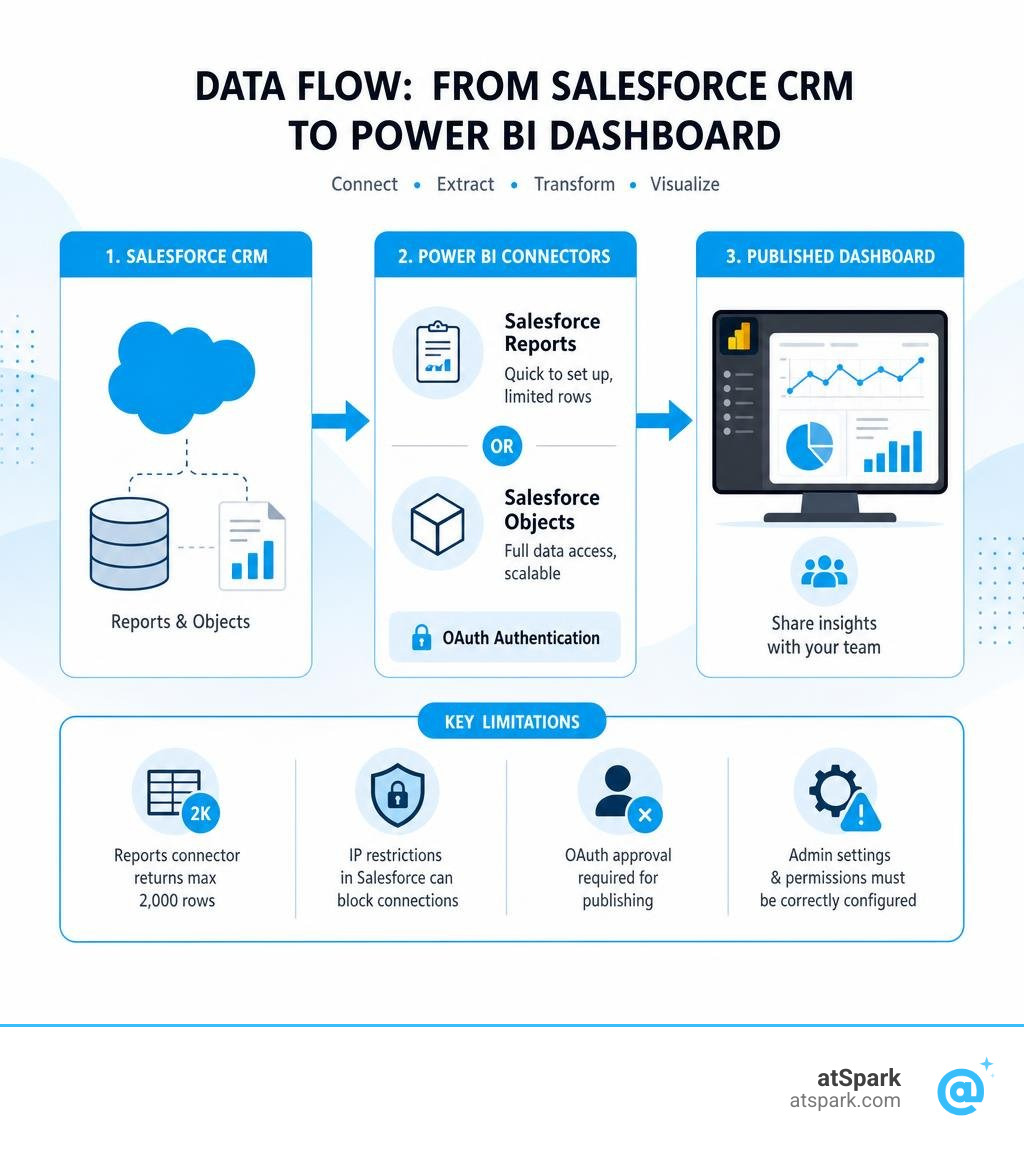
The two connectors behave very differently in production. The Reports connector is quick to set up but hits a hard 2,000-row ceiling imposed by Salesforce's own API. For most real sales pipelines, that limit gets hit fast.
There are also common blockers that catch teams off guard: session IP-locking in Salesforce, OAuth approval errors when publishing to a cloud analytics service, and authentication issues tied to how Salesforce admin settings are configured.
This guide walks through all of it - prerequisites, connection steps, connector differences, and how to fix the errors that show up once you move past a basic setup.
Connecting a Salesforce Report to a BI Tool: Prerequisites and API Requirements
Before you even open your desktop analytics tool, there are a few security and licensing gates you must pass within Salesforce. If these aren't configured correctly, your connection will fail before it even starts.
First, your Salesforce user profile must have API Enabled checked. Without API access, your reporting tool cannot query your Salesforce instance. It is worth noting that Salesforce trial accounts do not have API access enabled, which means you cannot test this integration using a free trial sandbox.
Second, check your Salesforce session settings. A common culprit for blocked connections is the setting "Lock sessions to the IP address from which they originated." If your Salesforce administrator has this enabled, it can block scheduled cloud refreshes. Because cloud analytics services run on networks with dynamic IP addresses, Salesforce may view the refresh request as a session hijacking attempt and terminate the connection. You will need to work with your admin to disable this setting or implement IP relaxation for the connected app.

To ensure a smooth setup, ask your Salesforce administrator to verify these settings. If you want a deeper dive into the security handshake between Salesforce and BI platforms, you can Connect Power BI to Salesforce using our detailed configuration guide.
Step-by-Step Guide to Connect a Salesforce Report
Once the prerequisites are cleared, you can establish the connection from your desktop authoring environment. We will walk through the setup using the native Reports connector first, as it is the most straightforward method for smaller datasets.
Step 1: Open the Connector Open your desktop authoring tool, navigate to the Home ribbon, click Get Data, and select More... Search for "Salesforce" and choose Salesforce Reports.
Step 2: Choose Your Environment You will be prompted to select your Salesforce environment. You can choose either "Production" or "Custom."
- If your company uses a standard login, select Production (which uses the standard login.salesforce.com URL).
- If your company uses a custom domain (such as contoso.my.salesforce.com), select Custom and enter your custom URL.
Warning on URLs: Custom URLs only support standard salesforce.com and cloudforce.com domains. If you attempt to use a modern Lightning URL (e.g., contoso.lightning.force.com), the connector will return an "Invalid Arguments" error. Always use your classic MyDomain URL.
Step 3: Authenticate via OAuth Click Sign in. A browser window will open, prompting you to enter your Salesforce credentials. Because this connection uses secure OAuth authentication, the reporting tool never stores your raw password. Once you authorize the connection, close the browser window and click Connect in the desktop app.
Salesforce Objects vs. Reports Connector in a BI Model
When connecting Salesforce to an analytics model, you have two primary choices: the Salesforce Reports connector or the Salesforce Objects connector. Choosing the wrong one can lead to inaccurate dashboards or severely degraded performance.
The Salesforce Reports connector essentially mimics an export of an existing report built within the Salesforce Report Builder. While this sounds convenient because the filtering and logic are already done, it relies on the Salesforce Reports API, which has a hard limit of 2,000 rows.
The Salesforce Objects connector, on the other hand, connects directly to the underlying database tables (such as Opportunity, Account, or Lead). It bypasses the 2,000-row limit entirely, allowing you to pull millions of rows. However, because you are pulling raw tables, you must rebuild the relationships, filters, and calculations inside your BI model using the query editor and measure logic.
Additionally, the Objects connector can throw errors if you attempt to load "wide" tables with too many custom fields. You may encounter the error: "Query is either selecting too many fields or the filter conditions are too complicated." To prevent this, always use the "Select Query" option or manually deselect unnecessary columns in the query editor to keep your tables lean.
| Feature | Salesforce Reports Connector | Salesforce Objects Connector |
|---|---|---|
| Row Limit | Hard limit of 2,000 rows (silent truncation) | No row limit (limited only by analytics capacity) |
| Data Logic | Uses pre-built Salesforce report logic | Requires manual data modeling in the BI layer |
| Performance | Fast for small datasets; fails at scale | Slower initial load; highly scalable |
| Field Limitations | Limited to fields present in the report | Can trigger "too many fields" errors on wide objects |
| Historical Snapshots | Limited to rolling 90-day parameters | Supports full historical data modeling |
Troubleshooting the 2,000-Row Limit on a Salesforce Report
The most dangerous aspect of the Salesforce Reports connector is silent truncation. If your Salesforce report has 2,500 rows, the connector will load exactly 2,000 rows and display a "Success" message. It will not show an error, a warning, or an exclamation mark. Your dashboards will simply be missing 500 records of data, leading to incorrect sales forecasts and pipeline metrics.
To bypass this limit, we strongly recommend using the Salesforce Objects connector for any production-grade reporting.
Instead of importing a pre-packaged report, you pull the raw tables. For example, if you want to build a pipeline dashboard, you would import the Opportunity table, the Account table, and the User table. You then relate these tables in your model view using the ID fields (e.g., relating AccountID on the Opportunity table to ID on the Account table).
When pulling raw tables, you will also need to handle date filtering manually to avoid exhausting your Salesforce API limits. In Salesforce Reports, you might rely on a rolling "Last 90 Days" filter. In your analytics model, you should import a custom calendar table and use measures to filter your visuals.
If you are building a dashboard to track sales performance or quota attainment, pulling raw objects is the only way to ensure your numbers are 100% accurate. You can learn more about structuring these relationships in our The Ultimate Guide to Tracking Quota Attainment Per Rep in Salesforce.
Resolving OAuth and Authentication Errors in a Cloud Analytics Service
Building your report in a desktop authoring environment is only half the battle. The real headaches often begin when you publish the report to a cloud-based analytics service and try to set up an automated scheduled refresh.
A common scenario: your report refreshes perfectly on your desktop, but when you publish it and attempt to configure the credentials in the cloud, you receive an OAUTH_APPROVAL_ERROR_GENERIC or a generic "Failed to update data source credentials" message.
This happens because the cloud service requires administrative approval within your Salesforce organization to act as a connected app. To resolve this:
- Have your Salesforce administrator navigate to Setup > Connected Apps OAuth Usage.
- Look for the query and refresh connected apps associated with your BI connector.
- If they are blocked, click Unblock.
- Ensure that Permitted Users is set to "Admin approved users are pre-authorized" or "All users may self-authorize," and that IP Relaxation is set to "Relax IP restrictions."
Once these apps are approved in Salesforce, go back to your cloud dataset settings and edit the credentials. Choose OAuth2 as the authentication method and sign in. After authentication succeeds, configure scheduled refresh according to the limits of your analytics license.
Enterprise-Scale Alternatives: Dataflows, ETL, and Embedding
For small businesses, the native Salesforce Objects connector works fine. But as your data grows to hundreds of thousands of opportunities, direct API connections will slow down your refreshes and potentially exhaust your Salesforce daily API request limits.
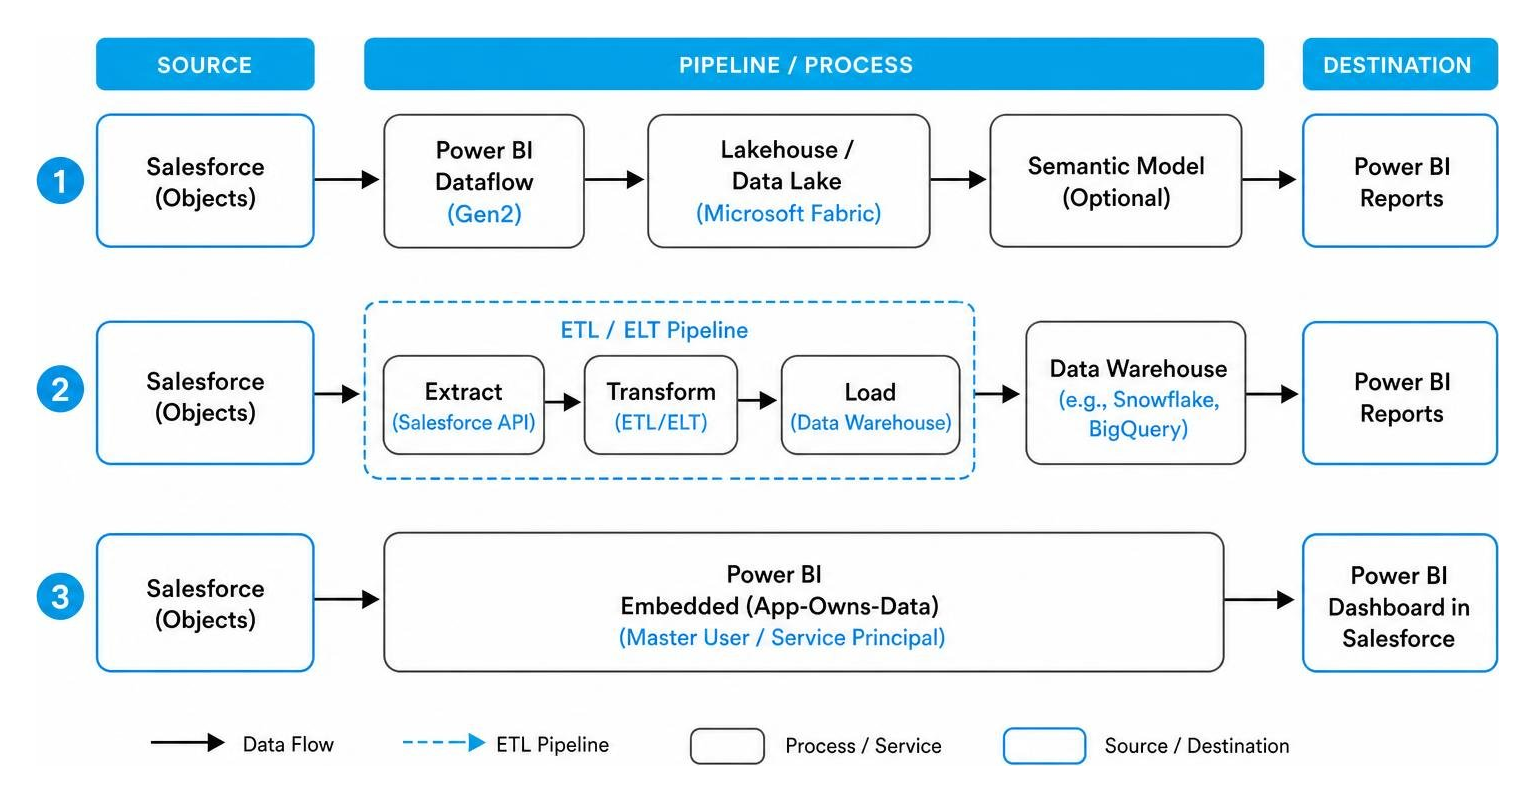
For enterprise-scale analytics, you should consider three modern architectural alternatives:
1. Centralized Dataflows
Instead of having multiple individual reports query Salesforce directly (which multiplies API calls), you can set up a centralized dataflow. The dataflow queries Salesforce once, extracts the raw objects, and stores them in a cloud-based lakehouse or data lake. Your individual BI reports then query the prepared dataflow rather than Salesforce directly. This centralizes your data logic, protects your Salesforce API limits, and speeds up report refresh times.
2. ETL/ELT Pipelines to a Data Warehouse
The gold standard for enterprise reporting is to extract Salesforce data using an ETL or ELT pipeline and load it into a centralized data warehouse. Your analytics layer then connects directly to the data warehouse. This completely decouples your reporting from Salesforce's live operational database, allowing you to combine CRM data with ERP, billing, and marketing data for a true 360-degree view of your Sales Pipeline Glossary and Sales Forecast Glossary.
3. App-Owns-Data Embedding
If you want to display dashboards directly inside Salesforce pages so your sales reps don't have to switch apps, you can use embedded analytics capabilities. To avoid assigning a separate analytics license to every single Salesforce user, developers use the App-Owns-Data embedding model. This model authenticates users through a single Master User or Service Principal, rendering the reports securely within Salesforce Lightning components.
To explore the developer resources, Apex code controllers, and Lightning components required to build this secure embedding model, check out the developer README on GitHub.
Frequently Asked Questions about Salesforce and BI Reporting
Why is my Salesforce report capped at 2,000 rows?
This cap is a hard-coded limitation of the Salesforce Reports API itself, not your reporting layer. When you use the "Salesforce Reports" connector, the connector queries this API, which truncates the data at 2,000 rows. Because the truncation happens silently without throwing an error, we recommend using the "Salesforce Objects" connector to pull raw tables instead.
Why am I getting an OAuth error when publishing to a cloud analytics service?
This usually means your Salesforce administrator has restricted third-party application access. To fix it, your Salesforce admin must go to Connected Apps OAuth Usage and unblock or approve the query and refresh applications associated with your BI connector, ensuring that IP restrictions are relaxed for these services.
Can I connect a Salesforce trial account to my BI tool?
No. Salesforce trial accounts do not have API access enabled by default. Because BI connectors rely on the Salesforce REST and SOAP APIs to extract data, the connection will fail with an authentication or "API disabled" error until the account is upgraded to a paid tier that includes API access.
Conclusion: A Simpler Way to Analyze Your Sales Data
Connecting a BI reporting layer to Salesforce is a powerful way to unlock your CRM data, but as we have shown, it comes with significant technical overhead. Between managing API limits, dealing with silent 2,000-row truncation, configuring OAuth gateways, and writing complex formulas to rebuild basic reports, your data engineering team can quickly become bogged down in maintenance.
If you are tired of wrestling with query code, database relationships, and broken gateway connections, there is an easier way to get insights from your business data.
atSpark is an AI-powered analytics platform designed specifically for modern SaaS teams. Instead of spending weeks building and maintaining complex data pipelines:
- Unify Your Data Automatically: atSpark seamlessly connects and unifies your Salesforce CRM, billing platforms, and subscription data under one secure roof.
- No SQL, No Engineering Required: Your team doesn't need to learn complex query languages. Anyone can ask plain-English questions - like "What is our weighted sales pipeline for Q3 by region?" - and get instant, beautifully formatted charts, tables, and actionable insights.
- Governed and Secure: Enjoy the power of conversational BI with built-in enterprise-grade data governance, ensuring everyone sees exactly what they are authorized to see.
Before you spend another afternoon debugging a gateway error, see how we compare. Compare traditional BI workflows vs atSpark to find the right fit for your team, or start exploring your data instantly and Ask your data anything without SQL today.