Why Every RevOps Team Needs a Sales Activity Report
A sales activity report is one of the fastest ways to see what your sales team is actually doing — and whether that effort is turning into revenue.
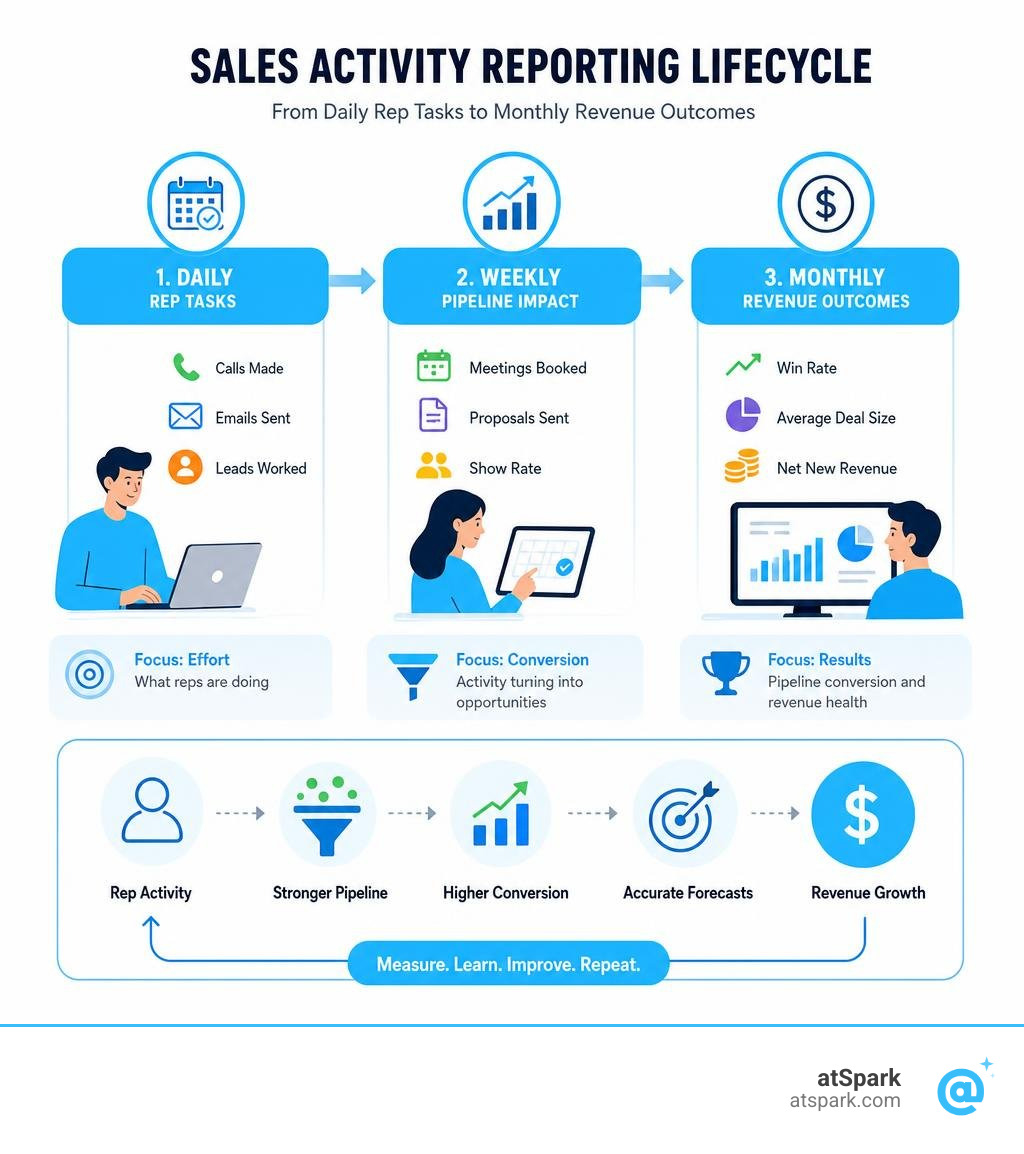
Here's a quick overview of what these reports cover:
| Report Type | Key Metrics | Primary Use |
|---|---|---|
| Daily | Calls made, emails sent, leads worked | Track rep effort and pipeline top-of-funnel |
| Weekly | Meetings booked, proposals sent, show rate | Measure if daily activity is creating opportunities |
| Monthly | Win rate, average deal size, net new revenue | Evaluate pipeline conversion and revenue health |
Sales is one of the top three most monitored operations in any business — and for good reason. Without visibility into daily activity, it's nearly impossible to know why a quarter is going sideways until it's too late to fix it.
The numbers make this urgent:
- 50% of buyers choose the vendor that responds first
- 80% of sales require five or more follow-up calls after an initial meeting
- Yet 44% of reps follow up only once
That gap between what needs to happen and what actually happens? A well-structured sales activity report closes it.
For RevOps and finance leads at SaaS companies, the problem runs deeper than just counting calls. You need to connect rep-level activity to pipeline health, forecast accuracy, and revenue risk — without waiting on a data team or reconciling three spreadsheets manually.
This guide gives you practical, ready-to-use examples and templates to make that happen.
What is a Sales Activity Report and Why Does It Matter?
At its core, a sales activity report is a data-driven diagnostic tool. It acts as a performance record that tracks exactly what sales activities (such as phone calls, emails, meetings, and demos) are performed over a specific timeframe.
According to Databox’s state of business reporting, sales operations are among the top three most heavily monitored and reported functions in modern businesses. This intense focus exists because the days of abstractly measuring sales performance are long over. We can no longer afford to wait until the end of the quarter to realize our pipeline is empty.
By tracking daily inputs, sales leaders gain early-warning indicators of future revenue. For instance, if buyer data shows that 50% of buyers select the first-responding vendor, tracking lead response times on your daily report is not micromanagement—it is a direct lever for increasing win rates. Furthermore, since 80% of sales require at least five follow-up calls, monitoring follow-up frequency ensures your team is not leaving money on the table.
For modern Revenue Operations (RevOps) departments, unifying these metrics across the entire customer lifecycle is essential. RevOps relies on these reports to align sales, marketing, and customer success, ensuring that resource allocation matches high-performing channels. To learn more about how unified data drives cross-functional alignment, check out our insights For RevOps Teams.
How to Structure and Write an Effective Report
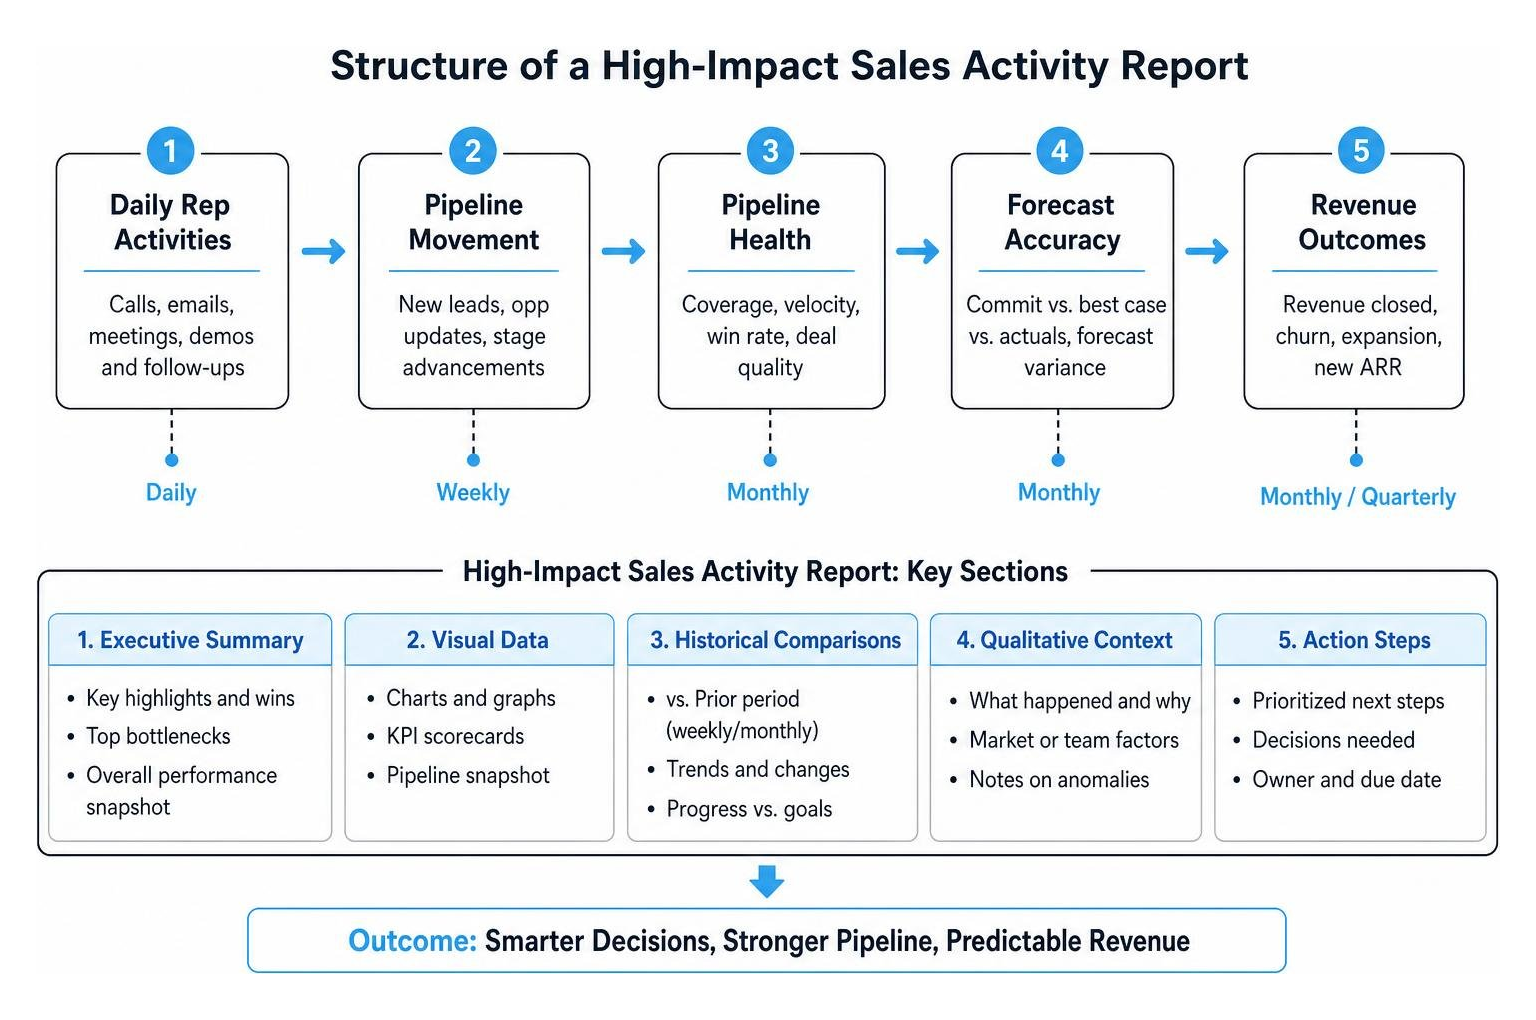
An effective sales activity report must be easy to read, highly visual, and contextually rich. A wall of raw numbers will only cause stakeholders to tune out. To write a report that drives action, we recommend structuring it with the following five key elements:
- The Executive Summary: Start with a brief, high-level overview of the key findings, wins, and primary bottlenecks. Keep this section concise and focused on the big picture.
- Visual Data Presentation: Use clean charts, graphs, and tables to simplify complex numerical data. Visualizing trends makes it easier for executives to spot patterns instantly.
- Historical Comparisons: Always compare current performance against previous periods (e.g., this week vs. last week, or this month vs. last month). Showing progress or decline helps contextualize whether your team's velocity is increasing.
- Qualitative Context: Numbers only tell half the story. Explain why the numbers look the way they do. For example, if email volume dropped by 20% this week, note that three reps were out sick or attending an annual industry conference.
- Clear Action Steps: Conclude with the next steps. Whether it is adjusting sales strategies, targeting a new vertical, or scheduling a targeted coaching session for underperforming reps, make sure the report points toward a clear path forward.
Essential Metrics to Include in Your Activity Reports
To build a balanced reporting framework, you must track both input metrics (which measure effort) and outcome metrics (which measure results). Relying purely on outcomes like "revenue closed" makes it impossible to diagnose why a rep is struggling. Conversely, relying purely on "calls made" can incentivize empty volume over quality.
By breaking your metrics down into daily, weekly, and monthly cadences, you create a natural diagnostic funnel that highlights both pipeline health and coaching opportunities.
Daily Sales Activity Report Metrics
Daily reports act as a daily "report card" for your sales representatives. They focus heavily on high-volume, top-of-funnel activities that keep the pipeline moving. The essential daily metrics include:
- Calls Made: The raw number of outbound phone calls placed by each representative.
- Emails Sent: The volume of personalized outreach emails sent to prospects.
- Leads Worked: The number of active prospects a representative engaged with throughout the day.
- Lead Response Time: The average duration between when a lead is assigned to a rep and when the rep logs their first interaction. This is critical for capturing high-intent buyers who expect immediate responses.
To ensure these daily interactions are captured accurately, reps must maintain clean data hygiene in their CRM platforms. For detailed guidance on how to organize and log these touchpoints seamlessly, refer to the official documentation on how to Track and manage activities | Microsoft Learn.
Weekly Sales Activity Report Metrics
Weekly reports move past raw effort and begin measuring the quality of those interactions. They help sales managers determine if daily outreach is successfully converting cold prospects into active opportunities. Key weekly metrics include:
- Meetings Booked: The number of initial discovery calls or product demonstrations scheduled.
- First Meeting Show Rate: Calculated as
(Number of meetings attended / Total meetings booked) * 100. This metric highlights whether reps are booking qualified prospects or simply filling their calendars with low-intent leads. - Lead-to-Opportunity Conversion Rate: The percentage of new leads that successfully progress to the active opportunity stage of your pipeline.
- Proposals Sent: The number of formal quotes, pricing sheets, or service agreements delivered to qualified buyers.
Tracking these weekly movements is crucial for maintaining a healthy pipeline. If you want to dive deeper into how these weekly transitions impact your broader sales structure, explore our Sales Pipeline Glossary.
Monthly Sales Activity Metrics
Monthly reports are strategic. They summarize team performance, calculate conversion rates, and show how well the sales organization is building the pipeline and converting it into net new revenue. The vital monthly metrics include:
- Win Rate: The percentage of closed opportunities that resulted in a won deal. This can be segmented as a percentage of all opportunities or a percentage of qualified opportunities to prevent data skewing.
- Average Deal Size: The average contract value (ACV) or annual recurring revenue (ARR) of won deals.
- Net New Revenue: The total dollar value of new business brought in during the month.
- Quota Attainment: The percentage of the monthly sales target achieved by individual reps and the team as a whole.
Understanding monthly trends is the foundation of accurate revenue forecasting. For a comprehensive breakdown of how monthly activity feeds into future revenue projections, see our Sales Forecast Glossary.
5 Practical Sales Activity Report Examples and Templates
To help you put these concepts into practice, here are five essential sales activity report examples and templates that you can implement in your organization today.
1. Daily Sales Rep Productivity Dashboard
This dashboard tracks the day-to-day work ethic and output of your individual sales representatives. It is designed to ensure that reps are maintaining the baseline activity levels required to hit their long-term pipeline goals.

What to Include:
- Individual rep logs for calls, emails, and social touches.
- Comparative charts showing individual rep output against the team average.
- Lead response times by representative.
Real-World Use Case:
Imagine a sales manager who notices that a representative's closed-won numbers have dropped over the last month. By pulling the Daily Sales Rep Productivity Dashboard, the manager can instantly diagnose the issue.
If the rep’s activity volume is high but their conversion numbers are low, the issue is likely the quality of their pitch or closing technique, pointing to a coaching opportunity. If the activity volume itself has plummeted, it indicates a productivity bottleneck or a lack of motivation.
For organizations running complex, multi-rep teams, tracking these granular details is vital. If you want to see how enterprise platforms structure this detailed rep data, you can read about the NetSuite Applications Suite - Sales Activity by Sales Rep Detail Report.
2. Weekly Sales Manager KPI Report
This report provides sales managers with a holistic view of team performance over the course of a week. It bridges the gap between daily activities and monthly revenue outcomes, focusing on pipeline progression.
What to Include:
- Total meetings booked vs. actual meetings completed (show rate).
- Total pipeline value created during the week.
- Number of proposals or contracts sent.
- Lead-to-opportunity conversion rates by rep.
Real-World Use Case:
A sales manager uses this weekly report to prepare for the weekly team alignment meeting. By reviewing the first meeting show rate across the team, the manager can identify if certain marketing channels are driving low-quality leads (resulting in high booking rates but low show rates) and coordinate with marketing to adjust targeting parameters.
Keeping a close eye on these weekly KPIs is one of the most effective ways to drive consistent quota attainment across your team. To learn how to systematically track and improve individual performance, read our guide on Quota Attainment Improvement by Rep.
3. Monthly Revenue and Win Rate Summary
This report is designed for executive stakeholders, directors, and finance leads. It focuses purely on outcomes, showing how well the sales team converted active pipeline into closed-won revenue over the course of the month.
What to Include:
- Total closed-won revenue (ARR/MRR) vs. monthly target.
- Win rates segmented by sales representative and territory.
- Average deal size trends.
- Percentage of quota attained by each representative.
Comparing Report Cadences:
To understand how daily, weekly, and monthly reports work together as a cohesive system, refer to this breakdown:
| Metric Category | Daily Report | Weekly Report | Monthly Report |
|---|---|---|---|
| Primary Focus | Input & Effort | Quality & Progression | Outcomes & Revenue |
| Key Question | "Are we working hard enough?" | "Are we creating opportunities?" | "Are we closing revenue?" |
| Data Source | CRM Activity Logs | Pipeline Stage Changes | Billing & Contract Data |
| Audience | Reps & Managers | Sales Managers | Executives & Finance |
Consistently monitoring these monthly conversion rates is essential for optimizing your entire sales funnel. To understand how to map these monthly outcomes back to your overarching sales model, check out our Sales Funnel Glossary.
4. Key Account Touchpoint and Relationship Health Report
This report is a critical preventative tool for account managers, sales directors, and customer success teams. Instead of tracking prospecting activities, it monitors the ongoing communication frequency with your existing, high-value customer accounts to prevent churn.
What to Include:
- Date of the last recorded contact (call, email, or meeting) for each key account.
- Total number of touchpoints logged against an account over the last 90 days.
- Activity owner (account manager or customer success representative).
- Account health status based on engagement levels.
Real-World Use Case:
A classic risk scenario in sales is account transition. For example, a key account is contacted regularly every six weeks for two years. However, when a new account manager takes over, communication becomes irregular and random.
Without a dedicated touchpoint report, this drop-off in communication goes unnoticed until the customer quietly decides to churn at renewal time. By running an activity report grouped by Account rather than by Sales Manager, directors can identify declining communication patterns early and intervene to save the relationship.
To see how legacy systems configure and run these account-level communication recaps, you can refer to the technical guides on the Activity Report (REPACTIVITY.REP with REPACTIVITY.FMX) and the Activity Report (repactivityrep with rep_activity.fmx).
Additionally, for modern SaaS environments tracking these customer touchpoints at scale, you can explore the NetSuite Applications Suite - Sales Activity by Customer Summary Report.
5. Deal Risk and Pipeline Velocity Dashboard
This dashboard is a forward-looking diagnostic tool. It identifies high-value deals in your pipeline that are at risk of stalling or slipping, allowing sales leaders to take proactive measures before the end of the quarter.

What to Include:
- Deal Age: The total number of days a deal has been active in the pipeline.
- Inactivity Duration: A flag indicating if a deal has had zero recorded activities (calls, emails, or meetings) for more than 14 days.
- Deal Push Rate: The number of times a deal’s projected close date has been moved to a future period.
- Weighted Pipeline Value: Calculated by multiplying the total deal value by the probability percentage of its current stage.
Real-World Use Case:
An operations team builds a custom "Deal Risk Score" using this dashboard. For example, the system automatically adds 10 risk points to a deal's score if there is no activity for more than 14 days, and 20 risk points if the projected close date has been pushed three or more times.
Managers can filter their pipeline by "Risk Score" to instantly see which high-value deals require executive sponsorship or direct intervention to close.
To learn how to build and customize these advanced risk reports within your CRM, you can read the step-by-step guide to Create sales reports in the sales analytics suite.
Additionally, if you are looking to build highly customized tracking dashboards specifically within Salesforce to monitor rep attainment and pipeline movement, check out The Ultimate Guide to Tracking Quota Attainment Per Rep in Salesforce.
Frequently Asked Questions About Sales Activity Reporting
How do sales managers use activity reports to coach without micromanaging?
The secret is to use the sales activity report as a diagnostic tool, not a weapon. Instead of using daily reports to spy on reps or demand "more calls," managers should compare individual activity metrics against the team average to identify specific coaching opportunities.
For example, if Rep A and Rep B both make 50 calls a day, but Rep A books 10 meetings while Rep B books only 2, the issue isn't effort—it's execution. The manager can listen to Rep B's call recordings and coach them on their pitch.
Conversely, if a rep has low activity but high closed-won numbers, they may have found a highly efficient outreach method that should be shared with the rest of the team.
What is the difference between activity metrics and outcome metrics?
- Activity Metrics (Inputs): These measure the volume of work performed by your sales team (e.g., calls made, emails sent, meetings booked). They are entirely within the representative's control.
- Outcome Metrics (Outputs): These measure the business results generated by those activities (e.g., win rates, revenue closed, average deal size).
Activity metrics tell you if your team is doing the work; outcome metrics tell you if that work is actually working. A healthy sales organization must track both to get a complete picture of performance.
How can we automate the collection of sales activity data?
Manual data entry is the enemy of accurate reporting. If reps have to spend an hour every day logging their calls and emails manually, data quality will suffer, and reps will have less time to sell.
To automate this process:
- Integrate your email client (Outlook/Gmail) and phone systems directly with your CRM so that every call, email, and calendar event is logged automatically.
- Use activity roll-up logic, which automatically associates activities logged under an individual contact with their parent company account record.
- Leverage AI-powered conversational analytics platforms to query your activity data without having to build complex manual reports.
Unify Your Sales Activity and Revenue Data with atSpark
Building and maintaining these reports across disconnected systems can be incredibly frustrating. Your activity metrics live in your CRM, your billing data lives in Stripe, and your historical subscription metrics live in a separate warehouse. Reconciling these data sources to find your true close rate or customer lifetime value often requires complex SQL queries or endless manual spreadsheet work.
This is where atSpark comes in.
atSpark is an AI-powered analytics platform designed specifically for SaaS companies. It unifies your billing, CRM, and subscription data into a single, cohesive source of truth.
Instead of fighting with complicated report builders or waiting on a data analyst, atSpark lets your team ask plain-English questions—like "What is our average deal size by sales rep this quarter?" or "Show me which accounts with zero activity in the last 30 days have renewals coming up"—and get instant, beautiful charts, tables, and insights.
By combining raw activity tracking with real-time billing data, atSpark gives you conversational, governed analytics without needing a single line of SQL or engineering support.
Ready to transform how you track sales performance and revenue health? Explore our Sales Activity Glossary to learn more about optimizing your metrics, or get started with atSpark today!