Why Sales Quota Percentage Is the Number Every RevOps Leader Should Understand
Sales quota percentage — also called quota attainment — is the single most telling number in your revenue plan. It shows exactly how much of a target your reps or team actually closed in a given period.
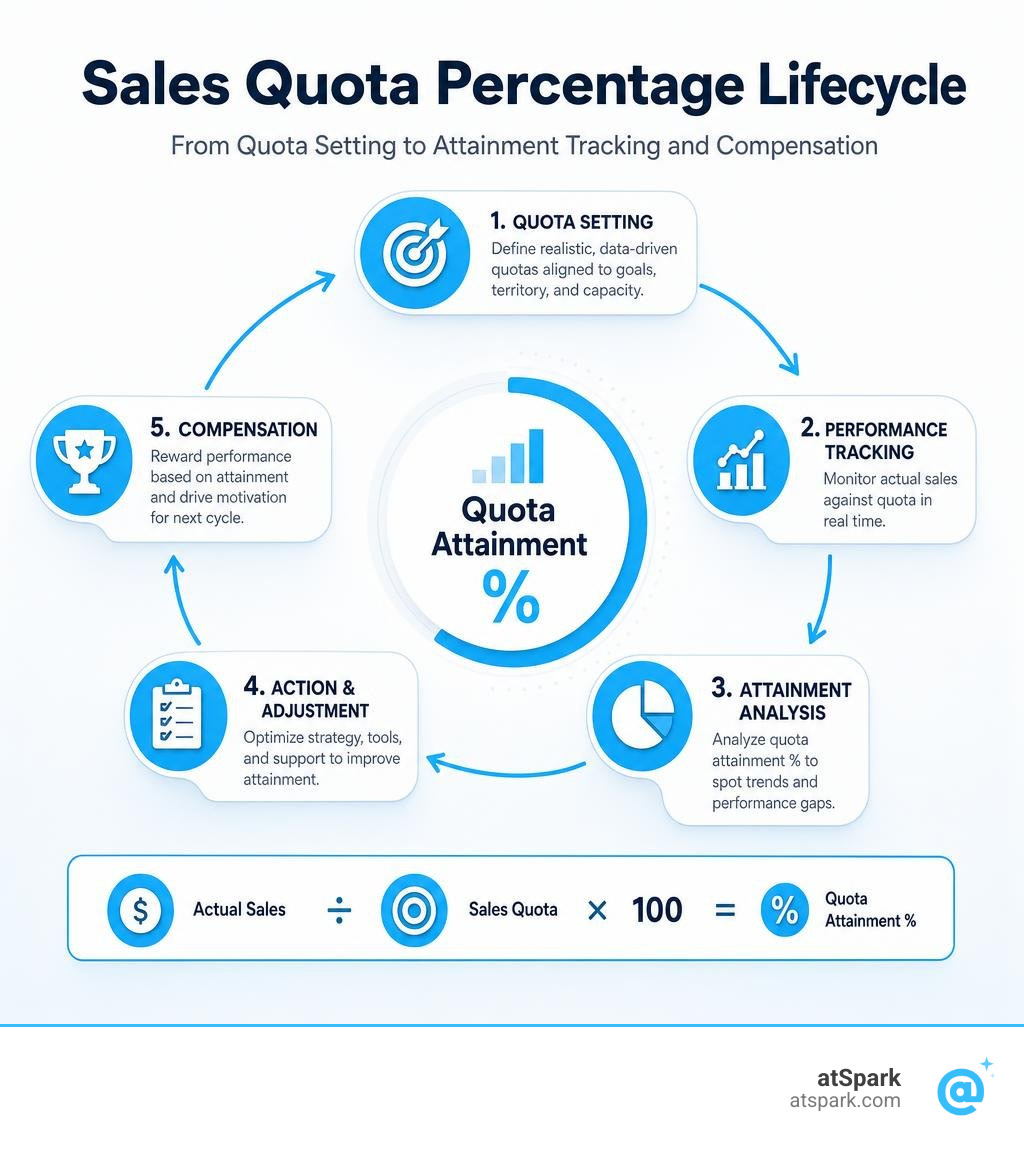
Quick answer: Sales quota attainment is calculated as:
(Actual Sales ÷ Sales Quota) × 100 = Quota Attainment %
For example, if a rep closes $80,000 against a $100,000 quarterly quota, their attainment is 80%.
Here's what healthy attainment looks like at a glance:
| Attainment Level | What It Signals |
|---|---|
| 110%+ | Overperformance — quota may be set too low |
| 100–109% | On plan |
| 80–99% | Solid but missed target |
| 60–79% | Underperforming |
| Below 60% | At risk — structural problem likely |
At the team level, a well-designed quota plan should have roughly 60–70% of reps hitting or exceeding quota in any given period. If you're seeing fewer than half your reps clear quota, that's almost always a planning problem — not a people problem.
The reality is most companies are nowhere near that benchmark. The average quota attainment for B2B sales organizations sits at just 47%, meaning more than half of all sellers miss their targets. And only 28% of sales professionals expected to hit quota at all in recent reporting.
That gap between where teams should be and where they actually land costs companies in missed revenue, blown forecasts, and rep turnover. For RevOps and finance leaders trying to build reliable revenue models, a shaky quota attainment number makes everything harder — headcount planning, pipeline coverage, board reporting.
This guide breaks down what drives that gap, what good actually looks like by role and segment, and what you can do to fix it without just lowering the bar.
Demystifying the Sales Quota Percentage: Definition and Calculations
At its core, the sales quota percentage is a metric that normalizes performance. Whether you have an enterprise Account Executive (AE) with a $1.5 million yearly target or a mid-market rep with a $500,000 target, converting their raw closed-won revenue into a percentage allows for an apples-to-apples comparison.
When we talk about performance tracking, calculating this metric correctly is the first step toward building a predictable revenue engine. If you want to quickly run the numbers for your team, you can Calculate your metrics using interactive tools.
Understanding how these percentages shift across different roles, territories, and tenures is essential for accurate forecasting. To dive deeper into the strategic implications of this metric, you can Learn more about quota attainment in our comprehensive glossary.
How to Calculate Your Individual Sales Quota Percentage
To run an individual calculation, you need two primary metrics from a specific time period:
- Closed-won revenue (actual performance)
- Target quota (the assigned goal)
The math itself is straightforward:
$$\text{Individual Quota Attainment \%} = \left( \frac{\text{Closed-Won Revenue}}{\text{Target Quota}} \right) \times 100$$
For example, if an AE has a quarterly target quota of $200,000 and finishes the quarter with $170,000 in closed-won bookings, their individual sales quota percentage is:
$$\left( \frac{170,000}{200,000} \right) \times 100 = 85\%$$
While this calculation is simple, complexity arises when you must account for commission structures, split credits, or multi-year contracts. To ensure your formulas are aligned with standard industry benchmarks, you can use a Sales Quota Ratio Calculator to quickly evaluate quota realism alongside basic attainment.
Why Your Team's Average Sales Quota Percentage Can Be Deceiving
If a sales leader tells you, "Our team achieved an average of 95% quota attainment last quarter," your instinct might be to celebrate. However, relying solely on average attainment can mask systemic issues.
Averages are highly sensitive to outliers. Imagine a team of five reps with a $100,000 quota each:
- Rep 1: $300,000 closed (300% attainment)
- Rep 2: $50,000 closed (50% attainment)
- Rep 3: $45,000 closed (45% attainment)
- Rep 4: $40,000 closed (40% attainment)
- Rep 5: $40,000 closed (40% attainment)
The total team revenue is $475,000 against a $500,000 total team quota. The average attainment is 95%.
But looking closer, only one out of five reps (20%) actually hit their target. The other four missed by more than half. This is a classic bimodal distribution (or a "long right tail" distribution), where a single top performer carries the entire plan.
Relying on this average leads to a false sense of security. If that single top performer leaves the company, your revenue engine collapses. This is why you must always track both the average attainment rate and the actual percentage of individual reps who hit 100% of their goal.
What is a Good Quota Attainment Rate? Benchmarks and Realities
What should you actually expect when analyzing your team's performance? In an ideal scenario, a healthy sales organization operates on a standard bell curve where approximately 60% of reps meet or exceed their quota, with 40% falling below.
To understand how these numbers shake out across different functions, you can read Fairview's Quota Attainment Definition which highlights how healthy benchmarks change based on sales motions.
Here is how typical quota attainment benchmarks break down by sales role and segment:
| Sales Role | Segment | Average Attainment Benchmark | Healthy % of Reps Hitting Quota |
|---|---|---|---|
| Account Executive (AE) | SMB / High-Velocity | 75% – 90% | 55% – 70% |
| Account Executive (AE) | Mid-Market | 70% – 85% | 50% – 65% |
| Account Executive (AE) | Enterprise | 60% – 80% | 45% – 60% |
| SDR / BDR | All Segments | 75% – 95% | 60% – 75% |
| Customer Success (CSM) | Enterprise / Renewal | 85% – 105% | 70% – 85% |
Individual vs. Team-Wide Attainment Goals
There is a distinct difference between an individual target and team-wide consistency. For an individual rep, hitting 100% is the goal, but maintaining a consistent 80% rule across the entire team is often more valuable than having a few reps hit 150% while the rest fail.
When 8 out of 10 reps consistently hit 80% or more of their quota, your business gains predictability. This team-wide consistency reduces sales team churn, stabilizes cash flow, and indicates that your training, enablement, and customer-facing strategies are repeatable. It also shows that your team is maintaining a healthy Win Rate across balanced territories, rather than relying on lucky breaks or single massive deals.
Industry Benchmarks: SaaS, Enterprise, and SMB
In B2B SaaS, quota benchmarks are heavily influenced by deal sizes and complexity.
- SMB Sales: Characterized by a shorter Sales Cycle Length (often under 30 days) and lower average contract values. Because the sales motion is highly transactional, average attainment rates skew higher (75-90%), and quotas are typically measured on a monthly cadence.
- Enterprise Deals: These involve multiple stakeholders, complex security reviews, and sales cycles that can last 6 to 12 months. Because of this complexity, enterprise AE attainment rates are lower on average (60-80%), but the payout structures are heavily incentivized with accelerators once a deal does close.
In Q3 2023, RepVue data showed that only 42.8% of tech sales reps hit their quotas. By 2026, the overall B2B win rates have stabilized around 19% to 21%, meaning that setting quotas based on outdated, inflated win rates from previous boom years will inevitably lead to missed expectations.
Why Most Sales Teams Only Achieve 40-50% Quota Attainment
If a healthy plan expects 60% of reps to hit quota, why does the broader B2B industry average hover around 47%?

This massive attainment gap is rarely due to a sudden, collective decline in salesperson talent. Instead, it is almost always a structural design flaw. When more than half of your sales team misses their target, the system itself is broken. A primary culprit is an unhealthy Sales Pipeline that forces reps to chase low-quality leads just to show activity.
The Trap of Top-Down Quota Setting
The most common reason for unrealistic quotas is top-down planning. This happens when the executive team or board decides on a revenue growth target (e.g., "We need to grow by 40% this year to satisfy our valuation"), and then back-solves the quotas for the sales team.
If the company needs $10 million in new revenue and has 10 AEs, each AE is handed a $1 million quota, regardless of historical performance, territory potential, or market demand.
This budget-driven approach ignores the reality on the ground. When quotas are divorced from historical data, reps quickly realize the targets are unachievable, leading to anxiety, disengagement, and high turnover. For alternative ways to design your targets, you can read about These Simple Strategies Will Help You Set Sales Quotas to protect rep motivation.
Pipeline Shortfalls and Data Quality Issues
Even with a reasonable quota, reps cannot perform without adequate pipeline coverage. Historically, companies assumed a 3x pipeline coverage ratio was sufficient (meaning a rep with a $100,000 quota needed $300,000 in active opportunities).
However, if your Sales Funnel is filled with inaccurate contact data, dead-end leads, and inflated opportunity stages, that 3x coverage is a mirage. If a third of your sales team's outbound emails bounce due to poor data quality, their actual, functional pipeline coverage drops by a third. Reps end up spending their valuable hours on administrative cleanup and dead leads rather than actual selling.
How to Set Realistic and Achievable Sales Quotas
To build a sustainable sales culture, you should transition from top-down mandates to a bottom-up approach. This means analyzing historical performance, territory capacity, and average close rates to build a quota that is challenging but mathematically achievable.
When designing your quota program, you can choose from several core quota types:
- Activity Quotas: Based on measurable actions (e.g., 50 cold calls per day, 8 completed meetings per month). Ideal for early-stage reps or SDRs building pipeline.
- Volume Quotas: Based on the number of units sold or total contract value (TCV) closed.
- Profit Quotas: Based on the gross margin of the deals closed. Useful when reps have heavy discounting authority.
- Forecast Quotas: Based on historical performance plus a realistic growth multiplier.
- Combination Quotas: A mix of activity and revenue targets to ensure reps maintain pipeline health while closing deals.
To model these targets accurately, you can use a Sales Quota Calculator to align your quota-setting with actual capacity and pipeline reality. This ensures that your overarching Sales Forecast remains grounded in data.
The Quota-to-OTE Ratio and Compensation Design
A critical component of setting quotas is the Quota-to-OTE (On-Target Earnings) ratio. This ratio compares a rep's annual quota to their total target compensation (base salary + variable commission).
$$\text{Quota-to-OTE Ratio} = \frac{\text{Annual Quota}}{\text{On-Target Earnings}}$$
In B2B SaaS, this ratio typically sits between 4x and 6x.
- Under 4x: The compensation plan may be too expensive for the company to sustain.
- Over 6x: The quota may be unrealistically high, making it incredibly difficult for the rep to earn their advertised OTE.
To drive high performance, compensation plans should feature accelerators—tiered commission rates that increase once a rep passes 100% of their quota. This rewards your top performers and maximizes Sales Efficiency by encouraging reps to push past their baseline targets.
Accounting for Ramp Periods and Tenure
One of the most common mistakes in quota planning is expecting a new hire to be 100% productive on day one. A realistic plan must incorporate ramp periods based on your average sales cycle.
If your standard sales cycle is 3 months, a new rep's ramp-adjusted quota might look like this:
- Month 1: 0% quota (focused entirely on onboarding and training Sales Activity)
- Month 2: 25% of full quota
- Month 3: 50% of full quota
- Month 4: 100% of full quota
Failing to adjust for ramp time artificially deflates your team's attainment percentage and causes premature rep burnout.
Strategies to Improve Quota Attainment Without Lowering Standards
Improving your team's sales quota percentage does not mean making the targets easier. Instead, it requires optimizing your sales enablement, refining your processes, and giving your team the tools they need to increase their overall Sales Velocity.

Real-Time Commission and Performance Visibility
One of the most effective, yet overlooked, levers for improving attainment is transparency. When reps have real-time visibility into their current attainment and pending commission payouts, their behavior changes.
Instead of waiting until the end of the month for an Excel sheet from finance, reps should be able to see exactly how much money they will make if they close a specific deal in their pipeline. This immediate feedback loop acts as a powerful motivator, encouraging them to push deals across the finish line. To see how to align your crediting rules with commission payouts, you can study the Sales Quota Attainment Formula to ensure your calculations are consistent.
Sales Coaching and Managerial Support
Investing in sales coaching has a direct, measurable impact on rep retention and quota attainment. According to industry data, 60% of sales reps are more likely to leave their job if their manager is a mediocre coach.
Effective coaching should not just focus on "closing more deals." Instead, managers should help reps analyze their sales funnel to identify specific bottlenecks, such as:
- Are they struggling with initial discovery?
- Is their Average Deal Size too low?
- Are deals stalling during security and legal reviews?
By diagnosing and coaching to these specific friction points, managers can systematically lift the performance of the middle 60% of the sales team.
Frequently Asked Questions About Sales Quotas
What is the difference between average attainment and percentage of reps hitting quota?
Average attainment is the sum of all reps' closed revenue divided by the sum of all quotas. The percentage of reps hitting quota is the count of individual reps who achieved 100% or more of their target, divided by the total number of reps.
As shown in our bimodal distribution example, a team can have a high average attainment (e.g., 95%) while only a tiny fraction of the team (e.g., 20%) actually hits their individual goals. To evaluate plan health, you must track both metrics.
How do top-performing companies achieve 80-90% attainment rates?
Top-performing companies like Miro (85% attainment), Veeva Systems (84%), and Gusto (83%) achieve these high rates by focusing on three core pillars:
- Data-Driven Quota Setting: They set quotas bottom-up, using historical performance and territory capacity rather than arbitrary top-down mandates.
- Robust Sales Enablement: They provide continuous coaching, clear sales playbooks, and modern sales tech stacks.
- High-Quality Data: They ensure their reps are working with highly accurate prospect data, reducing wasted outreach and maximizing actual selling time.
Should you adjust sales quotas mid-period if attainment is low?
Adjusting quotas mid-period should be an absolute last resort. Doing so destroys planning credibility and signals to the sales team that quotas are negotiable.
Instead of lowering the quota, sales leaders should diagnose the root cause. If the issue is a pipeline shortfall, focus on pipeline-generation activities. If the issue is a sudden shift in market conditions, consider adjusting the commission accelerators or introducing short-term incentives (spiffs) rather than changing the baseline quota.
Conclusion: Drive Predictability with Conversational Analytics
Tracking and optimizing your sales quota percentage shouldn't require a team of business analysts or complex SQL queries. To build a highly predictable revenue engine, you need instant, unified access to your CRM, billing, and subscription data.

This is where atSpark comes in. As an AI-powered analytics platform designed specifically for SaaS companies, atSpark unifies your siloed data sources into a single, reliable source of truth. Instead of spending hours building manual spreadsheets, you can ask atSpark plain-English questions like:
- "Show me our AE quota attainment distribution for last quarter."
- "Which territories have the highest pipeline coverage relative to their quotas?"
- "What is our median quota attainment compared to our average?"
In seconds, atSpark generates clean charts, detailed tables, and actionable insights — all without requiring any engineering help. By giving your RevOps, finance, and sales leaders instant visibility into performance metrics, you can make fast, data-driven decisions that keep your team motivated and your revenue on track.
Ready to take the guesswork out of your sales planning? Optimize your quota attainment tracking with atSpark and start building a more predictable revenue engine today.