Why Tracking quota attainment by rep Is Harder Than It Should Be
Quota attainment by rep is the percentage of their assigned sales target that each individual rep closes in a given period. It's one of the most important numbers in any revenue plan — and in most Salesforce orgs, it's also one of the hardest to get right.
Here's the quick answer on what the metric looks like and how it's calculated:
| Term | Definition |
|---|---|
| Formula | (Actual Sales Closed ÷ Assigned Quota) × 100 |
| Example | Rep closes $160K against a $200K quota = 80% attainment |
| Healthy team benchmark | 60-70% of reps at or above 100% of quota |
| Individual target | 100% is the goal; 80%+ is considered strong |
| Red flag | Below 50% of reps hitting quota consistently signals a quota-setting problem |
The numbers in 2026 are not encouraging. The average B2B quota attainment rate has fallen to 43% — down from 63% in 2019. Only 28% of reps hit their annual quota, the lowest figure in six years. Quotas rose 33% over four years while the number of reps actually hitting them fell 25%.
For a RevOps or Finance lead, that gap creates real problems. Which reps are at risk? Which territories are underperforming? Is the quota the problem, or the pipeline? Getting those answers out of Salesforce — without waiting on a data analyst or reconciling three spreadsheets — is what this guide is about.
This article walks through exactly how to set up quota attainment tracking per rep in Salesforce, what healthy attainment distributions look like by role and segment, and what the data says about why so many reps miss.
What is Quota Attainment by Rep and Why Does It Matter?
At its core, quota attainment by rep measures individual sales performance against a designated milestone. While it sounds simple, the way we calculate and interpret this metric directly affects our strategic decisions.
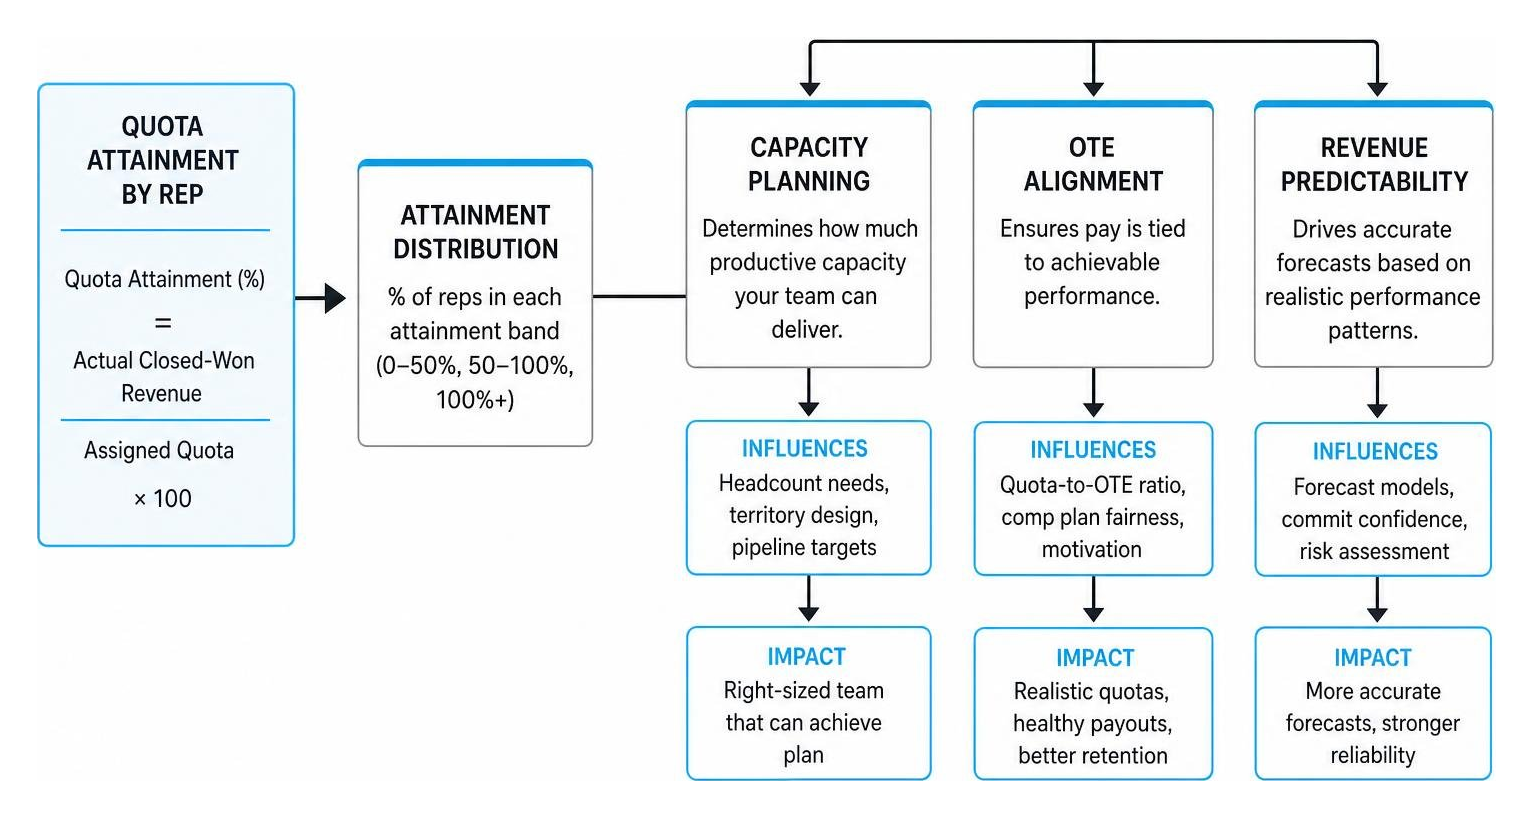
To calculate the baseline percentage, we use a simple formula:
$$text{Quota Attainment (%)} = left( frac{text{Actual Closed-Won Revenue}}{text{Assigned Quota}} right) times 100$$
For SaaS and subscription businesses, "Actual Closed-Won Revenue" is typically measured in Annual Recurring Revenue (ARR) or New ARR, while other industries might use gross contract value or unit-based counts.
How we set the denominator (the assigned quota) is where companies often run into trouble. A standard rule of thumb is to set an individual rep’s annual quota at 5x their On-Target Earnings (OTE). If a rep’s OTE is $150,000, their quota should hover around $750,000.
Setting quotas based on OTE is only part of the equation. Accurate tracking is critical for:
- Capacity Planning: If your Sales Efficiency is low because only 30% of your team is hitting their targets, your capacity model is broken. You cannot simply hire more reps to hit a larger number if the baseline assumptions about rep productivity are incorrect.
- Revenue Predictability: If your forecasting model assumes everyone hits 100% but the reality is a wide spread of underperformance, your board-level forecasts will be wildly inaccurate.
- Rep Retention and Compensation Costs: Unrealistic quotas trigger high attrition. According to Quota Attainment: Definition — Fairview, a healthy plan should see 60% to 70% of reps clearing quota. If your distribution is heavily skewed, you will lose your middle-tier reps, leaving you with high recruitment costs and a struggling sales team.
When tracking this metric, we must distinguish between total team revenue attainment and individual Quota Attainment. A team can hit 100% of its collective goal because two "mega-deal" reps achieved 300% attainment, while the remaining eight reps languished at 30%. This is a highly fragile revenue model that masks systemic issues.
How to Track Quota Attainment per Rep in Salesforce
Salesforce is the industry standard for CRM data, but out-of-the-box setups rarely track individual quota attainment well. Most companies end up exporting Salesforce data into Excel to run calculations manually. This ruins real-time visibility and makes it impossible for reps to see exactly where they stand mid-quarter.
To track this natively, you have two primary options in Salesforce:
- Salesforce Collaborative Forecasting: This built-in feature allows you to upload quota datasets directly into Salesforce (via Data Loader or the API) and map them against opportunities.
- Custom Fields and Custom Report Types: If your compensation plans are complex, you can create a custom "Quota" object that links directly to User or Opportunity records.
Regardless of the path you choose, tracking relies on consistent Sales Activity tracking and rigid CRM data hygiene. If reps do not update their opportunities, or if closed-won dates are backdated, your Sales Forecast and attainment reports will be highly inaccurate.

Step-by-Step: Setting Up Quota Attainment by Rep Reports in Salesforce
If you want to build a native report in Salesforce to track this metric, here is the standard workflow using Collaborative Forecasting:
Step 1: Enable Forecasting and Upload Quotas
Go to Setup, search for Forecasts Settings, and enable Collaborative Forecasting. Next, use the Forecasting Quotas page in Setup (or the Data Loader) to upload your quota CSV. This file must map the User ID, the Territory (if applicable), the currency, the effective period (month/quarter), and the exact quota dollar amount.
Step 2: Create a Custom Report Type
If you want to compare quotas directly to opportunity data in custom layouts, navigate to Custom Report Types and create a new report type. Set the primary object as Users and relate it to Forecasting Quotas, or use the standard Forecasting Items report type.
Step 3: Build Custom Summary Formulas
Within your report builder, you need to calculate the actual attainment percentage. Add a custom summary formula to your report. The formula will look similar to this:
ForecastingItem.ClosedAmount:SUM / ForecastingQuota.QuotaAmount:SUM
Format the output as a percentage. This ensures that as your groupings collapse by rep, team, or region, Salesforce calculates the correct mathematical percentage rather than adding up individual percentage figures.
Step 4: Configure Dashboard Components and Permissions
Add your new report to a shared executive dashboard. Use a gauge component to show team-wide attainment, and a horizontal bar chart to show individual quota attainment by rep. Finally, ensure your user permissions are configured so reps can see their own real-time progress, while managers can view their entire team's performance.
Common Salesforce Tracking Mistakes to Avoid
Even experienced RevOps teams run into implementation errors when building these reports. Here are four common pitfalls:
- Ignoring Proration for Ramping Reps: If a new rep starts mid-quarter, assigning them a full quota in Salesforce skew your team averages. You must prorate their targets based on their ramp schedule.
- Double-Counting Shared Deals: If two reps co-sell a deal and both receive credit, your report will show inflated attainment numbers unless you establish clear split-credit rules in Salesforce.
- Mismatched Date Ranges: Ensure both your numerator (closed-won opportunities) and denominator (assigned quota) cover identical date ranges. A common mistake is comparing a rep's monthly closed revenue against their quarterly quota.
- Failing to Adjust for Currency Conversions: For global sales teams, Ensure Salesforce multi-currency is active and that your quotas and opportunities use the same exchange rate tables to prevent conversion discrepancies.
Benchmarks: What Does Healthy Quota Attainment Look Like?
To understand if your team's performance is healthy, you need to look beyond the overall average. A common mistake is celebrating a team average of 80% attainment, without realizing that three top performers at 200% are masking seven reps who are failing to reach 40%.
According to Quota Attainment: What the Numbers Show, a healthy sales plan should result in a normal bell-shaped distribution curve:

In a healthy distribution, roughly 60% to 70% of your reps should hit or exceed their individual targets. If your team's performance is bimodal — meaning your reps are either wildly successful or failing completely — you likely have issues with territory design, enablement, or lead distribution.
| Metric | Healthy Target | Warning Sign |
|---|---|---|
| % of Reps Hitting Quota | 60% – 70% | Under 50% (indicates quota inflation) |
| Average Team Attainment | 75% – 85% | Under 50% or Over 95% (indicates soft quotas) |
| Win Rate (Qualified Opps) | 25% – 35% | Under 20% (indicates weak sales execution) |
| Pipeline Coverage Ratio | 3x – 4x | Under 3x (indicates insufficient pipeline) |
If your team's average attainment is consistently above 95%, your quotas are likely set too low, meaning you are leaving revenue on the table and overpaying on commissions. Conversely, if average attainment sits below 50%, your capacity planning model is likely built on unrealistic assumptions.
Benchmarking Quota Attainment by Rep Across SaaS Segments
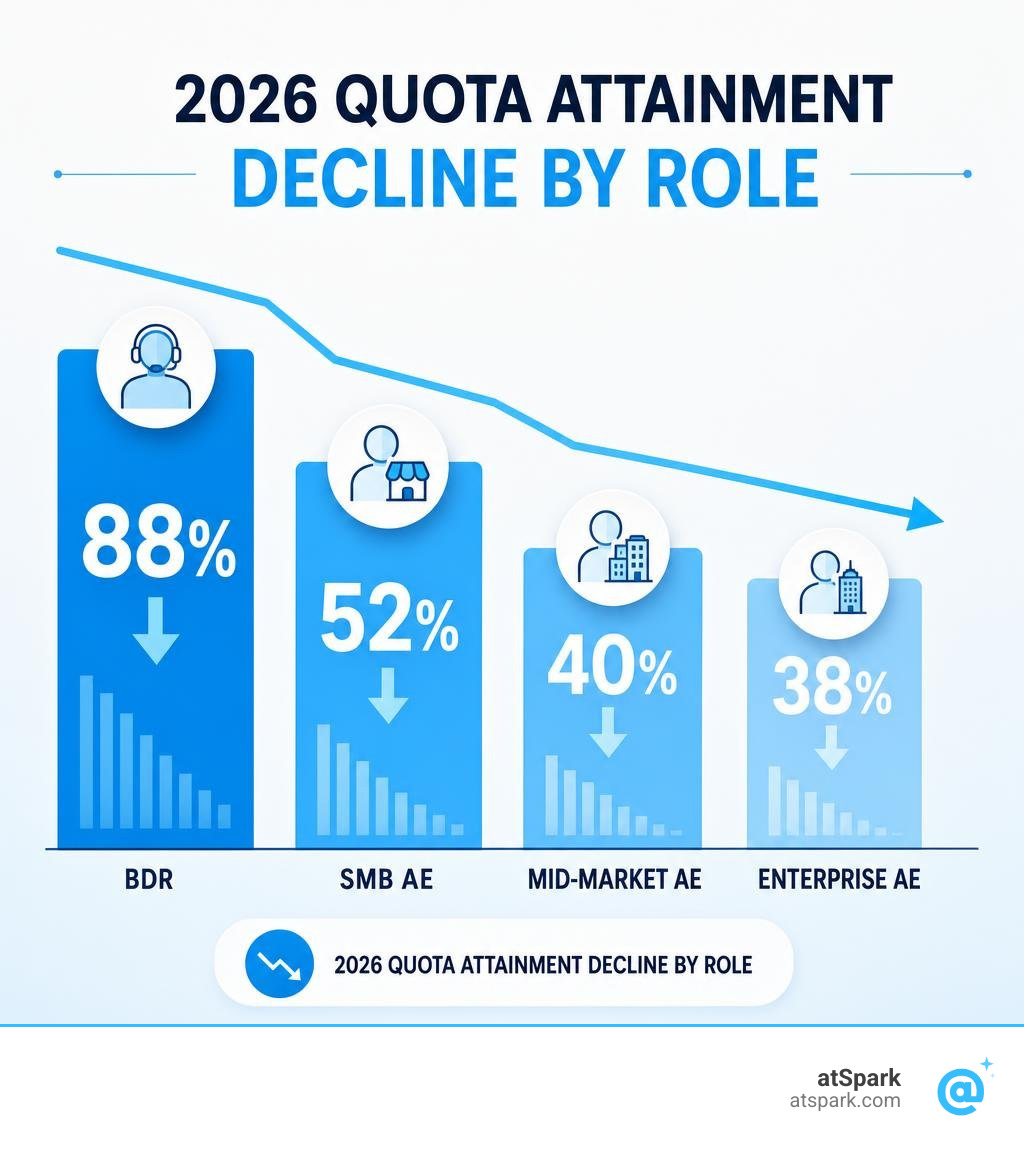
Quota attainment varies significantly depending on the sales motion, deal complexity, and Average Deal Size. Here is how average attainment breaks down across SaaS segments in 2026:
SMB Account Executives (Average Attainment: 52%)
SMB reps benefit from shorter sales cycles and higher transaction volumes. Because their deals are less complex, their performance distributions tend to be tighter and more predictable.
Mid-Market Account Executives (Average Attainment: 40%)
As deal sizes increase, buying committees grow. Mid-market reps often struggle with deal slippage, resulting in a lower average attainment rate compared to their SMB peers.
Enterprise Account Executives (Average Attainment: 38%)
According to the Sales Quota Attainment Statistics: 2026 Data by Role — Gangly Blog, Enterprise AEs have the lowest average attainment. Long, complex sales cycles (often exceeding 230 days) and buying committees of 8 to 11 stakeholders make quarterly targets difficult to hit consistently.
Business Development Reps (Average Attainment: 88%)
BDRs and SDRs measured on activity-based quotas (such as meetings booked or opportunities qualified) show much higher attainment rates. This is because their goals are based on leading indicators within their direct control.
Customer Success Managers (Average Attainment: 85% - 105%)
CSMs focused on net retention or expansion ARR show the highest and most stable attainment rates, as they work with an established customer base.
For a deeper dive into these benchmarks, you can explore the Sales Quota Attainment Rate: 2026 Benchmarks and How — Gangly Blog.
Why Reps Miss Quota: Structural vs. Behavioral Factors
When a rep misses quota, sales leaders often blame their work ethic or closing skills. However, the data reveals that most quota misses are caused by structural, systemic issues rather than individual performance.
Structural Factors (Within the Company’s Control)
- Quota Inflation: Many SaaS companies are still running quotas set during the 2021 hyper-growth era. Quotas have risen 33% over the last four years, while the pipeline has remained flat. This creates an unachievable target from day one.
- The Administrative Burden: The average sales rep spends only 28% to 30% of their workweek actually selling (roughly 11 hours). The remaining 70% is consumed by manual CRM data entry, admin tasks, and internal meetings.
- Longer Sales Cycles and Larger Buying Committees: The average enterprise Sales Cycle Length now spans over 10 months, involving 6 to 13 stakeholders. When a sales process is this complex, deal slippage is common, making annual quota structures a poor fit for actual Sales Velocity.
- Poor Territory and Lead Distribution: Unbalanced territory design leads to a few reps getting high-intent inbound leads, while others struggle with cold outbound prospecting.
Behavioral Factors (Within the Rep's Control)
- Insufficient Pipeline Coverage: Reps often fail to maintain a healthy Sales Pipeline. To hit their targets, reps need a minimum of 3x to 4x pipeline coverage relative to their quota. Relying on a 1x or 2x coverage ratio makes hitting their numbers mathematically unlikely, even with a high Win Rate.
- Single-Threaded Deal Execution: Failing to build relationships with multiple stakeholders early in the Sales Funnel is a common reason deals stall. Top performers multi-thread by engaging three or more stakeholders by week four of the sales cycle.
- Slow Response to Buying Signals: In today's market, speed matters. Reps who fail to follow up on high-intent buyer signals within 24 hours see their conversion rates drop significantly.
To improve performance, companies must address these structural issues. According to Sales Quota Attainment: Formula & Benchmarks, investing in sales enablement, reducing administrative tasks, and giving reps real-time visibility into their commission structures are the most effective ways to boost attainment.
Frequently Asked Questions About Quota Attainment
What is a good quota attainment rate for a sales team?
At the team level, a healthy benchmark is to have 60% to 70% of your reps hit 100% or more of their individual quota. If your overall team average is 80% but it is driven by a few top performers while the majority of the team is struggling, your sales model is fragile.
How does ramp time affect quota attainment calculations?
New hires should not be held to full-quota expectations immediately. A standard ramp schedule looks like this:
- Days 1–30: Focus on product training and system onboarding (0% quota).
- Days 31–60: Focus on pipeline generation and initial outreach (25% quota).
- Days 61–90: Target first closed deals and build toward 3x pipeline coverage (50% to 75% quota).
- Day 91+: Transition to 100% of the standard monthly or quarterly quota.
Failing to account for these ramp periods in your reporting will skew your team-wide attainment metrics.
Why is average quota attainment declining in 2026?
The decline from 63% in 2019 to 43% in 2026 is driven by several compounding factors:
- Quotas have risen 33% over the last four years, while pipeline growth has remained flat.
- The average B2B buying committee has expanded, leading to longer sales cycles.
- Administrative tasks and CRM data entry consume up to 70% of a rep's workweek, leaving less time for actual selling.
Conclusion: Get Real-Time Visibility Without the Salesforce Headache
Tracking quota attainment by rep in Salesforce is essential for accurate capacity planning and revenue predictability. However, building and maintaining these reports inside Salesforce often requires complex custom fields, manual CSV uploads, and constant maintenance.
This is where atSpark can help.

atSpark is an AI-powered analytics platform designed for SaaS companies. It unifies your billing, CRM (including Salesforce), and subscription data into a single, reliable source of truth.
Instead of building complex Salesforce report types or writing custom SQL, atSpark allows you to ask plain-English questions like:
- "Show me quota attainment by rep for Q2, grouped by tenure."
- "Which enterprise reps have less than 3x pipeline coverage for next quarter?"
- "What is our current sales efficiency compared to our ramp-adjusted quota plan?"
atSpark instantly generates the charts, tables, and insights you need, giving your RevOps, Finance, and Sales leadership teams real-time visibility without the engineering overhead.
Want to see how easy tracking Quota Attainment can be? Book a demo with atSpark today and get the answers you need in seconds.