Why Viewing Power BI Dashboards Inside Salesforce Changes How Revenue Teams Work
Power BI in Salesforce lets you embed rich, interactive dashboards directly inside your CRM — so your sales reps, RevOps leads, and finance team see live analytics without ever leaving Salesforce.
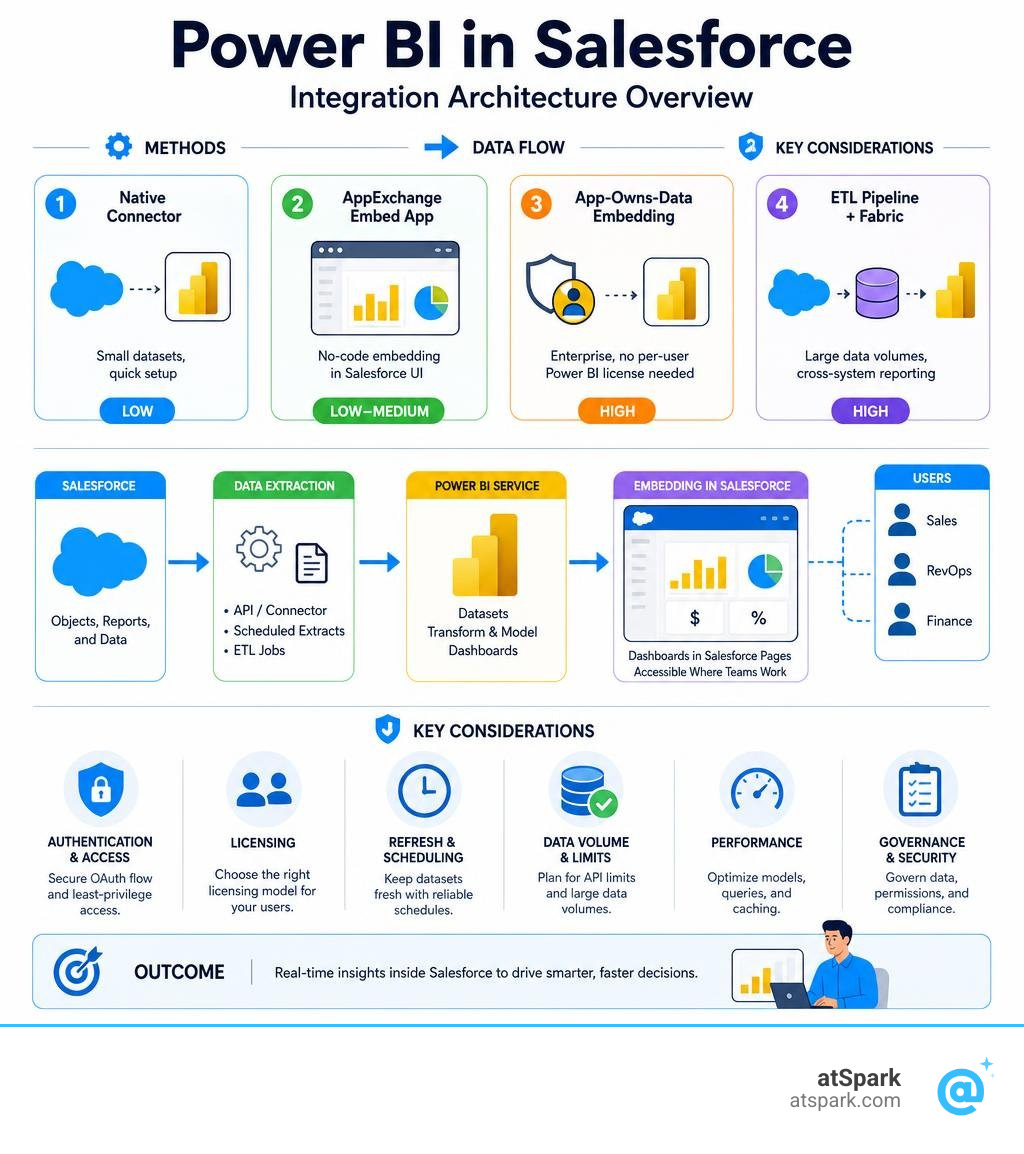
Here's a quick overview of how it works:
| Method | Best For | Complexity |
|---|---|---|
| Native Power BI Connector | Small datasets, quick setup | Low |
| AppExchange Embed App | No-code embedding in Salesforce UI | Low–Medium |
| App-Owns-Data Embedding | Enterprise, no per-user Power BI license needed | High |
| ETL Pipeline + Fabric | Large data volumes, cross-system reporting | High |
The core idea is straightforward: Power BI connects to your Salesforce data, builds dashboards, and those dashboards get surfaced inside Salesforce pages where your team already works.
But getting there cleanly — without hitting API limits, OAuth errors, or stale data — is where most teams run into trouble.
The Salesforce Reports API, for example, caps exports at 2,000 rows. That's fine for a small team. For a SaaS company with a large pipeline, it silently truncates your data without any warning. You may not even realize your revenue numbers are incomplete.
There's also the authentication layer, licensing decisions, refresh scheduling, and the question of whether each Salesforce user needs their own Power BI license (spoiler: with the right setup, they don't).
This guide walks through every layer — from the simplest connector setup to production-ready embedded analytics — so you can choose the right approach for your team's scale and security requirements.
Architectural Methods for Deploying Power BI in Salesforce
When planning your integration, you must first decide how data will flow between Salesforce and Power BI. Choosing the wrong architecture early on can lead to broken dashboards, sluggish performance, and exhausted API quotas.
We generally see organizations fall into one of three architectural patterns:
- Direct Integration (Native Connectors): Power BI Desktop connects directly to Salesforce APIs to pull data during a refresh.
- Staged Integration (Power BI Dataflows): Power BI Online extracts data from Salesforce into cloud storage (Dataflows) on a schedule, acting as a reusable semantic layer.
- Data Warehousing (ETL/ELT Pipelines): Data is extracted from Salesforce using an ETL tool, loaded into a cloud data warehouse (like Snowflake, SQL Server, or Microsoft Fabric), and Power BI connects directly to the warehouse.
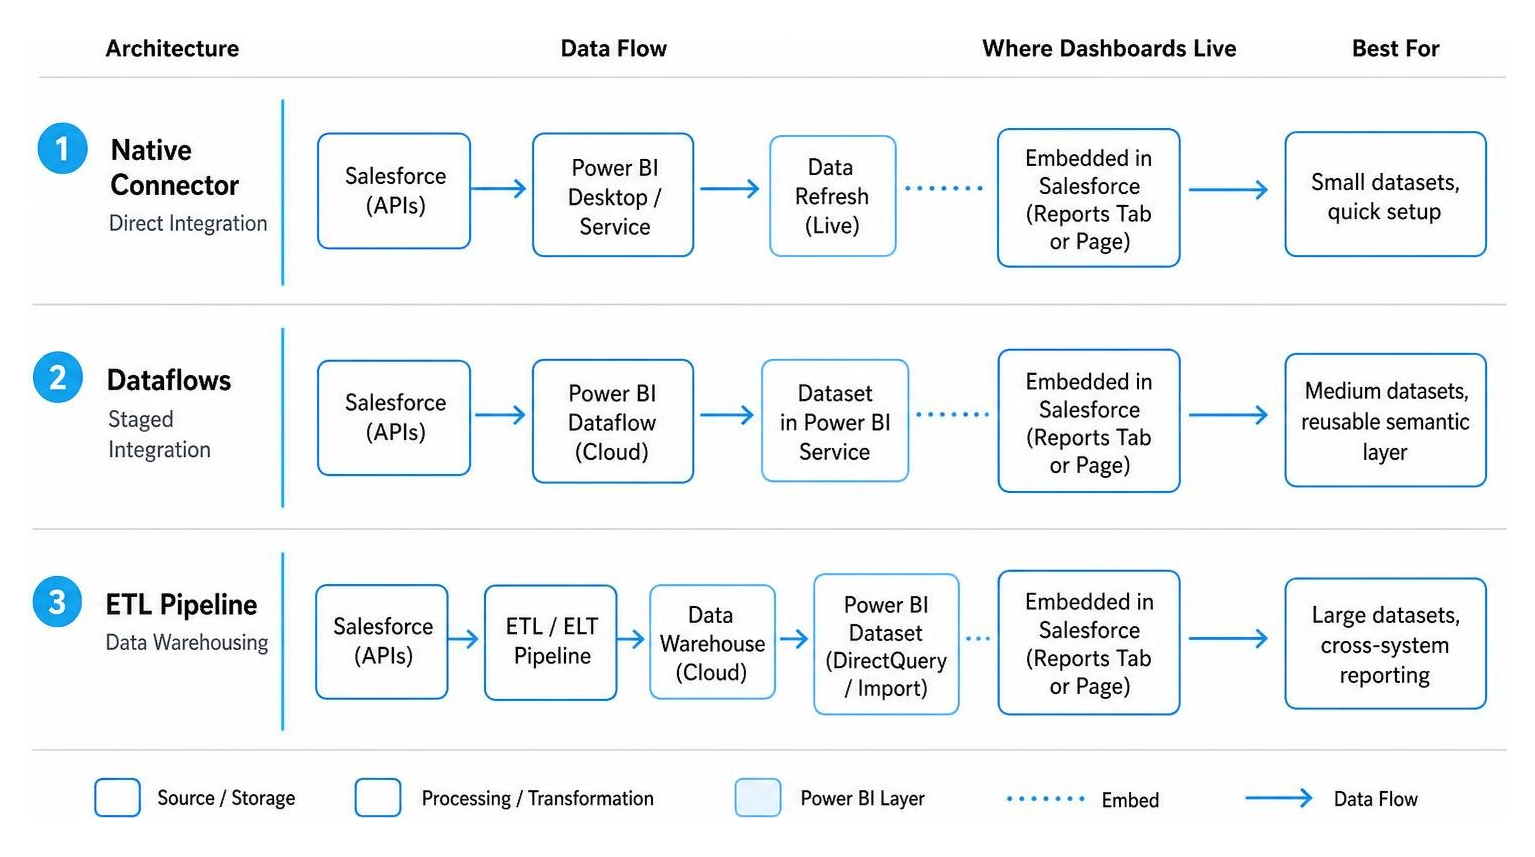
Each of these methods comes with distinct trade-offs in terms of scalability, API limit consumption, and setup complexity.
To help you choose the right path for your organization in 2026, we have broken down these methods in detail:
- Native Connectors: These are highly convenient for rapid prototyping and small datasets. However, they are highly dependent on Salesforce API quotas. Because they query Salesforce directly during every refresh, a complex report with multiple queries can quickly deplete your daily API limits.
- Power BI Dataflows: This approach centralizes your Salesforce data extraction. Instead of five different reports querying the Salesforce API independently, a single Dataflow pulls the data once and stores it. Your reports then query the Dataflow, dramatically reducing API pressure.
- ETL/ELT to a Data Warehouse: This is the gold standard for enterprise environments. It decouples your reporting layer entirely from your transactional CRM database. By staging your CRM records in a dedicated warehouse, you can perform complex historical analysis, merge Salesforce data with ERP or billing systems, and run high-frequency refreshes without ever worrying about Salesforce API thresholds.
If you are evaluating how to structure your SaaS reporting architecture, we recommend looking at our breakdown of Vs/Power Bi to understand how Power BI positions itself against other enterprise BI solutions. Additionally, integrating your CRM data with a unified platform like SaaS Analytics and Power BI can help simplify cross-functional reporting across your entire tech stack.
Configuring the Native Power BI in Salesforce Connector
If you decide to start with the native route, Microsoft provides two primary connectors within Power BI Desktop: the Salesforce Reports connector and the Salesforce Objects connector.
You can learn the basic setup steps directly from the official Microsoft documentation: Connect to Salesforce with Power BI Desktop - Power BI | Microsoft Learn .
However, it is vital to understand the structural differences between these two options:
- The Salesforce Reports Connector: This connector targets pre-built reports within your Salesforce org. While it is incredibly easy to use, it relies on the Salesforce Reports API, which has a hard restriction supporting up to 2,000 rows of data. If your Salesforce report contains 2,001 rows, the connector will pull 2,000 and stop, without throwing an error. This silent truncation can lead to highly inaccurate executive dashboards.
- The Salesforce Objects Connector: This connector bypasses pre-built reports and queries the underlying database tables directly (such as Account, Contact, or Opportunity). It does not suffer from the 2,000-row cap, making it the preferred native option for larger datasets.
To connect using the Objects connector, open Power BI Desktop, navigate to Get Data, select Online Services, and choose Salesforce Objects. You will be prompted to choose between your Production or Custom domain environment and sign in using your Salesforce credentials.
Tip: Always ensure your Salesforce profile has the "API Enabled" checkbox selected, and avoid using Salesforce trial accounts, as they do not support API access.
Scalable Alternatives: ETL Pipelines, Dataflows, and Microsoft Fabric
For rapidly growing SaaS companies, native connectors eventually hit a wall. As your CRM volume grows to hundreds of thousands of contacts, opportunities, and custom object records, direct queries become painfully slow.
This is where modern data architectures like Microsoft Fabric and Dataflow Gen2 come into play.
In 2026, the standard enterprise pattern involves using Microsoft Fabric to build a highly scalable Salesforce integration. Here is how we recommend structuring this pipeline:
- Dataflow Gen2 & Lakehouse Storage: You can use Microsoft Fabric's Dataflow Gen2 to orchestrate scheduled extractions from Salesforce. Instead of loading this data straight into a semantic model, you land it directly into a Fabric Lakehouse.
- Direct Lake Mode: Once your Salesforce tables are safely stored in your Lakehouse as Delta tables, Power BI can query them using Direct Lake mode. This gives you the performance of Import mode with the near-real-time capabilities of DirectQuery, completely bypassing Salesforce's runtime query limits.
- Cross-System Joins: Landing your CRM data in a Lakehouse allows you to easily join Salesforce opportunity data with your actual billing and subscription engine data. This creates a single source of truth for metrics like Customer Acquisition Cost (CAC) and Customer Lifetime Value (LTV).
Overcoming Salesforce API Limits and Row Restrictions
If you are stuck using the native connectors, you must actively manage Salesforce's strict platform limits. The two most common roadblocks are the 2,000-row cap on reports and your organization's daily API request allocation.
To dive deeper into the technical mechanics of the Reports connector, refer to the Power Query Salesforce Reports connector. - Power Query | Microsoft Learn . For querying raw tables, see the Power Query Salesforce Objects connector - Power Query | Microsoft Learn .
To keep your dashboards running smoothly without hitting these limits, we recommend implementing the following best practices:
- Use the Objects Connector Over the Reports Connector: As mentioned, the Objects connector does not suffer from the 2,000-row limit. It allows you to pull millions of rows, provided you stay within your API limits.
- Implement Incremental Refresh: Do not reload your entire Salesforce database every time your dashboard updates. Set up an Incremental Refresh policy in Power BI using fields like
LastModifiedDateorSystemModstamp. This ensures Power BI only requests records that have changed since the last refresh, reducing API call volume by up to 90%. - Filter at the Source (Query Folding): Use Power Query to filter out old or irrelevant records (such as closed opportunities from five years ago) before loading them into your model. This keeps your dataset lean and speeds up refresh times.
- Mind the Token Limit: Salesforce enforces a strict security limit of five authentication tokens per application. This means you should ensure you have five or fewer Salesforce datasets imported under the same credentials to prevent older connections from being silently logged out.
Bypassing Limits with AppExchange Solutions and Custom Apex
When standard Power Query configurations still aren't enough, you can look inside the Salesforce ecosystem for solutions. Many organizations turn to dedicated AppExchange packages or custom Apex development to build highly optimized export pipelines.
The main advantage of using an AppExchange connector or a custom Apex-based export is that it shifts the heavy lifting inside Salesforce.
Instead of Power BI reaching in and executing resource-intensive queries that burn through your API limits, you can configure Salesforce to package, compress, and push the data out to an external cloud staging environment (like Azure Blob Storage or an SQL database) on a schedule.
For example, a custom Apex class can be written to run a daily batch job that aggregates complex opportunity historical data, writes it to a custom metadata-driven staging table, and exposes it via a highly optimized custom REST endpoint.
Power BI then queries this single, pre-aggregated endpoint rather than trying to join multiple massive tables over standard APIs. This keeps your Salesforce API usage minimal while ensuring your dashboards load instantly.
Security, Governance, and Authentication Setup
Embedding corporate financial data and sales pipelines inside a CRM requires rigorous security controls. You must ensure that users only see the data they are authorized to access, and that your authentication mechanisms are production-ready.
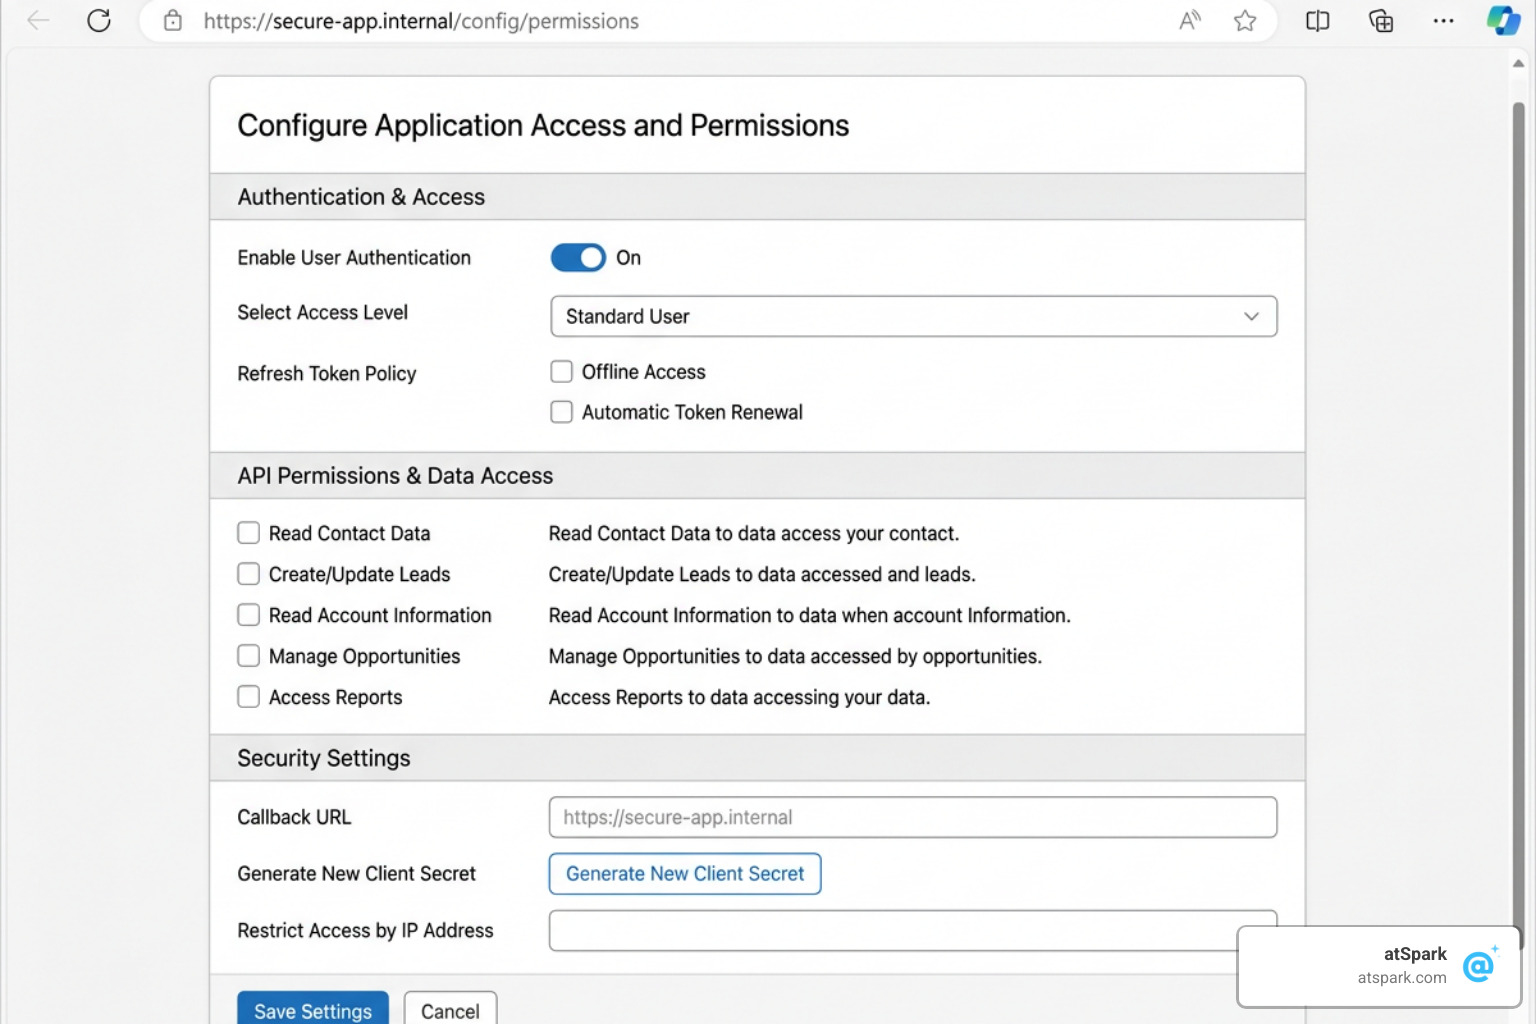
When setting up your security framework, pay close attention to these three pillars:
- Row-Level Security (RLS): You can define RLS roles within Power BI to restrict data access based on the logged-in user. For example, a regional sales manager in Europe should only see European opportunities, even if the underlying dataset contains global sales data.
- OAuth 2.0 Authentication: Always use OAuth 2.0 for connecting Power BI to Salesforce. Avoid hardcoding service account credentials. OAuth ensures that Power BI accesses Salesforce using secure tokens that can be revoked by an administrator at any time.
- Session Settings: In Salesforce, ensure that security settings like "Lock sessions to the IP address from which they originated" do not conflict with Power BI Service's cloud-based refresh IPs, which can change dynamically.
Implementing App-Owns-Data Embedding for Power BI in Salesforce
When embedding Power BI reports inside Salesforce, you have two primary options: User-Owns-Data and App-Owns-Data embedding.
- User-Owns-Data (Embed for your organization): This requires every Salesforce user viewing the report to have their own Power BI Pro or Premium Per User (PPU) license and an active Microsoft Entra ID (Azure AD) account. When they open Salesforce, they will be prompted to sign in to Power BI before the report loads.
- App-Owns-Data (Embed for your customers/users): This is a much more seamless and cost-effective approach for enterprise environments. It uses a single master account or a Service Principal to authenticate with Power BI. Your Salesforce users do not need individual Power BI licenses or Microsoft accounts. Salesforce handles the authentication behind the scenes, requests an embed token from the Power BI REST API, and displays the dashboard securely.
To see a complete, production-ready implementation of this architecture using Salesforce DX (SFDX), Apex, and Lightning Web Components, explore the README.md at main · PowerBiDevCamp/SalesforceAppOwnsDataEmbedding .
Using the App-Owns-Data method, your Apex controller (such as a class named PowerBiEmbedManager) utilizes the Client Credentials Flow to acquire an access token from Microsoft. It then calls the Power BI REST API to generate an embed token for the specific report and workspace, passing this token down to a Lightning Aura or Web Component to render the report safely.
Troubleshooting Common Authentication and Publishing Errors
Even with perfect planning, you are likely to run into a few common configuration errors when publishing your dashboards to the Power BI Service.
One of the most frequent issues occurs when a report refreshes perfectly in Power BI Desktop, but fails with an OAuth or credential error once published to the cloud.
This is almost always caused by missing connected app approvals within your Salesforce organization. To resolve this, your Salesforce administrator must explicitly install and approve the Power BI Query and Power BI Query Refresh connected apps under your approved OAuth apps list.
For a detailed walkthrough of this specific issue and how to resolve it, check out the community troubleshooting thread: Solved: Unable to publish report that contains Salesforce ... - Microsoft Fabric Community .
Additionally, make sure your Salesforce admin has configured your security policies to set Permitted Users to "Admin approved users are pre-authorized" and relaxed IP restrictions if your corporate network enforces strict location-based access.
Frequently Asked Questions about Power BI in Salesforce
What is the row limit for the Salesforce Reports connector in Power BI?
The Salesforce Reports connector is subject to a hard platform limit of 2,000 rows of data due to limitations in the Salesforce Reports API. If your source report exceeds this limit, Power BI will load exactly 2,000 rows and complete the refresh without showing any warnings or errors. To bypass this restriction, you should use the Salesforce Objects connector, which queries raw tables directly and has no row-cap limitations.
How do I resolve OAuth authentication errors when publishing to Power BI Service?
OAuth failures in the Power BI Service usually happen because your Salesforce administrator has not approved Microsoft’s client applications. To fix this, have your Salesforce admin navigate to Connected Apps OAuth Usage in Salesforce Setup and ensure that both the "Power BI Query" and "Power BI Query Refresh" apps are installed, set to "Relax IP restrictions," and authorized for your users.
Can I embed Power BI reports in Salesforce without paying for individual user licenses?
Yes, by using the App-Owns-Data embedding pattern. This method utilizes a dedicated Azure Service Principal or a master Power BI account to generate secure embed tokens via the Power BI REST API. Salesforce then renders the report using these tokens. Because the application "owns" the data connection, individual Salesforce viewers do not need their own Power BI Pro licenses or Microsoft Entra ID credentials. The same pattern applies when your viewers are customers rather than colleagues, though the economics change — we weigh it against every other option in our guide to sharing Power BI dashboards with external customers.
Conclusion
Integrating Power BI in Salesforce is an excellent way to break down data silos and put actionable insights right where your sales and operations teams spend their day. By understanding the differences between native connectors, leverage points like Microsoft Fabric, and embedding frameworks like App-Owns-Data, you can build a stable, fast, and secure analytics experience.
But let's be honest: setting up data pipelines, managing API quotas, configuring OAuth apps, and maintaining complex DAX models is a massive engineering burden.
If you are a SaaS company looking for a simpler, faster way to analyze your CRM, billing, and subscription data, we built atSpark for you.
atSpark is an AI-powered analytics platform that unifies your billing, CRM, and subscription data into a single, governed semantic layer. Instead of writing SQL, building complex data warehouses, or wrestling with embed tokens, your team can simply ask plain-English questions and get instant charts, tables, and deep business insights.
Want to see how easy analytics can be? Ask your data anything without SQL and start getting answers instantly.