Why Guessing Your Progress Is Costing You More Than You Think
A percentage to goal calculator gives you an instant, objective answer to one of the most important questions in business: how close are you, really?
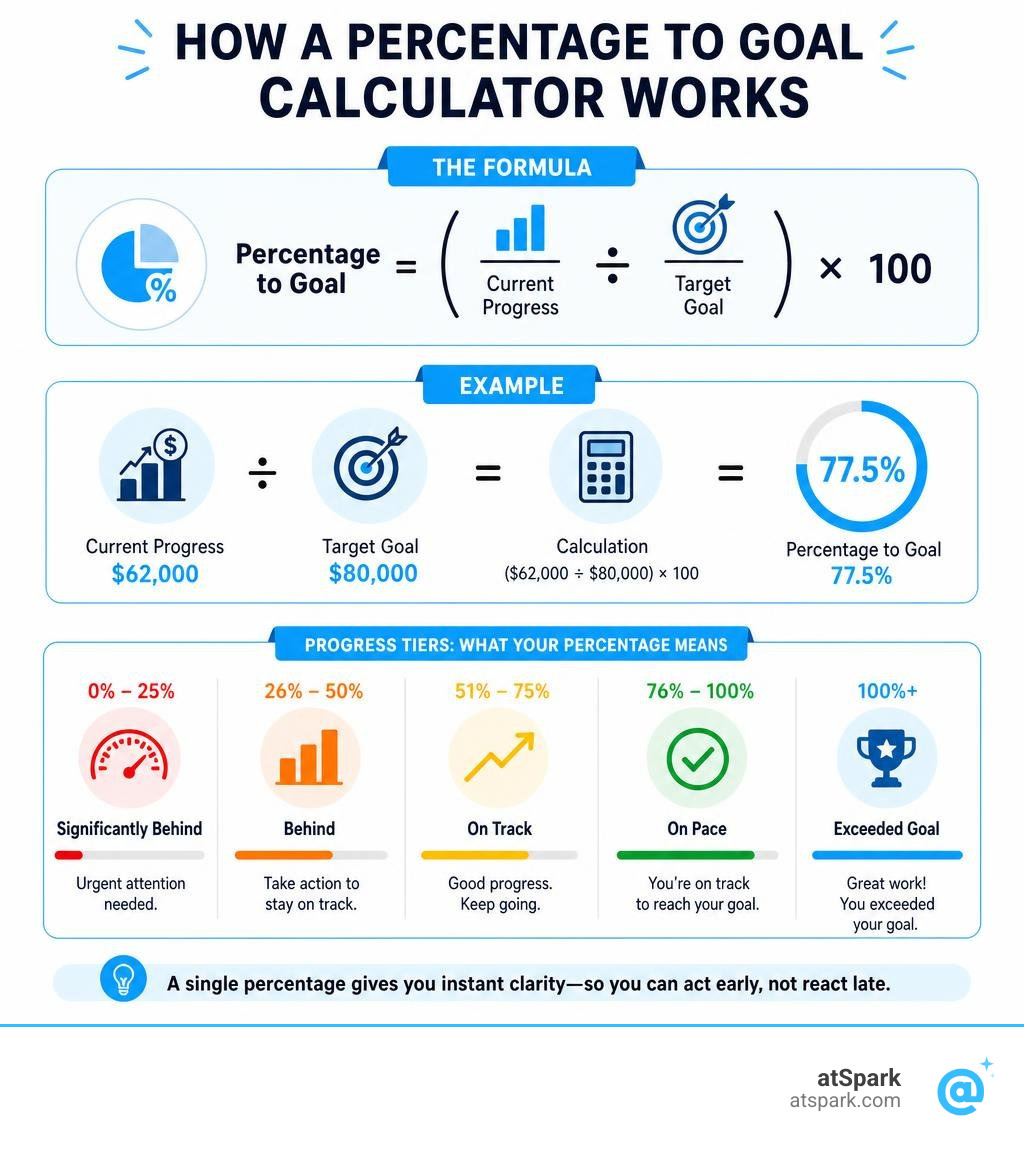
Quick answer: To calculate your percentage to goal, use this formula:
Percentage to Goal = (Current Progress ÷ Target Goal) × 100
For example:
- Current progress: $62,000 in revenue
- Target goal: $80,000 quota
- Result: ($62,000 ÷ $80,000) × 100 = 77.5% of goal
That's it. No guesswork. No gut feel. Just a clear number.
Yet most revenue and RevOps teams still piece together goal progress from spreadsheets, disconnected dashboards, or a Slack message from someone who ran a report three days ago. By the time the number reaches you, it's already stale.
Tracking progress as a percentage isn't just math — it's the difference between reacting early and reacting too late. Whether you're monitoring a sales quota, an MRR growth target, or a net revenue retention goal, a single percentage number tells you immediately whether you're ahead, behind, or on pace.
This guide walks you through exactly how to calculate it, how to handle edge cases (like non-zero baselines or results over 100%), and how to use it across the metrics that matter most in SaaS.
Essential percentage to goal calculator terms:
What is a Percentage to Goal Calculator and How Does It Work?
A percentage to goal calculator is a mathematical tool designed to measure how close you are to achieving a specific, quantifiable target. Instead of looking at raw numbers—which can be difficult to contextualize across different team sizes or project scales—converting your progress into a percentage standardizes your view of success.
In business operations, keeping track of your progress helps evaluate your performance objectively. Observing your progress can also be a great motivator for teams pushing to cross the finish line.

To make this work, the calculator requires two primary inputs:
- Actual Progress (Current Value): The measurable amount you have completed or earned so far.
- Target Goal (Desired Value): The ultimate number you aim to reach within a set timeframe.
When you input these numbers into an interactive widget like the Percent of Goal Calculator - Creative Widgets, the tool divides your actual progress by the target goal and converts the resulting decimal into a percentage. This instantly tells you how much of the journey you have completed, and by subtraction, how much effort remains.
The Basic Formula of a Percentage to Goal Calculator
The underlying mathematics behind a percentage to goal calculator are incredibly straightforward. The standardized formula is:
Percentage Achieved = (Progress Made ÷ Desired Goal) × 100
Let's look at how this works across a few different scenarios using the Percent to Goal Calculator | Track Your Progress Easily method:
- Scenario A (Task Management): You have completed 15 tasks out of a project backlog of 26 total tasks.
- Calculation: (15 ÷ 26) × 100 = 57.69%
- Result: You are approximately 57.69% of the way to completing your project.
- Scenario B (Lead Generation): Your marketing campaign has generated 20 qualified leads out of a target of 400.
- Calculation: (20 ÷ 400) × 100 = 5%
- Result: You have reached 5% of your lead generation target.
- Scenario C (Customer Onboarding): Your customer success team has successfully onboarded 440 accounts out of a quarterly goal of 1,000.
- Calculation: (440 ÷ 1,000) × 100 = 44%
- Result: You have completed 44% of your onboarding goal.
One critical mathematical rule to remember is that your target goal value cannot be zero. Because division by zero is mathematically undefined, a valid percentage to goal calculator will always prompt you to enter a non-zero number in the goal field to avoid calculation errors.
Calculating Progress with a Non-Zero Baseline
The basic formula works perfectly when you are starting from absolute zero (such as earning your first dollar or completing your first task). However, real-world tracking often involves starting from a baseline value other than zero.
For instance, if you are tracking a weight loss journey, your starting weight isn't zero. If you start at 230 pounds and want to reach 180 pounds, your "zero progress" point is 230, and your target is a 50-pound reduction.
To calculate the percentage to goal when you have a non-zero starting baseline, you must normalize the progress. You can use the specialized baseline formula found on the Percentage To Goal Calculator - Track Progress Fast:
Percentage to Goal = ((Starting Value - Current Value) ÷ (Starting Value - Goal Value)) × 100
Let's break this down with a step-by-step example:
- Identify your three variables:
- Starting Value = 230 lbs
- Current Value = 210 lbs
- Goal Value = 180 lbs
- Calculate progress made so far: Subtract your current value from your starting value.
- 230 - 210 = 20 lbs lost.
- Calculate total distance needed: Subtract your goal value from your starting value.
- 230 - 180 = 50 lbs total loss required.
- Divide progress by total distance and multiply by 100:
- (20 ÷ 50) × 100 = 40%
- Result: You are exactly 40% of the way to your target.
Using a baseline adjustment ensures that your percentage reflects actual effort relative to your starting point, rather than skewing the data by including your starting weight or legacy business metrics in the progress calculation.
Going Beyond 100%: What Over-Achievement Means for Your Goals
In many tracking systems, 100% is viewed as the absolute ceiling. However, in sales, revenue operations, and SaaS business growth, exceeding 100% of your goal is not only possible—it is highly encouraged.
When your actual progress value is larger than your target goal value, your percentage to goal calculator will return a figure greater than 100%. For example, if your sales team has a quarterly revenue quota of $80,000 and closes $100,000 in deals, the math is:
($100,000 ÷ $80,000) × 100 = 125%
A result above 100% indicates over-achievement. In high-performing sales cultures, tracking this over-achievement is vital for calculating accelerators, bonuses, and overall team performance. Using a robust framework like The Ultimate Guide to Tracking Quota Attainment Per Rep in Salesforce allows organizations to reward reps who push past their baseline targets.
When progress consistently exceeds 100%, it provides two critical insights:
- Under-budgeted Targets: Your team might be sandbagging, or market conditions may be significantly better than anticipated. It might be time to reset targets to keep the team challenged.
- High Velocity: Your processes are working exceptionally well. Analyzing what drove the over-performance can help you replicate that success across other departments.
To maintain momentum, many operations teams choose to reset their targets or establish secondary "stretch goals" once the primary 100% milestone is breached.
Pacing Your Progress: How to Calculate Daily and Weekly Rates
Knowing your current percentage to goal is highly valuable, but it only tells you where you stand today. It does not tell you if you are moving fast enough to hit your deadline. To understand your trajectory, you must combine your progress percentage with a pacing calculation.
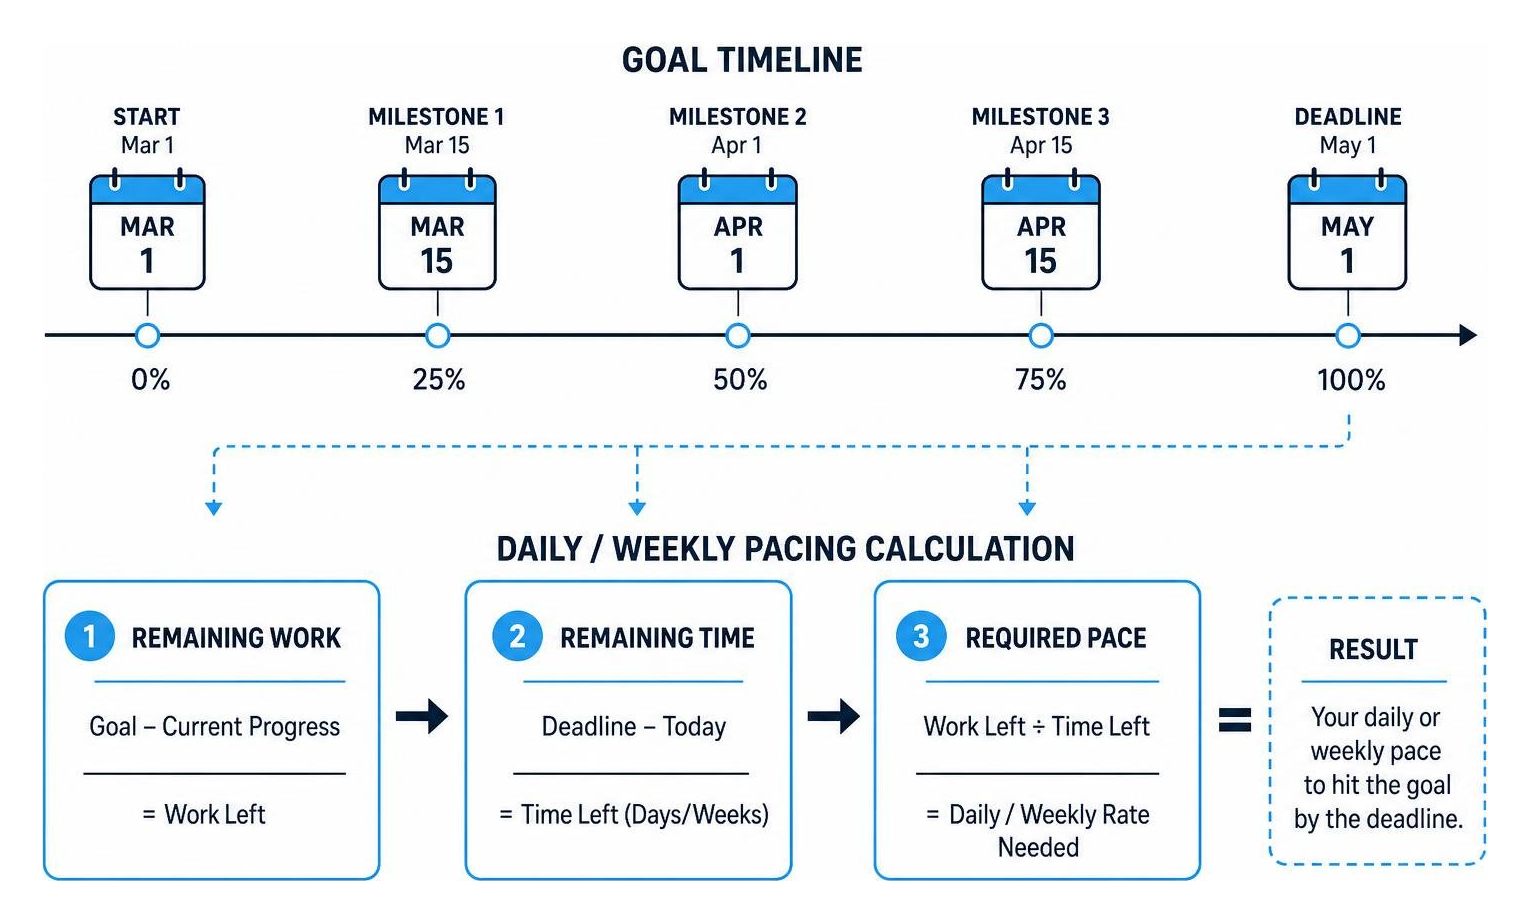
A comprehensive progress tracker does not just answer how much is done, but also how much is left and the required pace to succeed. To calculate the daily or weekly rate needed to reach a goal by a specific deadline, follow this simple process:
- Calculate the remaining work: Subtract your current progress from your target goal.
- Calculate the remaining time: Count the number of days or weeks left before your deadline.
- Divide remaining work by remaining time: This gives you the exact daily or weekly velocity required.
Let's look at a practical example using a savings goal from the Progress Tracker | Visualize Goal Progress with % Bar methodology:
- Target Goal: $10,000 for an emergency fund.
- Current Progress: $3,000 saved (which means you are 30% complete).
- Remaining Amount: $10,000 - $3,000 = $7,000.
- Deadline: 140 days from today.
- Pacing Calculation: $7,000 ÷ 140 days = $50 per day.
By calculating this pacing rate, you can compare your actual daily savings rate against the required $50/day rate. If you are only saving $30/day, you immediately know you will miss the deadline unless you adjust your strategy—even if your progress bar looks encouraging.
Why You Should Track Progress as a Percentage Across Key Areas
Measuring progress in raw numbers can lead to subjective bias and misaligned expectations. Tracking progress as a percentage standardizes performance metrics across different teams, budgets, and timelines.

| Area of Application | Raw Metric Example | Percentage Metric Equivalent | Strategic Benefit |
|---|---|---|---|
| Sales Performance | Closed $15,000 in deals | Achieved 115% of monthly quota | Standardizes performance across reps with different territories. |
| Personal Finance | Saved $5,000 of a $20,000 fund | Completed 25% of savings milestone | Maintains motivation by focusing on cumulative journey progress. |
| Fitness & Health | Ran 26 kilometers out of 30 | Completed 86.7% of target distance | Eliminates daily scale or distance fluctuations to focus on trends. |
| Project Management | Finished 10 out of 100 tasks | Reached 10% project completion | Provides stakeholders with an easy-to-grasp status update. |
In professional environments, utilizing percentage-to-goal tracking has a direct impact on business outcomes:
- 20% increase in quota attainment is commonly reported by organizations that adopt sales performance management tools to make progress transparent.
- 95% sales forecast accuracy is achieved when teams align their pipeline with historical goal attainment data.
- 10% increase in win rates is observed when teams actively track their sales progress and coach reps using real-time goal metrics.
By focusing on the percentage rather than the raw gap, teams can benchmark their performance over time, build historical data, and improve the accuracy of future goal-setting processes. For example, tracking Quota Attainment Improvement by Rep helps sales leaders identify which coaching methods yield the highest growth.
Common Mistakes to Avoid When Tracking Your Progress
While calculating your percentage to goal is mathematically simple, human and operational errors can easily skew your data. To ensure your progress tracking remains accurate and useful, keep these best practices in mind:
- Avoid Baseline Resets: Do not change your starting baseline value midway through a tracking period. Doing so invalidates your historical data and makes it impossible to measure true velocity.
- Account for Non-Linear Progress: Many goals do not progress in a straight line. For example, sales cycles often close heavily at the end of a quarter, and fitness progress can plateau due to water retention. Do not panic if your daily percentage doesn't rise consistently—look at weekly or monthly averages instead.
- Use Consistent Measuring Devices: Always use the same data sources or measuring tools throughout your tracking period to maintain data integrity.
Mistakes to Avoid When Using a Percentage to Goal Calculator
When inputting data into tools like the Percent to Goal Calculator - Progress Bar, Milestones, Gauge Chart or the Percent to Goal Calculator | MyCalcOnline, watch out for these technical slip-ups:
- Unit Mismatch: Ensure your progress and your goal use the exact same unit of measurement. Do not mix dollars with percentages, hours with completed tasks, or miles with kilometers.
- Dividing by Zero: Never set your goal value to zero. If your target is to reduce errors or customer churn to zero, reformulate the goal as "completed error-free days" or use a reduction baseline formula to avoid breaking the calculator.
- Manual Copy-Paste Errors: Relying on manual data entry into spreadsheets is a leading cause of broken formulas and outdated reporting.
To eliminate these manual errors entirely, modern organizations are moving away from manual calculators and static spreadsheets, opting instead for automated dashboards that sync directly with their database or CRM.
Frequently Asked Questions about Goal Tracking
What is a good sales goal attainment rate?
A goal attainment rate of 80-95% is generally considered strong and healthy for most sales organizations. If your team average is consistently above 100%, your targets may be set too low. Conversely, if the average attainment falls below 70%, it may indicate unrealistic goal setting, poor market fit, or a need for better sales enablement.
Can a goal progress percentage exceed 100%?
Yes. If your actual progress value is higher than your original target goal, the percentage will exceed 100%. This indicates over-achievement, which is common in sales performance, fundraising, and savings accounts.
How often should I update my progress metrics?
The frequency of your updates should align with the timeline of your goal. For short-term goals (like daily steps or weekly sprints), update your progress daily. For medium-term goals (like monthly sales quotas), weekly updates are ideal. For long-term goals (like annual revenue targets or multi-year savings plans), monthly updates are sufficient to track trends without getting bogged down in daily noise.
Conclusion
Stop guessing your progress and relying on gut feeling to know where your business stands. A percentage to goal calculator is an invaluable tool for bringing mathematical clarity, objective tracking, and psychological motivation to your personal and professional targets.
However, manually running these calculations, copying data between spreadsheets, and building static charts takes valuable time away from actually executing your strategy.
At atSpark, we believe you shouldn't have to be a math whiz or a SQL expert to know if you're hitting your targets. As an AI-powered analytics platform built specifically for SaaS companies, atSpark unifies your billing, CRM, and subscription data into a single source of truth. Instead of manually calculating progress, you can ask plain-English questions—like "What is our quarterly MRR progress to goal by rep?"—and get instant, beautiful charts and insights.
Ready to automate your progress tracking and unlock the true potential of your data? Explore our guides to SaaS Performance Metrics and SaaS Business Metrics, or dive deeper into mastering your revenue targets with our comprehensive guide to Quota Attainment.