What Is Conversational BI — and Why It Changes Everything
Conversational BI (Business Intelligence) lets anyone on your team ask questions about company data in plain English — and get instant, accurate answers — without writing a single line of SQL or waiting on a data analyst.
Quick answer: Here's what you need to know right now:
- What it is: A data interface powered by AI and natural language processing (NLP) that translates plain-English questions into database queries and returns results in seconds
- Who it's for: Business users — RevOps, Finance, Sales, Marketing — who need fast answers without technical skills
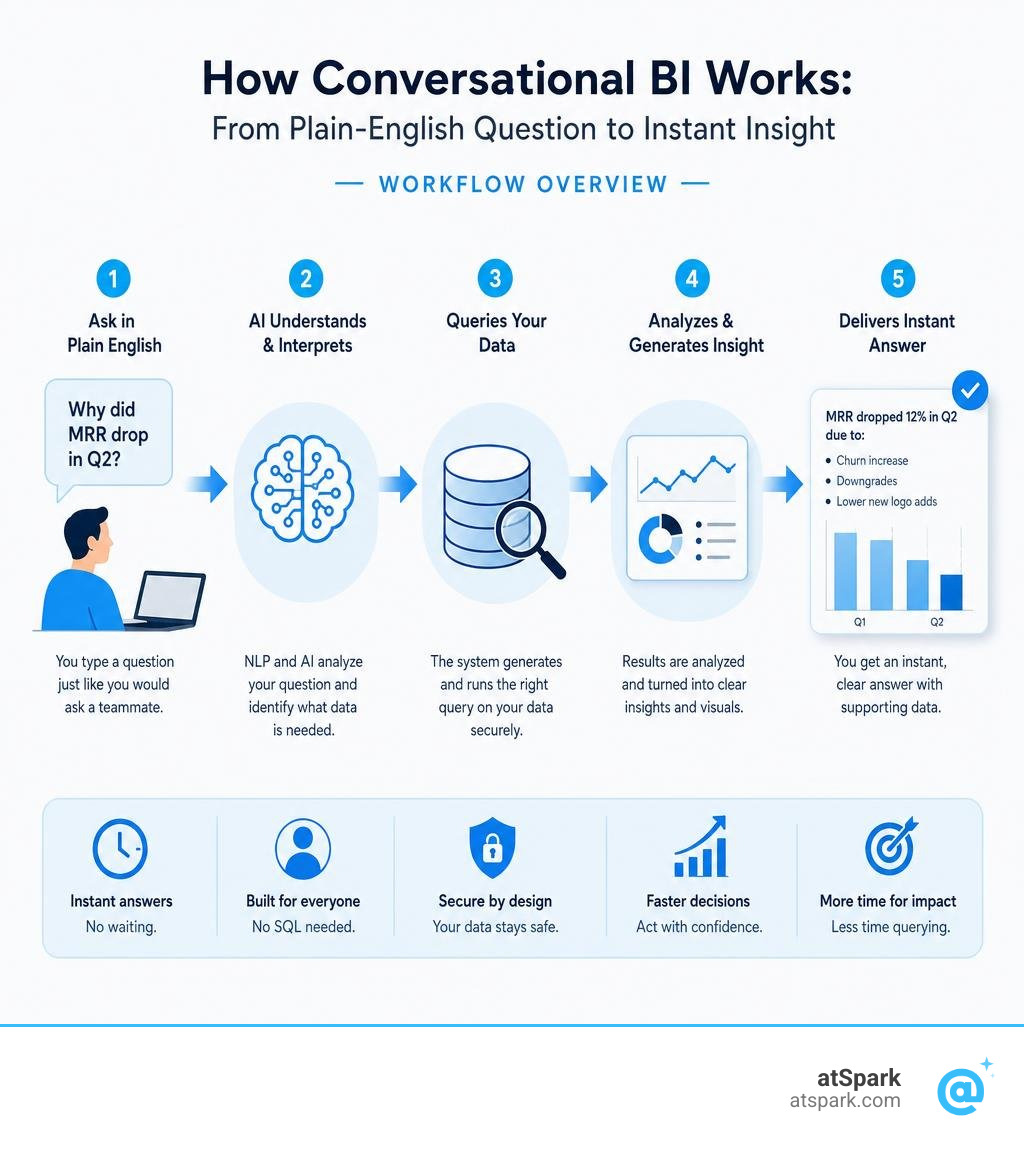
- How it works: You type a question like "Why did MRR drop in Q2?" and the system queries your data, interprets the result, and surfaces an answer with supporting charts
- Why it matters: It cuts time-to-insight by 60–80% and can push platform adoption from under 25% to above 85%
- What it replaces: The back-and-forth between business teams and data analysts for routine, ad-hoc data questions
Here's a question that comes up constantly in boardrooms and RevOps meetings: "We already have dashboards. We already have reports. So why do we need something different?"
The honest answer is that most dashboards are built to answer the questions you expected to ask — not the ones you're asking right now. When MRR dips unexpectedly on a Tuesday afternoon, you don't need a dashboard. You need an answer. And dashboards aren't built for that.
Traditional BI tools put a wall between your business questions and your data. That wall is made of SQL skills, analyst queues, filter configurations, and days-long reporting cycles. For a Finance or RevOps lead at a SaaS company trying to explain a retention dip to the board this week, that wall is a serious problem.
Conversational BI tears that wall down. Instead of adapting to the tool's language, the tool adapts to yours.
Why Modern Teams are Shifting to Conversational BI

In the early days of enterprise software, data was a luxury. If you wanted to know how many customers upgraded their subscription tier last month, you submitted a ticket to the IT department, went to grab a coffee, and hoped for a response by the following Friday.
Then came the era of self-service BI and visual dashboards. It promised democratization, but in reality, it often just shifted the bottleneck. Instead of waiting for a database administrator to write SQL, business teams found themselves drowning in "dashboard fatigue."
Every department ended up with fifty different dashboards, each with twenty different filters. If you wanted to ask a slightly different question — say, combining marketing spend from your CRM with billing data from your payment gateway — you were stuck. You couldn't edit the dashboard yourself without breaking the underlying model, so you went right back to submitting a ticket to the analytics team.
This analyst dependency is a massive drag on decision velocity. While your data scientists and BI engineers should be focusing on complex statistical modeling, predictive forecasting, or deep architectural improvements, they spend up to 80% of their week building minor variations of the exact same revenue reports.
By shifting to conversational bi, organizations are finally achieving true self-service. Instead of forcing business users to navigate complex visual trees, they can simply Ask Your Data Anything Without SQL.
This shift completely changes the math on software ROI. Traditional dashboard adoption rates typically hover around a disappointing 15% to 25%. Most employees simply find the tools too intimidating or too rigid to use in their daily workflows. When you replace those rigid dashboards with a natural language interface, platform adoption routinely skyrockets to 70% to 90%. By making analytics accessible to everyone from the CEO to the customer success team, organizations eliminate wasted license spend and foster a genuinely data-driven culture.
How Conversational BI Overcomes Traditional Dashboard Bottlenecks
Traditional dashboards represent fixed questions asked repeatedly. They are excellent when you need to monitor the exact same five metrics every single morning. But the moment your business environment changes, static reports break down.
If a marketing campaign suddenly goes viral, a static dashboard can show you that traffic spiked, but it cannot easily tell you why those specific users are converting or which regional cohorts are driving the highest expansion revenue. To get those answers, you need ad-hoc queries.
In a traditional setup, running an ad-hoc query requires a high level of data literacy. The user must understand which database tables hold the relevant information, how those tables are joined, and how to write the correct SQL syntax to avoid pulling duplicated records.
Here is how the two approaches compare when put head-to-head:
| Feature / Dimension | Traditional Dashboards & Reports | Conversational BI |
|---|---|---|
| Primary Interface | Rigid charts, complex dropdowns, and static filters | Natural language chat, search bars, and interactive follow-ups |
| Time-to-Insight | Hours to days (if custom analyst work is required) | Seconds (instant automated query generation) |
| User Adoption Rate | Typically 15% to 25% | Typically 70% to 90%+ |
| Handling Ad-hoc Questions | Requires building a new report or modifying SQL | Handled instantly through plain-English questions |
| Data Literacy Barrier | High (requires understanding schemas, filters, and logic) | Low (requires only the ability to ask a clear business question) |
| Analyst Dependency | High (analysts act as gatekeepers for custom views) | Low (analysts focus on governance; users self-serve) |
Key Benefits of Conversational BI for Business Users
For the everyday business user, the benefits of conversational analytics boil down to three core outcomes: speed, independence, and depth.
- Instant Time-to-Insight: Conversational platforms reduce the time-to-insight by 60% to 80%. When you can ask a question and get an answer in five seconds instead of waiting five days for an analyst, your entire operational cadence accelerates. You can make decisions during a live pipeline review or board meeting rather than tabling the discussion for next week.
- Zero-Training Adoption: Because the interface is a chat box, there is no steep learning curve. We believe that dashboard training sessions are an unnecessary barrier to data literacy and should be entirely eliminated. If you know how to send a message on Slack, you already know how to use conversational analytics.
- Unlocking the "Why" Behind the "What": Traditional reports show you the surface-level metrics. Conversational bi allows you to dig deeper through iterative, conversational exploration. You can start with "What was our churn rate last month?", follow up with "Which customer segments drove that churn?", and finish with "Show me the top five accounts at risk of churning next month based on usage drops."
This natural progression of analytical thought is exactly what researchers have highlighted when studying the intersection of human-computer interaction and database systems. For a deeper academic look at how natural language interfaces democratize database exploration, you can read the foundational paper on Conversational BI.
The Core Technical Components of Natural Language Interfaces

How does a conversational BI platform actually translate a loose, potentially ambiguous human sentence into a highly precise SQL query that runs against millions of rows of data? It does not happen through simple keyword matching. Earlier natural language database systems broke down because they tried to map specific words directly to predefined database columns. If a user phrased a question slightly differently, the system collapsed.
Modern platforms use a sophisticated, multi-layered technical architecture to bridge the gap between human intent and machine execution.
- The NLP and Intent Interpretation Layer: This is the entry point. The system takes the raw text input and parses it to understand the user's core intent. It identifies the entities (such as "customers" or "revenue"), the metrics (like "MRR" or "LTV"), and the filters (such as "last quarter" or "North America").
- The Query Generation Layer: Once the intent is clear, the system translates this understanding into the target database's native language (such as SQL or DAX). This is not just about writing a basic
SELECTstatement; the system must understand how to construct complex joins, group data correctly, and apply the appropriate mathematical aggregations. - The Execution and Formatting Engine: The generated query is securely executed against the connected data sources. The engine then takes the raw tabular results and determines the best way to present them. If the user asked for a trend over time, it generates a line chart. If they asked for a breakdown of categories, it builds a bar graph or a structured table.
Semantic Layers and Business Glossaries
The absolute secret weapon of any successful conversational bi implementation is a centralized semantic layer.
Without a semantic layer, LLMs are essentially flying blind. If an executive asks, "What was our profit last month?", the AI might look at the database and find three different columns: gross_profit, net_revenue, and operating_income. Without explicit context, the AI will guess — and in financial analytics, guessing is a recipe for disaster. This is why a lack of trust is the single largest barrier to AI and data adoption in the enterprise.
A semantic layer acts as a translator and a single source of truth. It maps user-friendly business terms directly to the underlying physical database schemas. It defines exactly how to calculate complex metrics (like MRR, LTV, or Churn) so that no matter how a user phrases their question, the platform always uses the approved, standardized calculation.
Centrally defining these business terms ensures that everyone in the company is looking at the same numbers. To understand how this applies specifically to revenue operations and financial metrics, explore our guide on What is AI Revenue Analytics?.
LLMs, Agentic Frameworks, and Hierarchical Memory
To handle complex, multi-turn conversations, modern conversational BI platforms go beyond basic Large Language Models (LLMs) and employ agentic frameworks.
When a user asks a follow-up question like "What about Europe?" after asking about North American sales, the platform must maintain the conversational state. It needs to remember that the active query is still focused on sales, but the geographical filter needs to be updated.
To solve this, advanced systems use hierarchical memory architectures. This prevents the "forgetting" or context-drift issues that plague standard LLM chat interfaces over long sessions. For instance, the Bi-Mem research paper on bidirectional hierarchical memory details how dual-agent systems (using inductive and reflective agents) calibrate local, short-term conversational context against a globally defined user profile to prevent memory hallucinations.
Furthermore, modern architectures are collapsing the traditional boundaries between searching for data and explaining it. Instead of running a separate search engine to find the right database tables and then passing that metadata to a generator, unified architectures are emerging. The UniConv research on unifying retrieval and response generation demonstrates that combining these processes into a single, cohesive model dramatically improves accuracy while slashing infrastructure latency and costs.
To train these models to understand complex relationships in structured environments, developers are increasingly relying on rich, highly contextual datasets. A great example of this is the BioGRID-Conv dataset on Hugging Face, which shows how complex relational networks can be successfully translated into structured conversation formats to train AI models on high-fidelity reasoning.
When to Choose Natural Language Queries vs. Traditional Reports
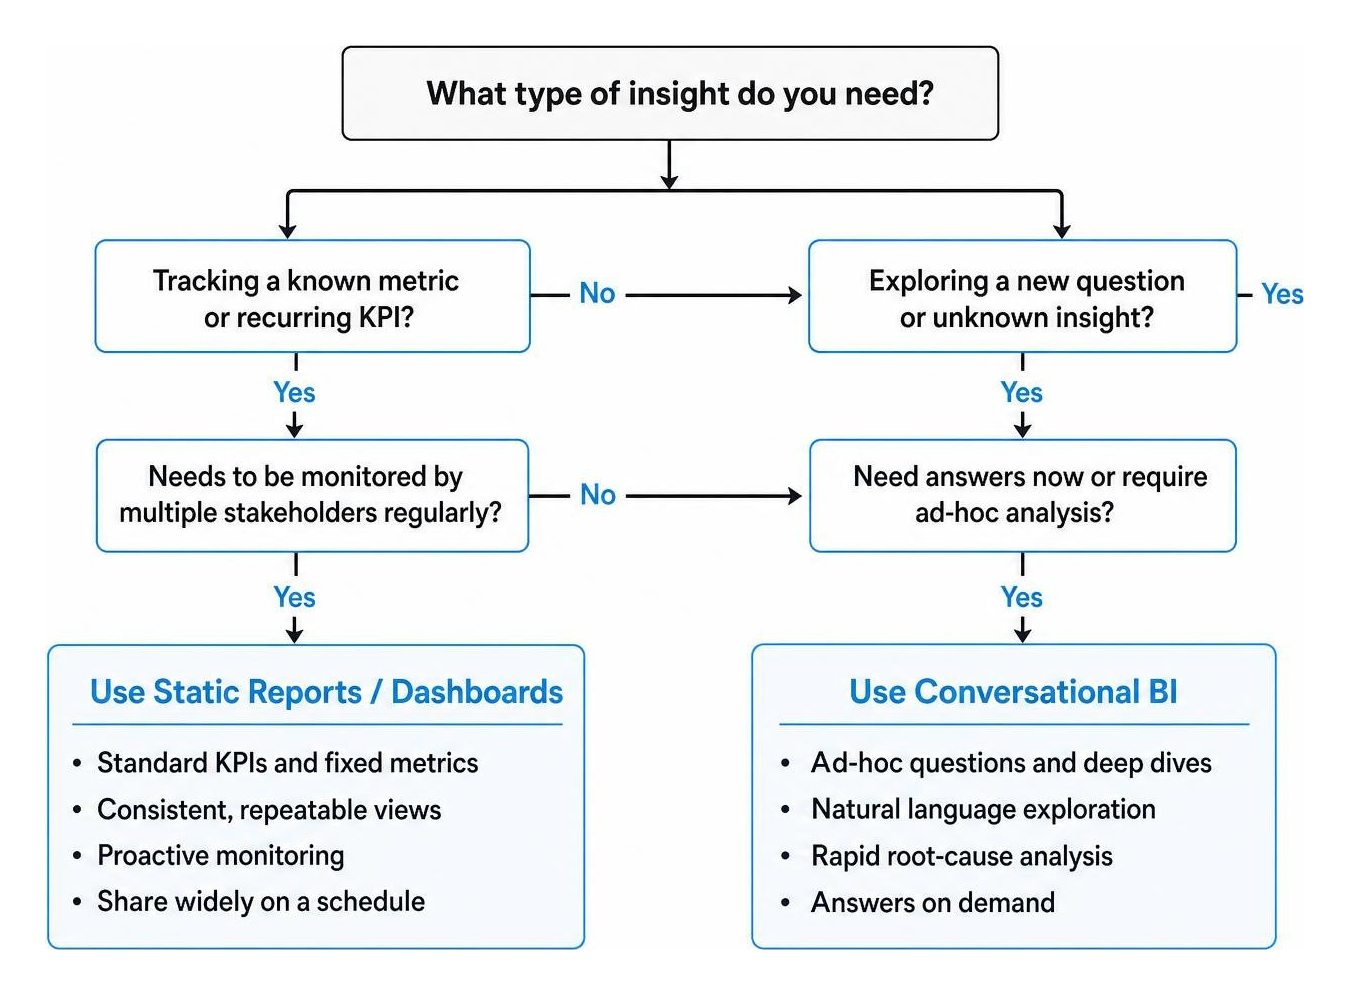
A common misconception is that conversational BI is designed to completely wipe traditional reporting off the map. In reality, they are complementary tools that serve different purposes.
Traditional reports and static dashboards are built for consistency and control. They are the "single source of truth" for recurring, business-critical processes. Your monthly financial close, your investor relations deck, and your regulatory compliance filings should not be generated on the fly by an AI chat interface. These scenarios require a highly structured, deterministic, and audited environment where every pixel is locked down.
Conversational BI, on the other hand, is built for exploration and speed. It is the ultimate tool for open-ended problem spaces where you do not yet know what the next question will be.
Best Use Cases for Conversational Data Exploration
If your analytical needs fall into any of the following categories, conversational queries will offer a massive upgrade over traditional reports:
- SaaS Metric Deep-Dives: Instantly calculating complex SaaS metrics across disparate systems. For example, querying billing data from Stripe and CRM data from HubSpot simultaneously to calculate customer acquisition costs (CAC) by marketing channel.
- Live Strategy and Pipeline Reviews: Instead of pausing a meeting to look up a metric or assigning a follow-up task to an analyst, teams can query their pipeline live. You can ask: "Which enterprise deals in our pipeline have had no activity for more than 14 days?" and get an immediate list.
- Root-Cause Analysis: When a core KPI moves unexpectedly, conversational BI lets you follow the breadcrumbs. You can ask why a metric changed, break it down by region, drill into specific product categories, and isolate the exact variable driving the change in real-time.
To help your team get started with this conversational approach, we have compiled a list of the foundational queries you should run to set your baseline. Check out our guide on 5 Questions to Ask Your AI Revenue Analyst on Day One.
Maintaining Data Governance and Security
Giving non-technical users the power to query databases using plain English sounds fantastic — until your IT and security teams start thinking about the compliance implications. If anyone can ask any question, what stops a marketing intern from asking, "What is the salary of our VP of Product?" or "Show me the home addresses of our European customers"?
This is why robust conversational BI platforms must build data governance and security directly into their core architecture.
To ensure enterprise-grade trust and compliance, a conversational BI platform must enforce several key guardrails:
- Dynamic Role-Based Access Control (RBAC): The platform must inherit and respect your existing database permissions. If a user does not have permission to view payroll data in your database, the conversational interface must refuse to answer any questions related to salaries, failing gracefully and securely.
- Strict Data Masking: Personally Identifiable Information (PII) — such as credit card numbers, social security numbers, or personal email addresses — must be automatically masked or redacted before the AI processes or displays the query results.
- Comprehensive Audit Trails: Every single query generated by the AI, along with the identity of the user who asked it, must be logged in a secure audit trail. This ensures complete transparency and compliance with strict regulatory frameworks like GDPR, HIPAA, and SOC 2.
Frequently Asked Questions about Conversational BI
How accurate is conversational BI in understanding complex business questions?
Modern conversational BI platforms achieve 90% to 95% accuracy in query interpretation, but this high level of precision is not accidental. It relies entirely on how well the platform is configured with domain-specific business context and a robust semantic layer. If the platform has clear definitions of your business terms and metrics, it can interpret complex, multi-nested queries with incredible accuracy.
Does conversational BI completely replace traditional dashboards?
No. They are complementary tools. Traditional dashboards are ideal for monitoring a fixed set of standard KPIs that do not change from day to day. Conversational BI is designed for ad-hoc exploration, rapid root-cause analysis, and democratizing data access for non-technical users who do not need to navigate complex dashboard filters.
How long does it take to implement a conversational BI platform?
Most organizations can successfully deploy a conversational BI platform within 2 to 6 weeks. This timeline includes integrating your core data sources (like your CRM, billing system, and data warehouse), configuring the semantic layer with your company's specific metric definitions, setting up security and access controls, and conducting basic user onboarding.
Conclusion
The era of relying on static, rigid dashboards to run a fast-moving SaaS business is coming to an end. When your team has to wait days for a custom report just to make a routine operational decision, your business is losing momentum.
At atSpark, we believe that your data should speak your language. Our AI-powered analytics platform unifies your billing, CRM, and subscription data into a single, secure environment. It allows everyone on your team to ask plain-English questions and receive instant, beautiful visualizations and actionable insights — completely eliminating the SQL bottleneck and the need for constant engineering help.
By combining a powerful natural language interface with a rock-solid, governed semantic layer, we help SaaS companies boost analytics adoption, accelerate decision velocity, and build a truly data-driven culture.
Ready to see how conversational analytics can transform your daily workflows? Compare atSpark to Traditional BI Solutions and take the first step toward self-service data freedom today.